
Hypothesis Testing #1 — The Trinity Matrix Interpretation of Normality Test
Have you ever wondered what kind of interpretations you can arrive at when you use three Normality Tests at the same time for the same data?
As a quick general rule:
- The Anderson-Darling Test is used to determine if a sample of data comes from a specific distribution, such as a normal distribution. It places more emphasis on the tails of the distribution compared to some other tests. However, not rejecting the null hypothesis (that the data follows a particular distribution) doesn’t unequivocally confirm normality; it simply indicates that there isn’t sufficient statistical evidence to conclude that the data does not follow a normal distribution.
- The Kolmogorov-Smirnov Test compares the empirical distribution function of a sample with a specified distribution function. While it may not be as sensitive as the Anderson-Darling Test, especially in detecting deviations in the tails of a distribution, it is not merely a ‘blanket test.’ It’s a versatile test that can be applied to any distribution, not just the normal distribution, and doesn’t intrinsically assume normality.
- The Shapiro-Wilk Test is particularly sensitive to deviations from normality, including in the tails of the distribution. This test compares the sample data to a normally distributed set of data and is effective in detecting how closely the sample data follow a normal distribution. Its sensitivity makes it a preferred choice for testing normality, especially in smaller sample sizes.

I have provided a table below to help us understand the interpretations better.
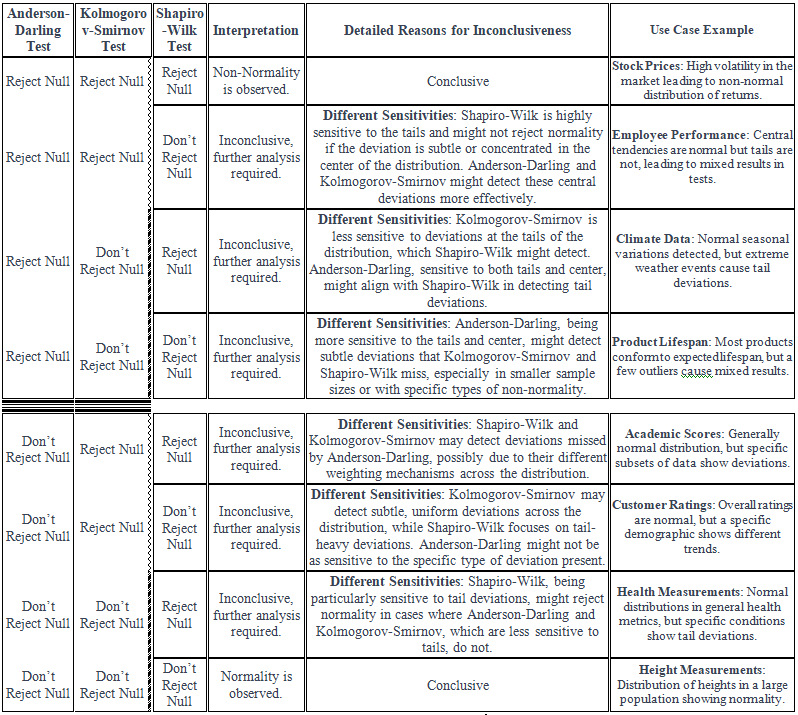
Let’s go through one use case at a time. In the subsequent headers, ‘0’ refers to Reject Null Hypothesis which means it is likely NOT normal distribution and ’1’ refers to Don’t Reject Null Hypothesis which means it is likely a normal distribution.
Anderson-Darling Test (0), Kolmogorov-Smirnov Test (0), Shapiro-Wilk Test (0)
- Anderson-Darling: Detects the extreme fluctuations typical in a financial crisis.
- Kolmogorov-Smirnov: Notices the overall deviation from a normal distribution due to market volatility.
- Shapiro-Wilk: Picks up on the extreme values (tails) resulting from sudden market changes.
Alternative Distribution: Log-normal distribution is commonly used for financial data to account for heavy tails and multiplicative effects.
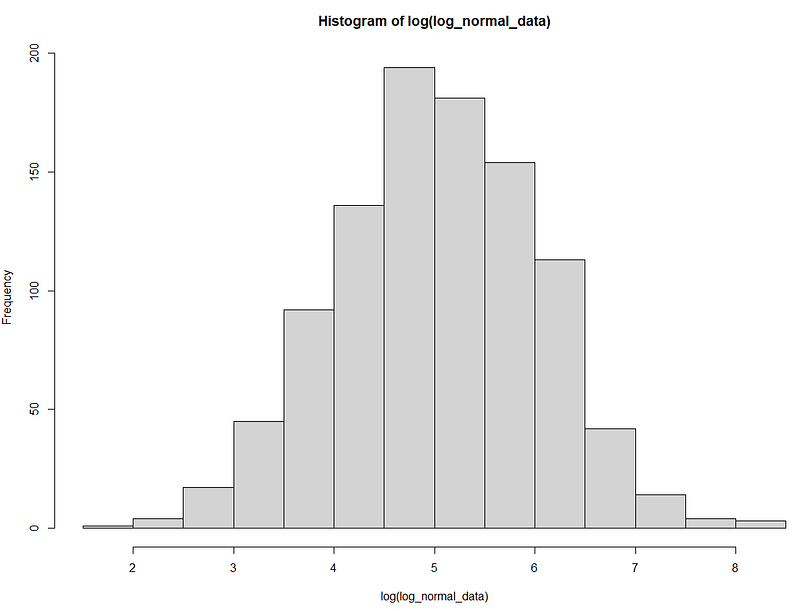
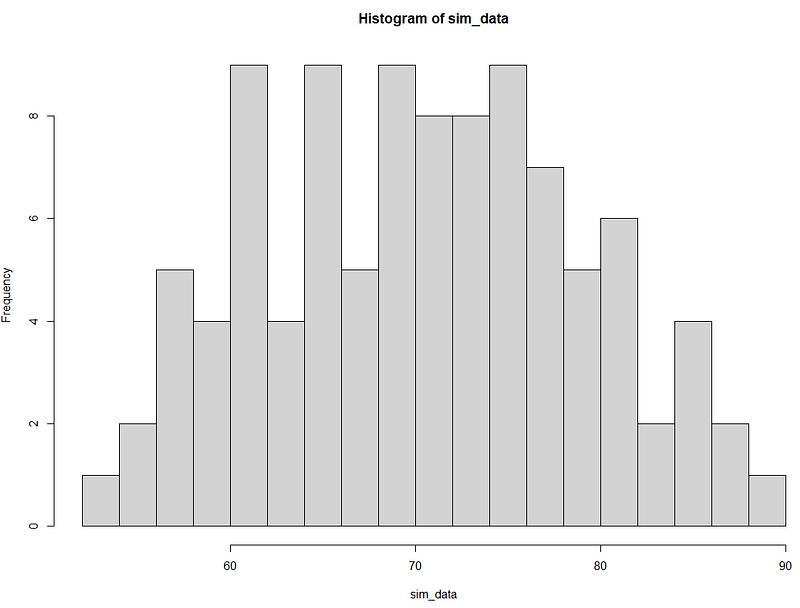
Sample Data
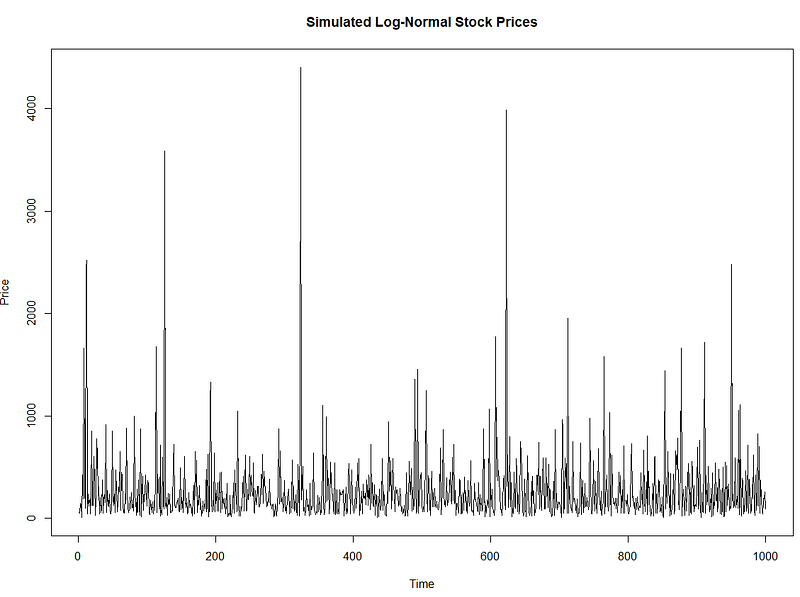
The sample data shows a high fluctuation of data points. But when it is log-transformed, it becomes a normal distribution.
Anderson-Darling Test (0), Kolmogorov-Smirnov Test (0), Shapiro-Wilk Test (1)
- Anderson-Darling: May detect outliers or central tendencies in department-specific performance deviations.
- Kolmogorov-Smirnov: Could miss subtleties in the distribution changes, leading to non-rejection of normality.
- Shapiro-Wilk: Sensitive to tail-heavy data (e.g., exceptional or poor performance extremes).
Alternative Distribution: A Beta distribution for bounded performance metrics (e.g., scores between 0 and 100) or a Gamma distribution for unbounded metrics, especially if the data is skewed.
Sample Data — Gamma Distribution (a display of the theoretical distribution)
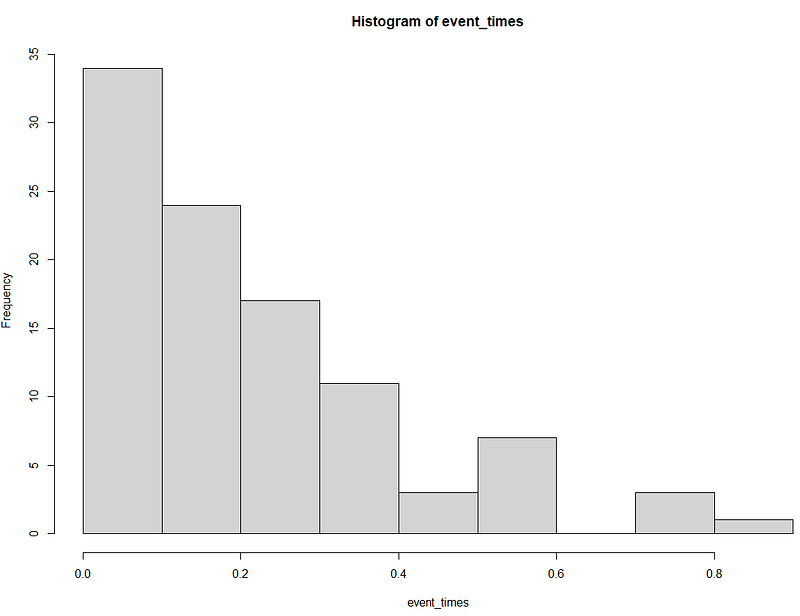
Anderson-Darling Test (0), Kolmogorov-Smirnov Test (1), Shapiro-Wilk Test (0)
- Anderson-Darling: Captures overall anomalies including both central and tail deviations caused by extreme weather.
- Kolmogorov-Smirnov: Might not identify tail deviations as effectively, leading to a non-rejection of normality.
- Shapiro-Wilk: Detects tail deviations due to extreme weather events.
Alternative Distribution: Exponential for single extreme events or a Generalized Extreme Value (GEV) distribution for modeling the tails associated with extreme weather patterns.
Sample Data — Exponential Distribution (a display of the theoretical distribution)
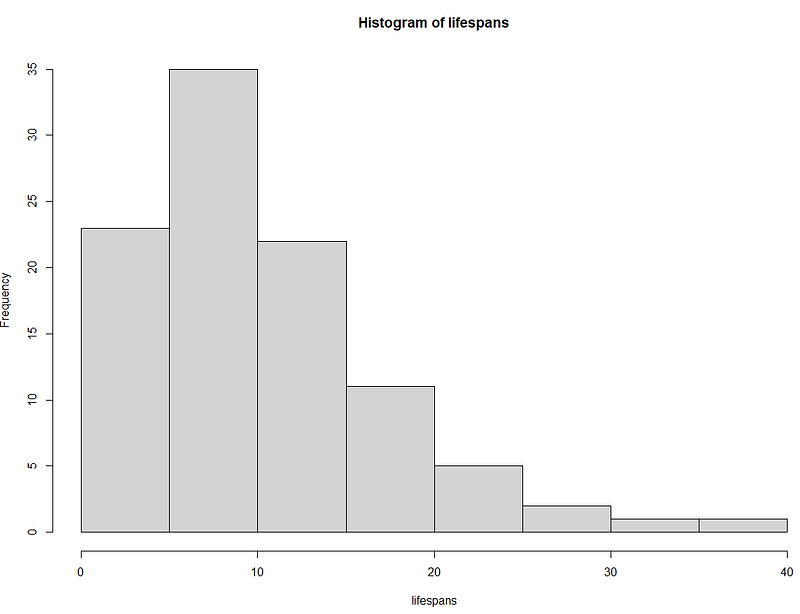
Anderson-Darling Test (0), Kolmogorov-Smirnov Test (1), Shapiro-Wilk Test (1)
- Anderson-Darling: Sensitive to the presence of defective products (outliers) in the lifespan data.
- Kolmogorov-Smirnov: Might not pick up subtle deviations due to a few defective products.
- Shapiro-Wilk: Likely to detect extreme cases (defective products), causing rejection of normality.
Alternative Distribution: Weibull distribution, commonly used for reliability and life data, especially useful for its flexibility in modeling various types of failure rates.
Sample Data — Weibull Distribution (a display of the theoretical distribution)
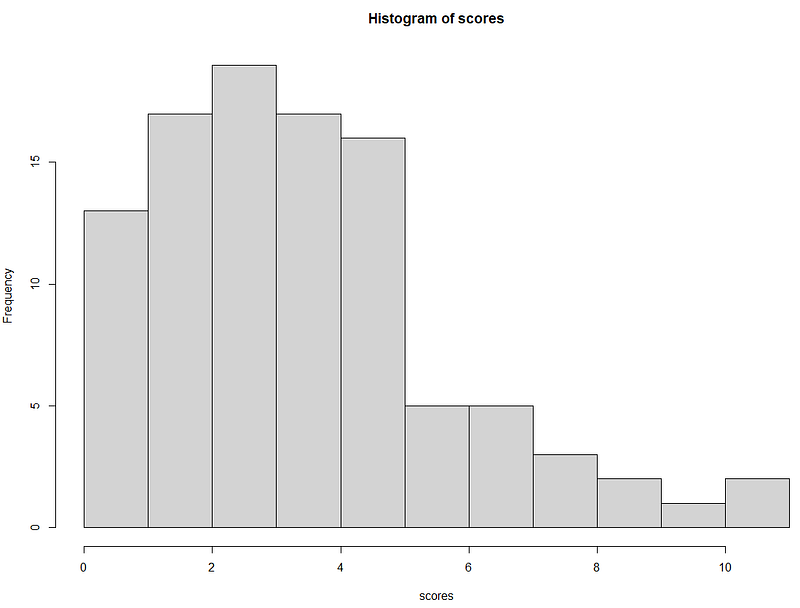
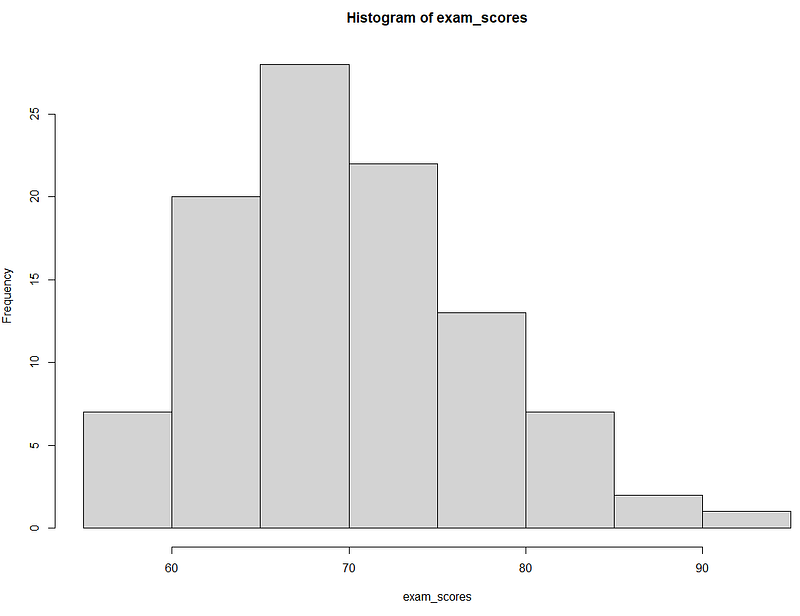
Anderson-Darling Test (1), Kolmogorov-Smirnov Test (0), Shapiro-Wilk Test (0)
- Anderson-Darling: Detects any central or extreme deviations in the distribution due to a specific class or subject.
- Kolmogorov-Smirnov: Might overlook tail deviations or subtle changes in the scores.
- Shapiro-Wilk: Sensitive to any extreme clustering of scores (very high or very low).
Alternative Distribution: A multimodal distribution (a mixture of normal distributions) could be suitable if there are distinct clusters of scores, or a Poisson distribution for count-based scores.
Sample Data — Poisson Distribution (a display of the theoretical distribution)
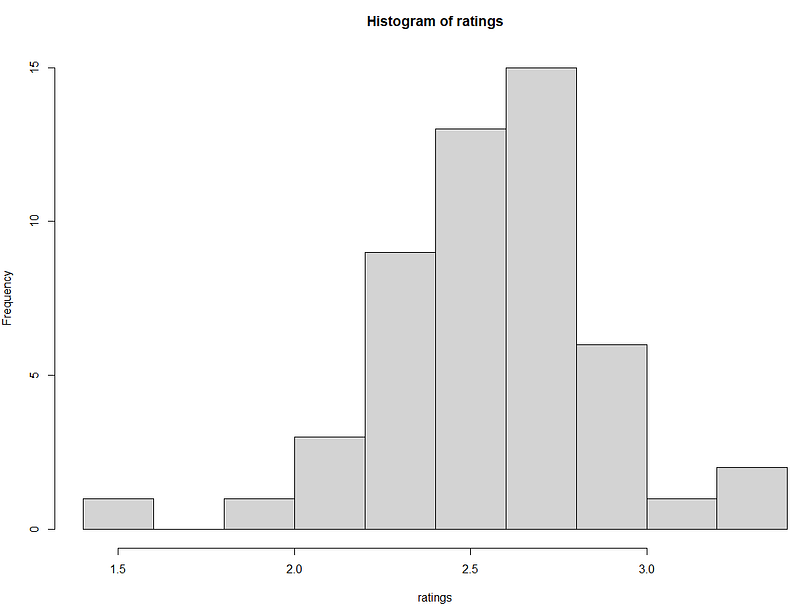
Anderson-Darling Test (1), Kolmogorov-Smirnov Test (0), Shapiro-Wilk Test (1)
- Anderson-Darling: Could identify overall deviations due to a specific demographic.
- Kolmogorov-Smirnov: Might not detect subtle deviations in the ratings by different demographics.
- Shapiro-Wilk: Picks up on tail-heavy distributions if a demographic has extreme views.
Alternative Distribution: A skewed distribution such as a Beta distribution for bounded rating scales (e.g., 1–5 stars) or a skewed normal distribution for more flexibility in unbounded scales.
Sample Data — Skewed Normal Distribution (a display of the theoretical distribution)
Anderson-Darling Test (1), Kolmogorov-Smirnov Test (1), Shapiro-Wilk Test (0)
- Anderson-Darling: Identifies abnormalities in general health metrics including extremes caused by specific conditions.
- Kolmogorov-Smirnov: Could miss the nuances introduced by conditions like diabetes.
- Shapiro-Wilk: Highly sensitive to deviations in the tails caused by health conditions.
Alternative Distribution: A skewed distribution such as Gamma or Beta, depending on whether the data is bounded, can be more appropriate for health data with skewness.
Sample Data — Beta Distribution (a display of the theoretical distribution)
Anderson-Darling Test (1), Kolmogorov-Smirnov Test (1), Shapiro-Wilk Test (1) — All three tests agree on normality
- Anderson-Darling: Confirms normal distribution due to the large, diverse sample.
- Kolmogorov-Smirnov: Aligns with normal distribution findings given the overall sample shape.
- Shapiro-Wilk: Agrees with normality as there are no significant tail deviations in a large population.
This concludes the discussion for normality test — our first discussions for hypothesis testing.
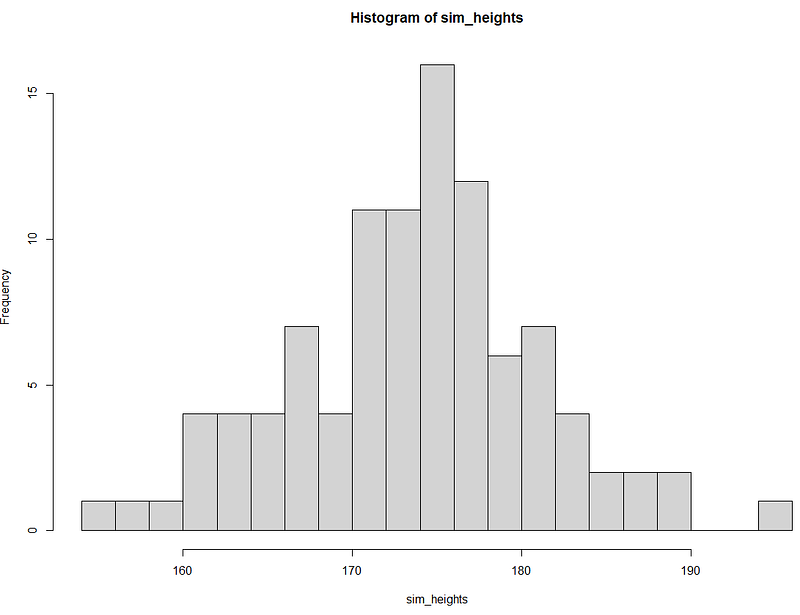
Sample Data — Normal Distribution (a display of the theoretical distribution)

Daniel started off his career as a senior list researcher with a British publishing firm. Back then, his role involved contact sourcing through the internet and performed data entry into the Microsoft Dynamic CRM system. (Microsoft Dynamic CRM 3.0) Progressively, he explored the option of using Visual Basic scripting within excel to automate the contact sourcing process.
He successfully developed and implemented the scripts, leading to 95% increase in data entry efficiency. He then moved on to take on the role of a CRM executive with Fuji Xerox Singapore.
As a CRM executive, he liaised with third party vendor for technical enhancement of the CRM system (Microsoft Dynamic CRM 4.0 and 365). He also performs functional enhancement of the CRM system for hundreds of end users.
His notable achievement was the development of the CRM boy that led to 98% improvement in data quality and data integrity in the CRM system. Following his Masters studies in Consumer Insight with Nanyang Business School, he took on the role of an Analytics instructor with Singapore Management University. He prepared class notes and technical walkthrough, and taught Analytics to the undergraduate students from various disciplines. Subsequently, he took on various roles as consultants in the consultancy, manufacturing and information technology industries in Singapore.

He travelled to Paris, London, Sri Lanka, Japan and Malaysia to fulfill his role as a consultant. The cultural and professional exchanges between local and overseas data analytics had given him a very good overview of the expectations and motivations from people around the world. He also had a chance to relocate to the United States for one year, particularly focusing on Operations Management.
Prior to his current freelance status, he took on the role of the Data Science Lead in a Singaporean software company. His primary role was to develop Artificial Intelligence using logic, data science and machine learning techniques through in-depth, full-stacked scripting. He also developed customized Reporting for his customers. In his point of view, 95% of today’s reporting can be automated, which can free up staff from daily manual work.

He holds a Bachelor of Science in Marketing (BSc. Marketing Pass with Merit) from Singapore University of Social Sciences (in which he graduated as a Valedictorian), a Master of Science in Marketing and Consumer Insights (MSc. Marketing and Consumer Insights) from Nanyang Technological University, a Doctor of Business Administration (DBA) from Swiss School of Business and Management.


