
How To Monitor a Distributed System with a NestJS Application
Let us take a look into NestJS’ internal healthcheck module, and combine it with a Prometheus client

Nowadays, it is essential to monitor our application for availability (for example, in a Kubernetes cluster) and to ensure that all dependencies are achievable to provide the user with a good experience.
Additionally, it is important to check a service’s dependencies (e.g., a database or authorization system) and report their unhealthiness.
There are numerous applications and frameworks that make this possible. But in this article, I want to focus on NestJS, Terminus, and an embedded Prometheus client framework.
A Distributed System of Microservices
On many platforms, we can see how a system of dependent microservices is developed to satisfy the customer (e.g., Ebay TECH, Facebook). The biggest challenge is to ensure that all microservices can be reached by each other and thus to provide fail-safety to keep the customer happy. If a service is not available (e.g. network problems) or even fails, a responsible person has to get notified, and the service restarts itself if necessary.
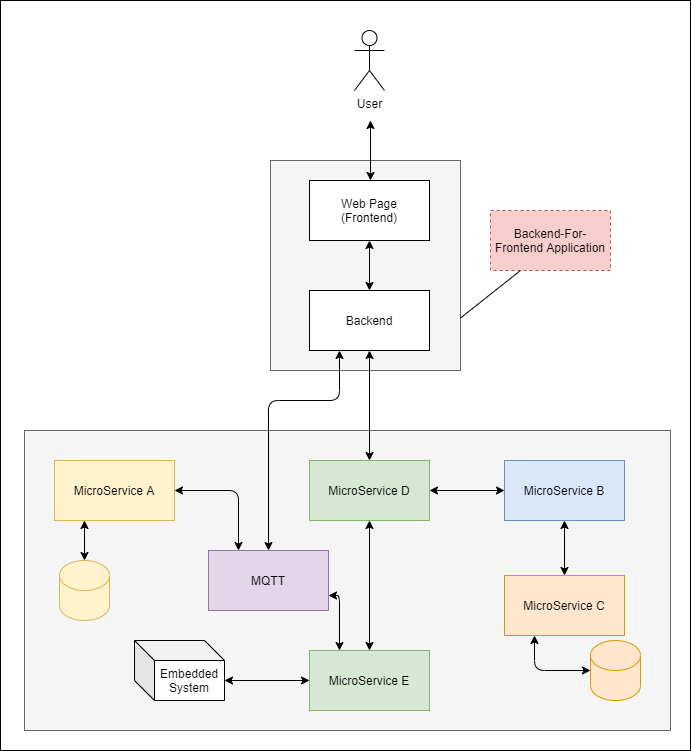
In order to monitor a service, it must be guaranteed that an endpoint can be continuously queried to see if the service is doing well. This can be used to check whether, for example, database connections still exist, dependent services are still accessible, or whether enough memory is available.
The endpoint itself is called Health Check. Information, for example, about used memory is called Metrics. Other examples of metrics would be how many users are currently logged in, the number of server requests processed per second, or how many error messages are thrown per hour.
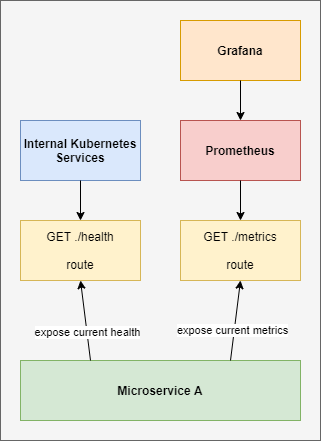
Health Checks can be used by Kubernetes to restart the service when it reports itself as unhealthy. Metrics can be used to display the current state of the system in a dashboard or alert the development team when the system is unhealthy — this can be realized with Prometheus and Grafana.
Getting Started with Health Checks (Terminus) of NestJS
Since the definition of “healthy” or “unhealthy” varies with the type of service you provide, the NestJS Terminus integration supports you with a set of health indicators.
For this tutorial I chose a workspace of Nx to create a Backend-For-Frontend (BFF) application to keep the effort low and so we can understand it better. To initiate a new workspace, we need to follow these instructions:
If we are already familiar with Nx, we only need to execute the command below and configure our workspace. For this example, NestJs and Angular are chosen.
$ npx create-nx-workspaceNext, we need the additional Terminus module:
$ npm install --save @nestjs/terminusAfter that, we can create a module, where we add all dependencies of the upcoming health check feature, e.g. a controller and a service:
$ nest g module health
$ nest g controller health
$ nest g service health
To get started with the first health check, we need to import the TerminusModule into the HealthModule created above, that should look like this now:
To decouple and encapsulate our features or use cases, we should always use modules. This makes it easier to exchange things later on (maybe we will find another health check engine), maintain or refactor it, and make it more transparent for other developers.
This is the first step in laying the foundation for the health check implementation.
Getting Started with Prom-Client for Prometheus Metrics
prom-client is the most popular Prometheus client library for Node.js. It provides the building blocks to export metrics to Prometheus via the pull and push methods and supports all Prometheus metric types such as histogram, summaries, gauges, and counters.
Now we need to install the prom-client to expose different metrics of an application and to add custom metrics made by ourself:
$ npm install prom-clientTo encapsulate the library in a service, we need to create a new module and a service within (the same as we did with HealthModule):
$ nest g module prometheus
$ nest g service prometheus
After that, we can wrap the functions we need for our use case. With this wrapping we decouple the hard bond between library and client. This makes it easier to replace them later without having to make major code changes in the client.
In this case I want to register default metrics with collectDefaultMetrics(…), add new custom metrics by name with registerMetrics(…) and want to have a possibility to remove a custom metric with removeSingleMetric(…).
A good alternative for the Prom-Client library is Swagger-Stats.
Indicators
As we have already seen in the NestJS tutorial, there are different types of indicators to check availability of other modules / services / microservices and so on. For this tutorial we only need HttpHealthIndicator and custom health indicators.
For the sake of completeness, all indicators are listed here:
- HttpHealthIndicator
- TypeOrmHealthIndicator
- MongooseHealthIndicator
- SequelizeHealthIndicator
- MicroserviceHealthIndicator
- GRPCHealthIndicator
- MemoryHealthIndicator
- DiskHealthIndicator
An Indicator is a good place to combine health check logic with metrics logic for a particular context. For example, if a pending service is no longer available, this should be visible in the health check endpoint on the one hand and reported to an alert engine like Grafana on the other hand, so that a responsible persons get notified.
To combine Health Checks (by Terminus) with Metrics (by prom-client) we can create an abstract base class that extends from Terminus’s HealthIndicator and supports the encapsulated prom-client with Object Composition — two basic principles for reusing existing code.
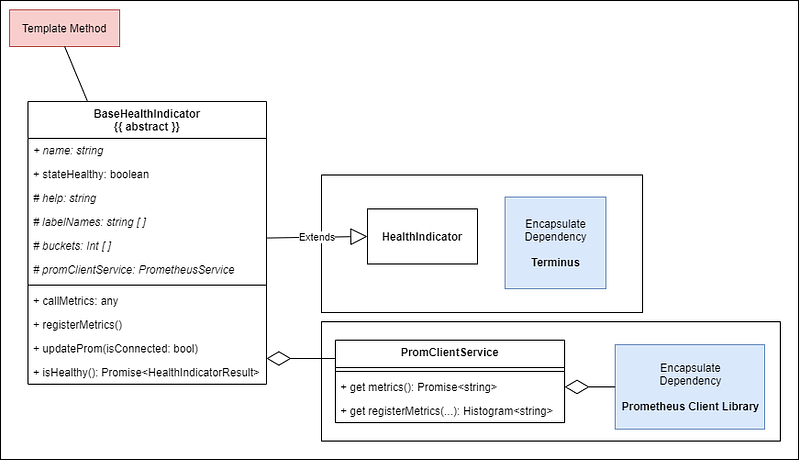
Of course, we do not have to enable metrics for every dependency. Sometimes we only want to offer the health check for a certain service. For this, we leave the PrometheusService optionally.
In order to have a uniform contract between the health-indicators, we can define an interface to be able to create them later with Dependency Inversion.
Now we can create an extended indicator class for a specific endpoint with a specific type of indicator like an HttpHealthIndicator. If we have more custom implementations we could name the class like the context or use case (e.g. ServiceXYHealthIndicator), or if we want the class more default, we could name it like the Terminus indicator type (e.g. CustomHttpHealthIndicator).
Its only responsibility (Single-responsibility principle) is to provide a function that reports the current status of the service health.
If we have any other dependencies or services (e.g. database connections, or publish/subscribe messaging service) we want to monitor, we can set up a custom health indicator according to our needs.
Routes for Health Checks and Metrics
To collect these health information as implemented above for every single dependency, we need to create a HealthService that captures data from the indicators and a MetricsService to expose this data (e.g. for a Prometheus server or internal Kubernetes services).
Inside the HealthService we create the instances of the indicators we want to support and implement the Terminus’ HealthCheck function.
This information can be exposed directly via a REST endpoint GET /health by a controller.
For metrics, we can offer a separate service as well as a controller to decouple everything more strongly:
$ nest g module metrics
$ nest g service metrics
$ nest g controller metrics
The MetricsService calls the HealthService to trigger the check of the current health values and update the metrics in its classes.
The REST endpoint GET /metrics looks very simple:
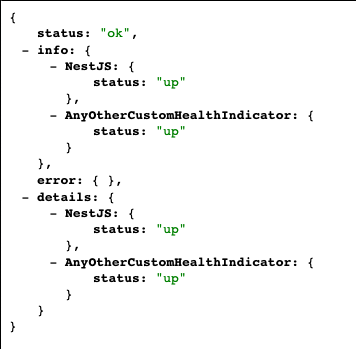
Finally, we can visit http://localhost:3333/api/v1/metrics and http://localhost:3333/api/v1/health to checkout our current health status and look at our metrics:
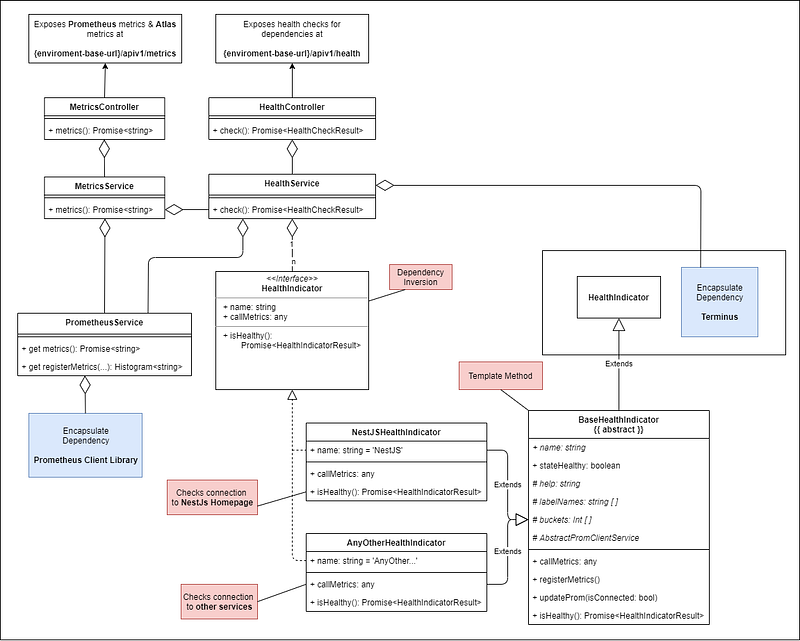
Final NestJS Architecture
I am a big fan of drawing architectural UML diagrams or sketches. So, here we can see the final architecture of the health check and metrics implementation.
Run Prometheus and Grafana with Docker Compose
At last, we need a possibility to collect these metrics and show them in a monitoring dashboard. Prometheus and Grafana are good choices for this. An alternative would be Telegraf and an InfluxDB.
Docker-Compose is a good tool for running these two services on the fly in parallel. A simple YAML file can look like this:
Prometheus needs an additional configuration where we define which endpoints we want to scrape. In this case we want to collect the metrics of the NestJS application. If we run our development application at URL localhost:3333, we need to enter host.docker.internal:3333 as target to ensure that the Prometheus server reaches the endpoint:
To run both containers we only need to run following command:
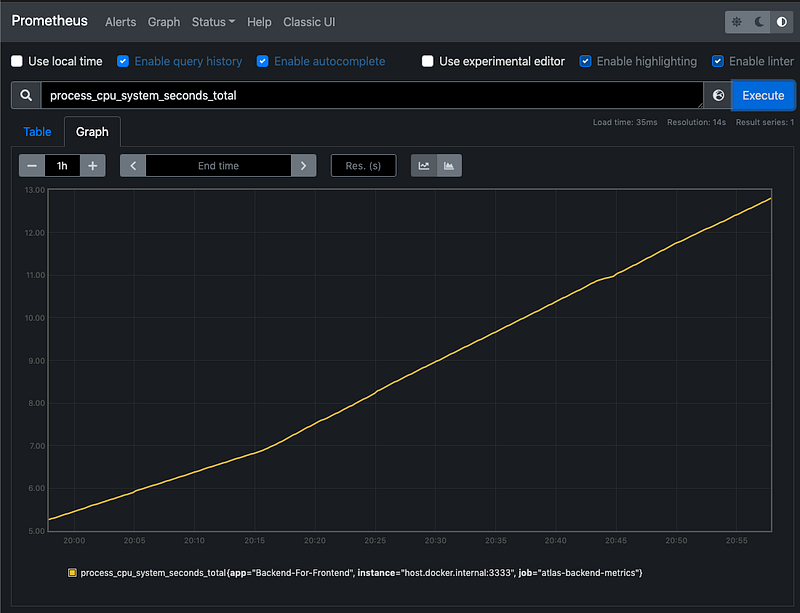
$ docker-compose upAfter the containers are started, we can access http://localhost:9090/ to open the graph of the Prometheus server. There we can look at some scraped metrics:
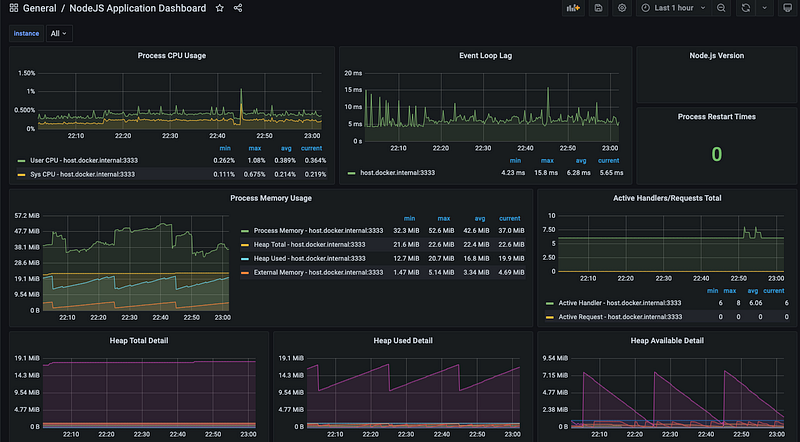
Grafana is accessible at http://localhost:3000/ . There are already a lot of prefabricated dashboards (e.g. for NodeJS) out there. We only need to import them via an ID.

Example Project on GitHub
We can find the example project on GitHub. In this, we can find an API with the implementations showed above and an Angular frontend application that consumes the health route.
Conclusion
Monitoring is a very important aspect to ensure maximum availability of a service to the user. Health Checks are a good way to assess the availability status of a service or an application. NestJS provides the tool Terminus for this purpose. Another aspect is that, as an operator we want to monitor various metrics, such as CPU usage or available memory, so that we can react to the risk of missing resources early on — with the prom-client a powerful tool is put at hand here.
I hope I could help that our application can be monitored more now.
Thanks for reading! Follow me on Medium, Twitter, or Instagram, or subscribe here on Medium to read more about DevOps, Agile & Development Principles, Angular, and other useful stuff. Happy Coding! :)


