

How To Manipulate Data
“Numbers don’t lie, but it’s easy to lie about them.” — Albert Einstein¹
A large part of our modern society has cult-like faith in data. If you show a fancy-looking pie chart or a colorful scatter plot, people will find your statements three to five times more trustworthy (source).
Ask anyone who has worked in a big corporation if you don’t believe me; they will all agree many PowerPoint presentations include manipulative lies.
Fun fact, the link I used as a source above is an article about fake scientific research. But it doesn’t matter because while 87% of people don’t click on the links, 85% find stories more credible if they include links (source).
(Yes. I did it again, but with a different article this time.)
After manipulating you in the introduction, I will show you how to manipulate data, whether you’re an unknown blogger like me, a journalist working for a renowned newspaper, or a scientist with a Nobel prize.
#1 — Naming the Data
“Life expectancy is the death-weighted average of the reciprocal of the survival-specific force of mortality.” — Source
Which one sounds better? Bold or italic?
Life expectancy is all about when we die, but we call it life. That’s already manipulative.
But what is more manipulative is that life expectancy is an average. When people talk about life expectancy, they usually say we are living much longer than before. It’s true, but I wouldn’t say “much longer.”
The main reason for the increase in life expectancy is a significant decrease in infant mortality.
Consider these two scenarios:
- 50% of the population dies at 5, and 50% dies at 70. The life expectancy is 37.5 (=50%x5+50%x70)
- 1% of the population dies at 5, and 99% dies at 70. The life expectancy is 69.4 (=1%x5+99%x70)
Life expectancy almost doubled, increasing from 37.5 to 69, but it’s misleading to say people are living longer.
This is not exactly what happened in the real world, but it’s not far from the truth.
“The child mortality rate in the United States, for children under the age of five, was 462.9 deaths per thousand births in 1800.” It was 7 per thousand births in 2020. In other words, it was around 50% in 1800, and it’s 1% today. (Source: Statista)
#2 — Describing the data
In the first sentence of this article, I wrote, “a large part of our modern society.” What does “large part” mean? It’s not a mathematical definition.
I could also have said the majority of the population. Would it be relative or absolute?
- If absolute, it can mean anything from 50.01% to 99.99% of the population.
- If relative, it’s even worse. You could imagine ten propositions, each supported by 9%, except for the last one, which would have 19% of support (9x9%=81% + 19% = 100%).
Is it a majority when only 19% of the population agrees?
Yes. The last proposition received a plurality, sometimes called a simple majority (19% is greater than 10%), but it’s not an absolute majority (19% is lower than 50.01%).
Saying that the (simple) majority of the population support option ten would be (formally) true. If you want to manipulate people, you could easily forget about the parenthesis and say the majority supports option 10.
Here’s another example. The majority of the population recommends my articles is a true statement. 99.9999997% (8 billion) have no idea who I am and didn’t answer, 0.00000025% (22 people) said they were OK, and 0.00000005% (4 people) said they would never read my stories.
#3 — Relativizing the data
Let’s consider populations A and B. Population A (B) is a group of 27 (3) million people. In both populations, part of the people do a “thing.”
Here’s the data.
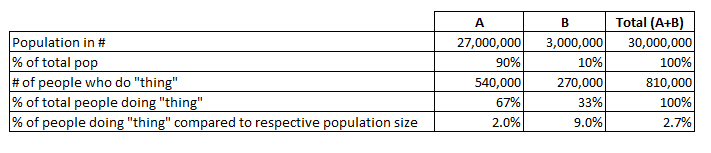
Depending on the narrative you would like to push, you could say either one of these (all true) statements:
- The majority of “thing” is done by population A (540,000 compared to 270,000).
- Population A does the “thing” twice more than population B.
- People from population B are more than four times more likely to do the “thing.” (9.0% compared to 2.0%).
- Population B represents 10% of the total population but does 33% of the “thing.”
You might think relative numbers are less manipulative, but you would be wrong.
Context is everything. Consider this statement:
- “This concerns only 0.5% of the population; who cares?”
Canadians would care if “this” was about Canada since they represent 0.5% of the world population (40 million versus 8 billion).
Note that I could have said:
- “99.5% of the population isn’t concerned by this. Let’s skip to the next point on our agenda.”
It’s the same, but most people react differently to the two versions. Particularly if I add some emotion to the mix:
- 99.9% of the population is safe.
- 8 million people suddenly died yesterday.
(0.1% of 8 billion is 8 million)
Conclusion
It’s hard (impossible) to make informed decisions without data, but remember that ill-informed or intentionally misleading people can easily manipulate data.
I wish I could tell you this article will change your perspective forever, but studies show that even if we’re informed, it’s still easy to manipulate us. (Real studies, not the ones I quoted in the introduction.)
So I will have a more modest wish.
I hope this article will help you ask questions about data in the future.
¹ As you might have guessed, lying about quotes is even easier.
Smillew is a Medium artiste. As such, he shamelessly lies and begs for money on ko-fi. He also manipulates readers into subscribing to his Substack.


