
How To Know If A Stock Is Worth Investing In 3 Seconds
Otherwise, bin the stock.

What if I told you that you don’t need to read the Financial Times, devour hundreds of pages of company spreadsheets, or endure the crazy antics of Jim Cramer on Mad Money screaming about worthless stocks?
Most of the things you believe to be true about choosing stock investments will likely lose you money and place you with the 90% of investors who fail.
Some traders and investors are profitable with various investment strategies, although some methods are more challenging to master than others.
One such method uses fundamental analysis. This is where you look at a stock’s company files, including its assets, revenue, and expenses, and determine if the company will likely be a strong investment choice.
The problem with this method is that it does not reveal the immediate potential of a stock. Even if the fundamental analysis looks good, it does not necessarily mean the value of the stock will go up.
It could take one, five, or even ten years to see the stock price rise substantially.
Technical analysis, another popular investing method, allows you to read the company’s stock price on a chart. This type of analysis gives us more information about the current opportunities present in a stock.
Not ten years from now, but within the next few days or weeks.
Many private investors, however, lack the necessary understanding of how to use this method correctly.
Investors who learn to read the technicals can determine if a stock is worth an investment in just three seconds.
If it takes longer than that, then it is probably not worth another glance. Invest your hard-earned money in another stock.
After speaking with a number of fundamental investors over the years, I have found that they tend to use an element of technical analysis to help determine when to enter into an investment.
This should tell you everything you need to know about how effective technical analysis is.
By focusing on technical analysis, trend-followers like myself have found an efficient and simple method of identifying, selecting, and investing in stocks that produce consistent results when the market moves.
Stocks Investing Is No Different From Following Fashion Trends
In fashion, people tend to conform to and follow the trend. They wear what is stylish and cool for the moment, endorse what celebrities and influencers are wearing, and then swiftly transition to the next fashion trend, perpetually following the crowd.
Trend-following is similar.
You can follow and invest in the stocks that are generating consistent profit, and once they stop producing profit, you follow the money and move to the next lucrative stock.
Following the trend is a simple investing style, yet it remains largely unknown to investors. The ones that come across this approach find it challenging to fully grasp its concept.
It requires a unique level of understanding.
It won’t make money each and every day, which the 90% of losing traders try to do. But it can return a good profit at the end of each trend cycle if managed well.
Trends are only identifiable by looking at the technical aspects of a stock’s chart.
Health Equity is an example of a stock that looks good on paper. Investors.com has ranked it as one of their stocks to buy. With an earnings per share rating of 90 out of 99, the stock is deemed a strong stock to invest in.
The stock’s chart paints a different picture.
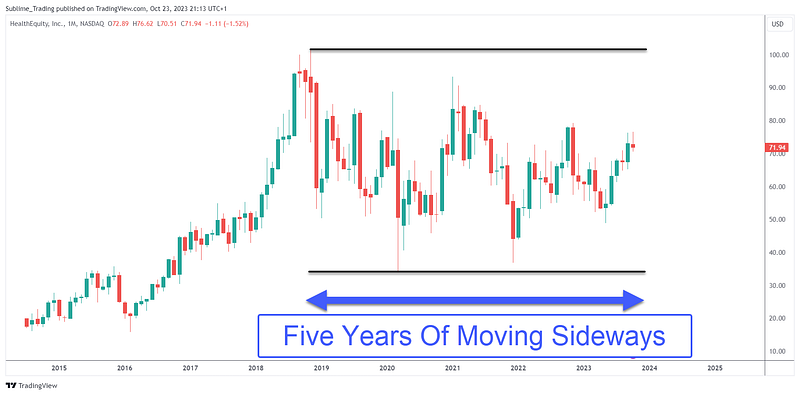
The fundamentals of this stock look good, but the stock’s price has been stuck, oscillating between $34 and $101 for five years.
The stock might perform well in years to come, but some stocks can move sideways for ten years or more. Who has the time to wait for that?
The objective of investing is to make a profit, rather than enduring prolonged fluctuations in the value of your fund.
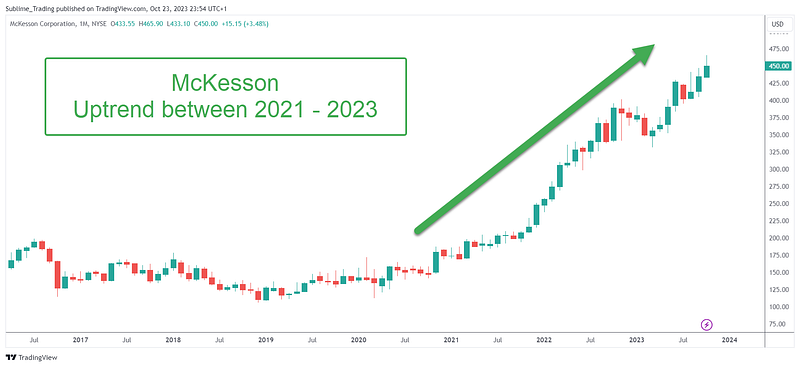
Without looking at the fundamentals of McKesson, it becomes abundantly clear, just from looking at its chart, that this stock is moving up.
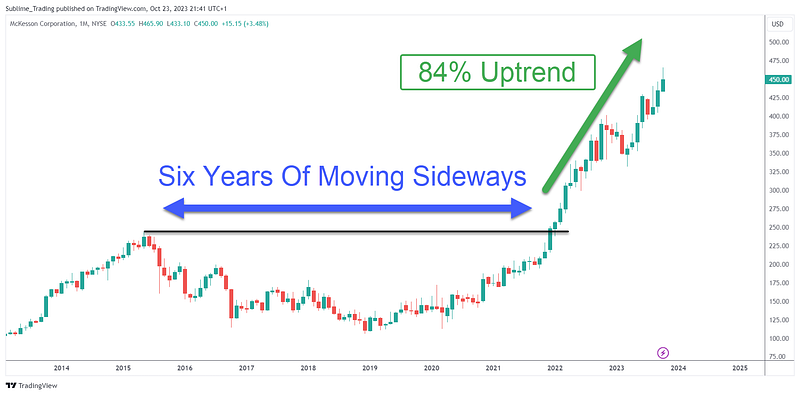
Like Health Equity, this stock was stuck in between two prices, oscillating between $106 and $243.
Using technical analysis, the sideways period told us to avoid investing in the stock. But when the stock’s price broke above the black line, it served as a signal to look for potential buying opportunities.
The fundamentals may have looked positive, but the technicals clearly showed that the buyers were propelling the stock’s price up.
And that is all we are interested in.
Clear and obvious evidence.
It’s clear to see how valuable technical analysis is when combined with trend-following.
Fundamental analysis might impact price over many years, but the aim for investors is to be consistently profitable in a shorter period of time.
If researching companies and holding onto investments for over ten years fits your investing style, then that’s great, but why not achieve results in a fraction of the time it would take otherwise?
We now have the technology and tools to create and read charts easily. They were not widely available until around the 1980s when computers began entering our homes.
Even then, they were expensive to own, so this technology was not accessible to everyone. We now have access to these tools at a fraction of the cost of what they were decades ago.
In order to make quick, effective decisions and have an edge in the market, technical analysis is the way to go.
If It’s Not Broken, Dont Fix It
It didn’t take me long to see the benefits of trend-following combined with technical analysis. Previously, I used a swing trading method where trades were held for a few days to a few weeks.
Both trend-following and swing trading utilise technical analysis to determine whether a stock is worth investing in.
The deciding factor for me between these two methods is the fact that trend-following has consistently generated more profit for me over the years. This is because the investments were held longer, allowing them more time to grow and flourish.
Trying to capture a profitable trend in a few days or weeks is as feasible as taking a year to acquire a law degree, a process that usually takes seven years. The trend needs time to run its course, and you can’t rush the process.
Riding The Trend Wave
The choice is obvious when presented with the option of selecting either of these two methods, which require the same amount of work, with one producing higher returns than the other.
Broadridge Financial Solutions is a great example of a stock that allowed me to ride the trend. The trend ran from 2013 to 2018.
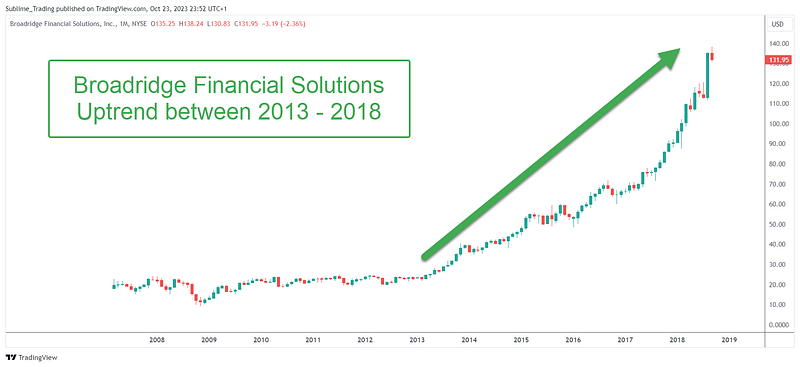
Once that trend was over, I moved my investments over to Nvidia.
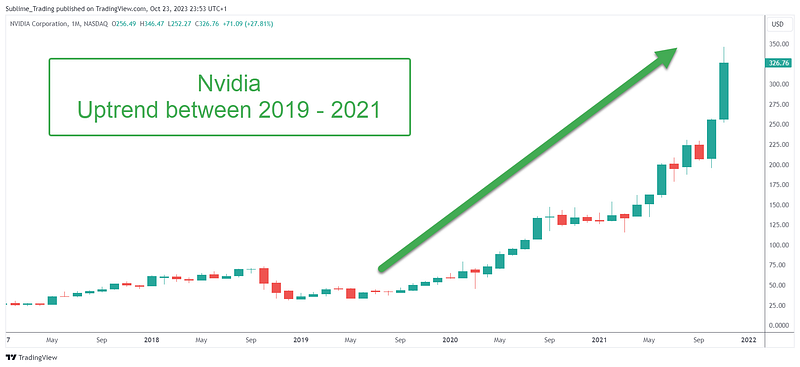
Investments were then moved over to McKesson, which began trending from 2021 to the time of publishing this article.
This process is repeated again and again.
The most effective methods are usually the simplest. Our minds are too adjusted to think that producing good returns requires much work.
The truth is that consistent investors have a simple blueprint for success that is repeatable and teachable.
How To Apply The Three-Second Method To Find Hot Stocks
Skilled trend-followers who fully understand the system can look at any stock and determine within three seconds if the stock is a high-probability opportunity.
This Is How It’s Done
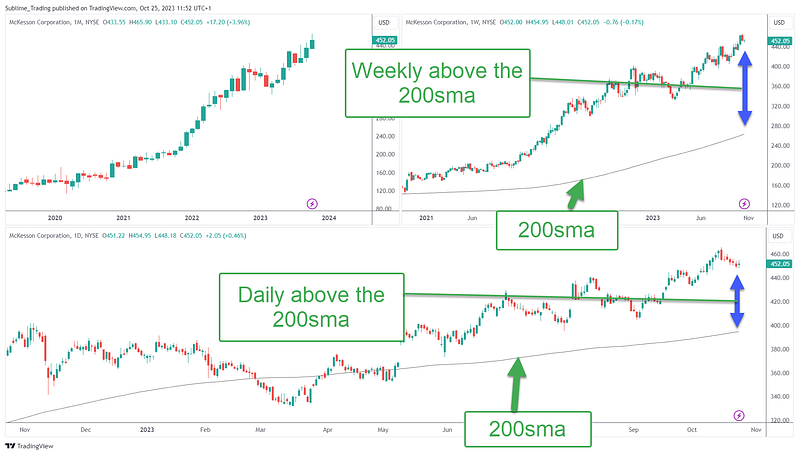
You first need a three-screen setup, which includes the monthly, weekly and daily timeframes.
The monthly timeframe displays candles representing each month. It presents the larger picture to help us see if a stock is trending up, trending down, or simply moving sideways.
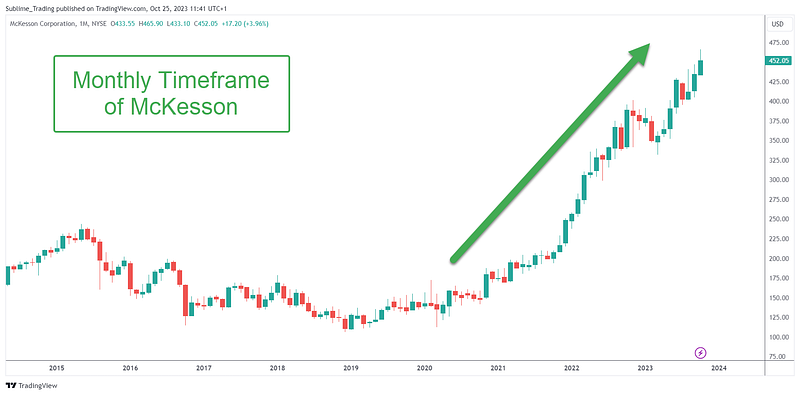
This stock is clearly moving up on the monthly timeframe above.
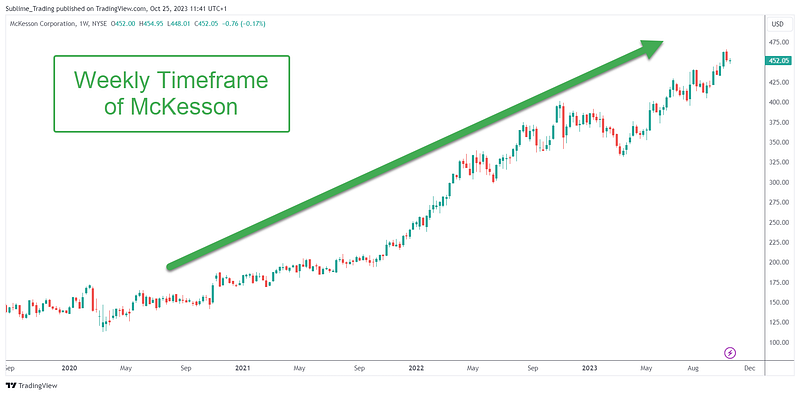
The stock is clearly moving up on the weekly timeframe as well.
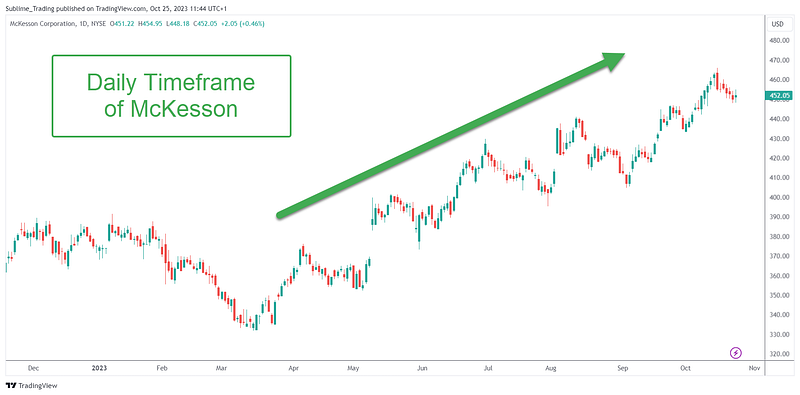
The daily timeframe, which gives us a closer view, is also moving up.
Based on the three timeframes, it is evident within three seconds that this stock is moving up and has the potential to continue rising.
To keep things simple, the weekly and daily timeframes include the 200 simple moving averages (200sma).
When the stock price is above the 200sma on both timeframes, the trend is up. When it is below the 200sma on both timeframes, the trend is moving down.
There were no fancy tools used and no fundamental analysis. Remember that profit is not made by knowing every minor detail about a company. Profit is made when the price of a stock moves in your direction.
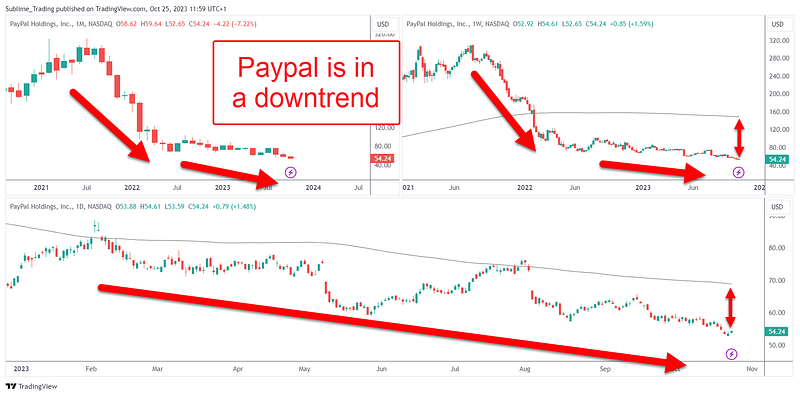
Paypal is clearly in a downtrend, as all three timeframes show that the stock is moving down.
The weekly and daily timeframes are also below the 200sma, which confirms the downtrend.
Investors must understand that simplicity is king.
I hear so many new investors say there has to be more to it due to their scepticism. They can’t believe that investing is simpler than they had imagined.
There really isn’t more to it. Yes, a few more indicators are used, but the core is looking at the three-screen setup and swiftly identifying whether a trend is visible within three seconds.
This is how poor-performing stocks are filtered out, leaving just the strongest-performing ones to select from.
If it takes over three seconds, you will likely force yourself to spot an opportunity. A trend will be as clear as day.
I use this method every day. It helps me generate consistent profit because only the best stocks make it through my filtration process.
The Decision Is All Yours
Whichever method you choose to use, ensure it is simple, objective, and produces consistent results.
The decisions should not take long to make. If they do take long, then consider why it does.
Even if you go down the route of using fundamental analysis, which does work for many, it is crucial to have a repeatable system that you can replicate with any stock.
You can only measure the performance of your method if you have a system with clear steps and guidelines.
Incorporate the three-second approach into your process and see how a stock performs over the coming months. Prepare to be pleasantly surprised by the results.
Get my Stock Market Blueprint & Stocks Newsletter here to simplify your process.
Subscribe to DDIntel here.
Submit your work to DDIntel here.
Join our creator ecosystem here.
DDIntel captures the more notable pieces from our main site and our popular DDI Medium publication. Check us out for more insightful work from our community.
DDI Official Telegram Channel: https://t.me/+tafUp6ecEys4YjQ1


