
How to Get Real-time Flood Data from the USGS API
Check in on your favorite waterway all day with Python and R.
The US Geological Survey (USGS) is an agency of thousands of scientists that track the landscape, natural resources, and natural hazards of the United States. From earthquakes to landslides to wildland fires, the USGS has all sorts of computers, sensors, and surveying tools that track the changing American landscape every day.
One group of sensors spread across America are USGS’s streamgages, which track the amount of water flowing in America’s waterways at any time of any day.
How the USGS Measures Waterways
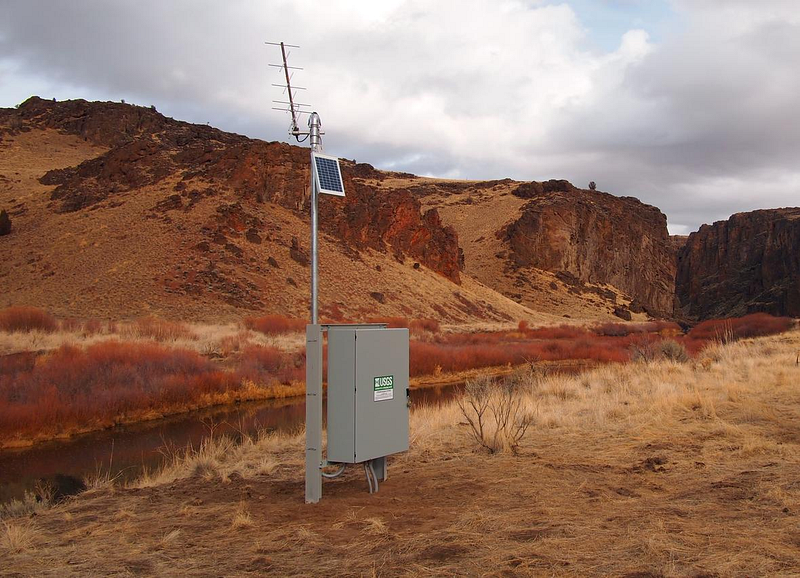
USGS has about 10,000 stations around the country that measure the height and flow of America’s rivers and waterways with a suite of sensors.
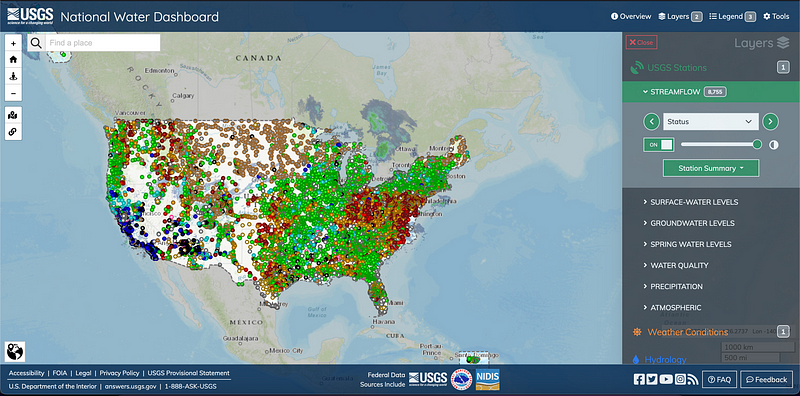
The National Water Dashboard shows the real-time output of all of these sensors. Below, we can see that on the day that this article is being written (March 22, 2023), the eastern US has a lot of red and green, meaning they’re experiencing a low amount of waterflow. In contrast, some spots in Arizona and California in the Southwest are blue and black today, indicating a high amount of flow.
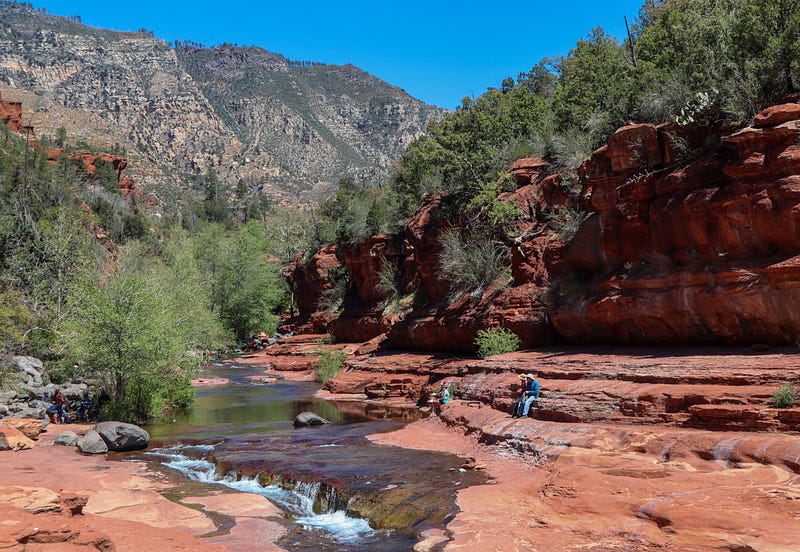
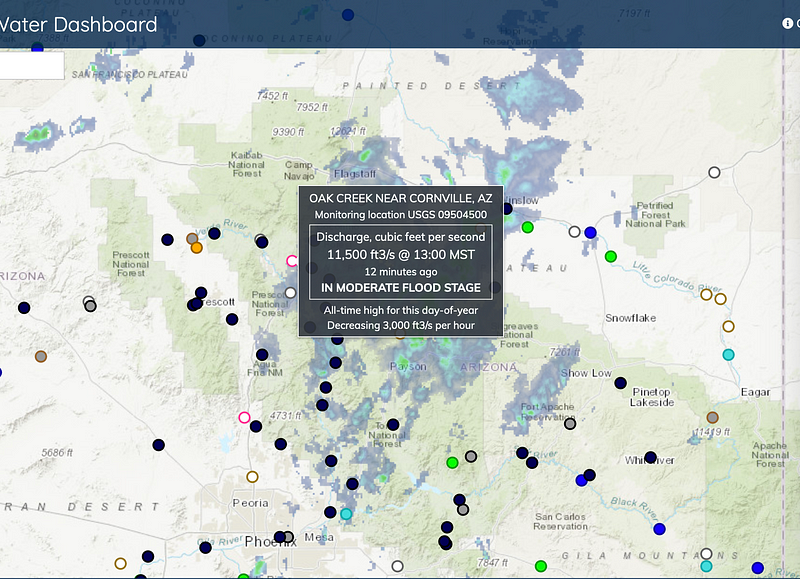
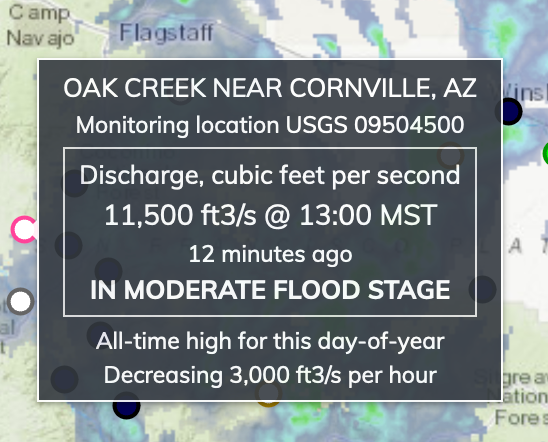
In fact, Arizona is getting a ton of rain today, causing record-breaking flooding in the greater Sedona area. Several towns downstream of Sedona, such as Cornville (shown below), are experiencing flooding in real-time.
Getting Water Data with Code
To get this data, we will use the USGS Water Services REST API. USGS has a smattering of datasets and services available to learn about water in different ways, but we’ll focus on the Instantaneous Values Service, which gives us fresh data from the streamgage sensors on a roughly 15–60 minute interval.
Steps for getting the data (covered in detail below):
- Manually get the ID number of the monitoring location (the streamgage) we want to track from the National Water Dashboard
- Build the URL with the Instantaneous Services URL building tool
- Use Python or R code to get the data using the URL we just built
- Extract the specific data we want (how much water, how fast it’s flowing, etc.) from the huge chunk of data that the API just gave us
Steps 1 and 2 are manual. Steps 3 and 4 are done with code.
Further reading: What the Heck is an API?
Step 1: Get the Monitoring Station’s ID Number
Each station has an ID number, which we can get from the National Water Dashboard. If you hover over any of the colored dots on the dashboard, a grey box will pop up with real-time data about that waterway.
We’ll use the Oak Creek station that is seeing flooding. The upper right corner shows that its ID number is 09504500. We’ll plug this number into the URL building tool in the next step.
Step 2: Build the API URL with the Water Services’ URL Tool
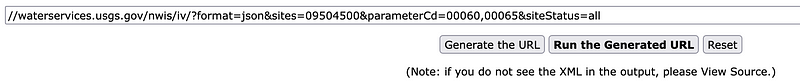
All we have to do is take the ID number from the last step (09504500) and plug it into the Instantaneous Value URL generator. There are a bunch of options to narrow down the data, but ignore those for now.
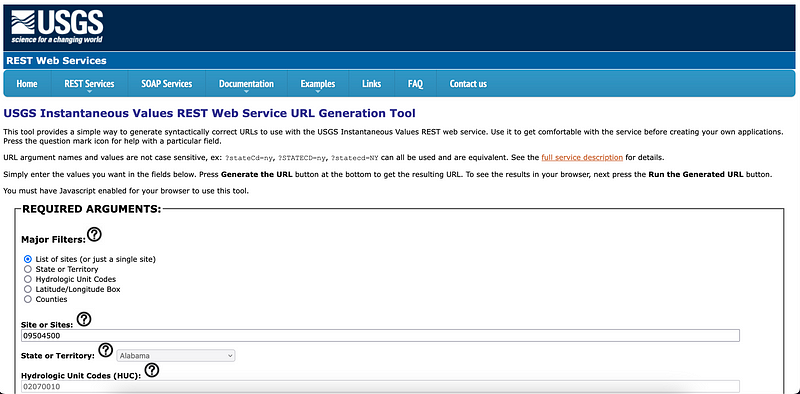
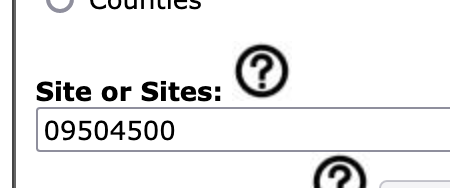
Go to the second field down, Site or Sites, and enter the station ID number, 09504500.
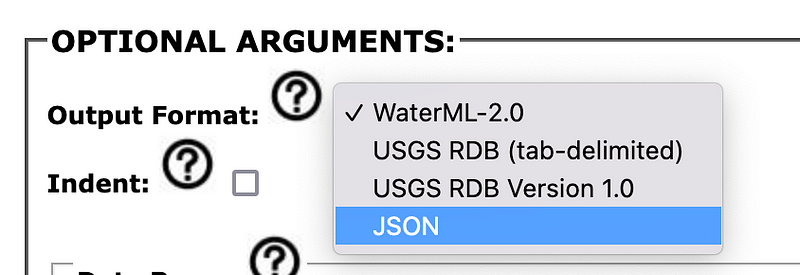
We recommend you also scroll down to Optional Arguments, and choose to get JSON data instead of WaterML-2.0 (basically XML) data. Either is fine, but JSON is more human-friendly.
Scroll all the way to the bottom of the page to Generated URL.
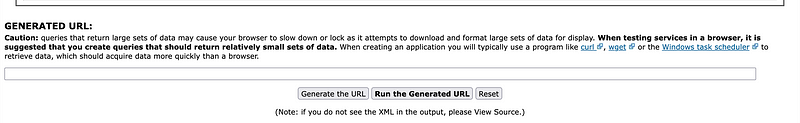
Click Generate the URL. Then the URL will pop up in the white box. We’ll put this URL in our code.
If you want to see the JSON in your browser also, you can click Run the Generated URL.
Step 3: Get the Data with Code
We’ll get the data with either Python or R. In both languages, we’ll use an HTTP library and the URL we made above to ask the API for the data.
Python Code
To get the data with Python, write:
import requests
usgs_water_api = "https://waterservices.usgs.gov/nwis/iv/?format=json&sites=09504500¶meterCd=00060,00065&siteStatus=all"
api_response = requests.get(usgs_water_api)
water_data = api_response.json()
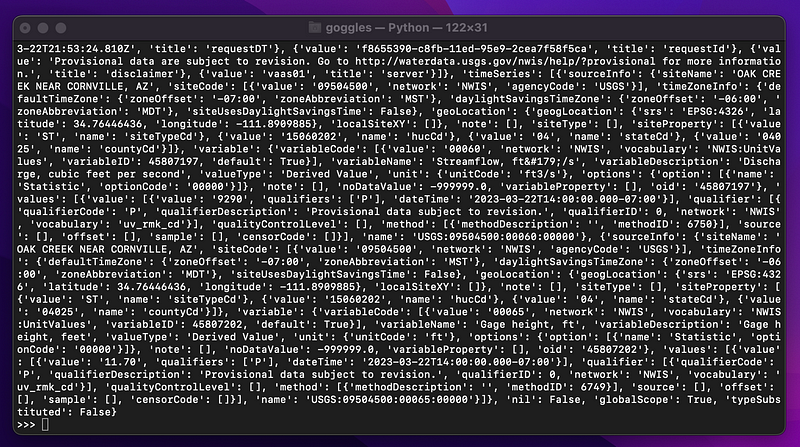
print(water_data)We store the URL we made above in usgs_water_api . Then, we use the requests library to get data from the API. After that, we get the JSON (the actual data) from the API’s response, and we print it to the screen.
We use the requests library above, which handles HTTP requests in Python. This can be installed with pip install requests or you can go here if you need more assistance installing `requests`.
The output is non-formatted JSON:
R Code
To get the data with R in R Studio, write:
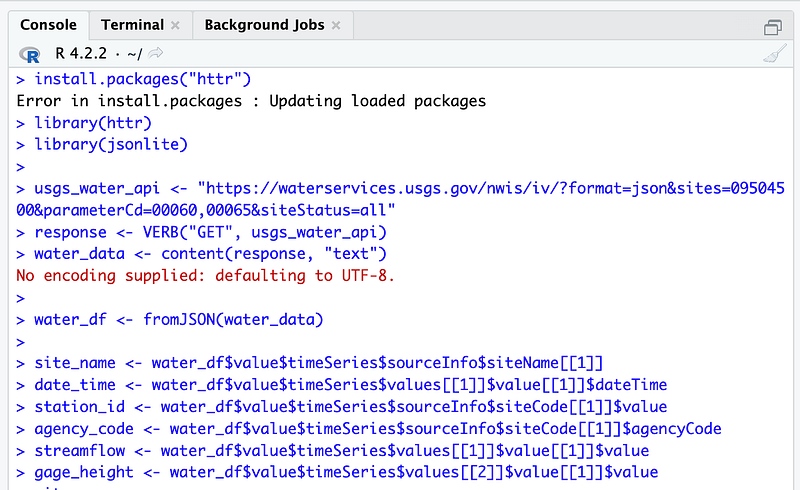
install.packages("httr")
library(httr)
usgs_water_api <- "https://waterservices.usgs.gov/nwis/iv/?format=json&sites=09504500¶meterCd=00060,00065&siteStatus=all"
response <- VERB("GET", usgs_water_api)
water_data <- content(response, "text")
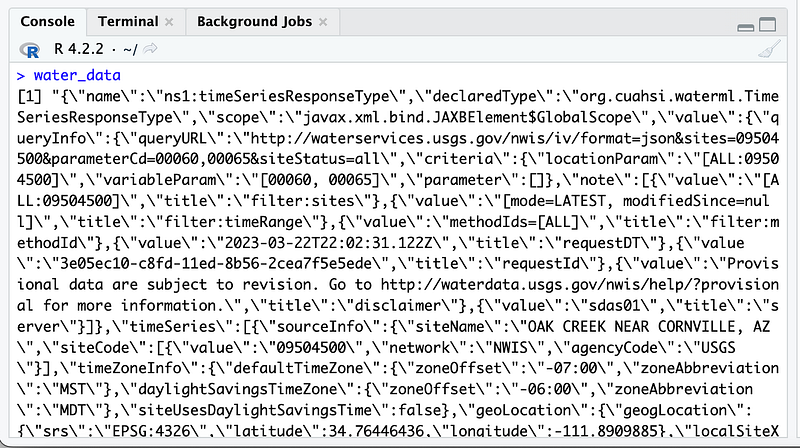
water_dataAbove, we:
- install and import the R HTTP library
httr GETthe data from the USGS Water Services API and store it inresponse- extract the JSON (which has our data) from the HTTP
response - print the water data JSON
The output in R Studio is a bunch of JSON:
Step 4: Extract the Interesting Data
We are going to:
- Pick the data apart with a JSON library to get the numbers that we’re interested in
- Print the interesting data
We’ll extract the following from the JSON:
- Site name
- Date and time
- Station ID
- Agency Code
- Streamflow (ft³/s)
- Gage height (ft)
USGS’s JSON data has some weird quirks to it that will require some long [“strings”] and random zeroes [0], but go figure. This API was written by geologists, who would rather be outside than at a computer fiddling with the creating the perfect JSON format.
You can look at the data directly to determine exactly how to navigate the JSON structure in code to get the data you want.
Python Code
This code will be added to the code from the last step. JSON is a bunch of nested values, so we’ll use notation ["like"]["this"] to extract the data.
import json

...

site_name = water_data["value"]["timeSeries"][0]["sourceInfo"]["siteName"]
date_time = water_data["value"]["timeSeries"][1]["values"][0]["value"][0]["dateTime"]
station_id = water_data["value"]["timeSeries"][0]["sourceInfo"]["siteCode"][0]["value"]
agency_code = water_data["value"]["timeSeries"][0]["sourceInfo"]["siteCode"][0]["agencyCode"]
streamflow = water_data["value"]["timeSeries"][0]["values"][0]["value"][0]["value"]
gage_height = water_data["value"]["timeSeries"][1]["values"][0]["value"][0]["value"]
Note how we had to go into a bunch of nested JSON just to get streamflow by writing water_data[“value”][“timeSeries”][0][“values”][0][“value”][0][“value”]. That’s unusual for an API, but sometimes we have to do hacky things when working with scientific data.
R Code
This code will be added to the code from the last step.
Like the Python example above, we have to go through some crazily nested JSON just to get basic values like streamflow and gage height (e.g. water_df$value$timeSeries$values[[1]]$value[[1]]$value)
library(jsonlite)

...
water_df <- fromJSON(water_data)

site_name <- water_df$value$timeSeries$sourceInfo$siteName[[1]]
date_time <- water_df$value$timeSeries$values[[1]]$value[[1]]$dateTime
station_id <- water_df$value$timeSeries$sourceInfo$siteCode[[1]]$value
agency_code <- water_df$value$timeSeries$sourceInfo$siteCode[[1]]$agencyCode
streamflow <- water_df$value$timeSeries$values[[1]]$value[[1]]$value
gage_height <- water_df$value$timeSeries$values[[2]]$value[[1]]$value
It’s a bit convoluted, but each $ and [[1]] digs deeper into the JSON to extract the data we care about.
Read more about jsonlite for R here.
The Full Script
Python Code
This is the full script, which reaches out to the USGS Water Services API then extracts and prints the most interesting data.
import json
import requests
# Get the USGS water data as JSON
usgs_water_api = "https://waterservices.usgs.gov/nwis/iv/?format=json&sites=09504500¶meterCd=00060,00065&siteStatus=all"
api_response = requests.get(usgs_water_api)
water_data = api_response.json()
# Extract interesting data from the JSON
site_name = water_data["value"]["timeSeries"][0]["sourceInfo"]["siteName"]
date_time = water_data["value"]["timeSeries"][1]["values"][0]["value"][0]["dateTime"]
station_id = water_data["value"]["timeSeries"][0]["sourceInfo"]["siteCode"][0]["value"]
agency_code = water_data["value"]["timeSeries"][0]["sourceInfo"]["siteCode"][0]["agencyCode"]
streamflow = water_data["value"]["timeSeries"][0]["values"][0]["value"][0]["value"]
gage_height = water_data["value"]["timeSeries"][1]["values"][0]["value"][0]["value"]
# Print the data
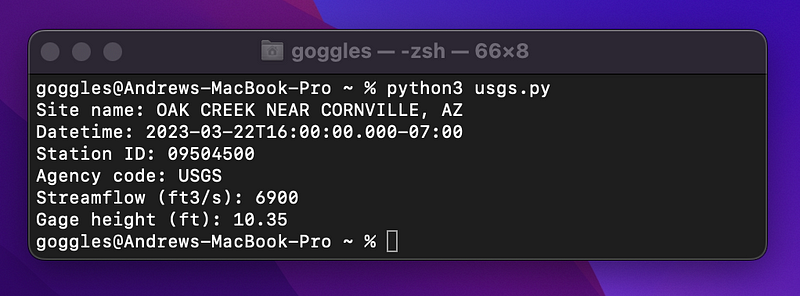
print(f"Site name: {site_name}")
print(f"Datetime: {date_time}")
print(f"Station ID: {station_id}")
print(f"Agency code: {agency_code}")
print(f"Streamflow (ft3/s): {streamflow}")
print(f"Gage height (ft): {gage_height}")Note the use of f-strings in the Python print statements.
The output of the full Python script:
R Code
This is the full R script, which can be run on it’s own as an .R file or run in R Studio.
install.packages("httr")
library(httr)
library(jsonlite)
usgs_water_api <- "https://waterservices.usgs.gov/nwis/iv/?format=json&sites=09504500¶meterCd=00060,00065&siteStatus=all"
response <- VERB("GET", usgs_water_api)
water_data <- content(response, "text")
water_df <- fromJSON(water_data)
site_name <- water_df$value$timeSeries$sourceInfo$siteName[[1]]
date_time <- water_df$value$timeSeries$values[[1]]$value[[1]]$dateTime
station_id <- water_df$value$timeSeries$sourceInfo$siteCode[[1]]$value
agency_code <- water_df$value$timeSeries$sourceInfo$siteCode[[1]]$agencyCode
streamflow <- water_df$value$timeSeries$values[[1]]$value[[1]]$value
gage_height <- water_df$value$timeSeries$values[[2]]$value[[1]]$value
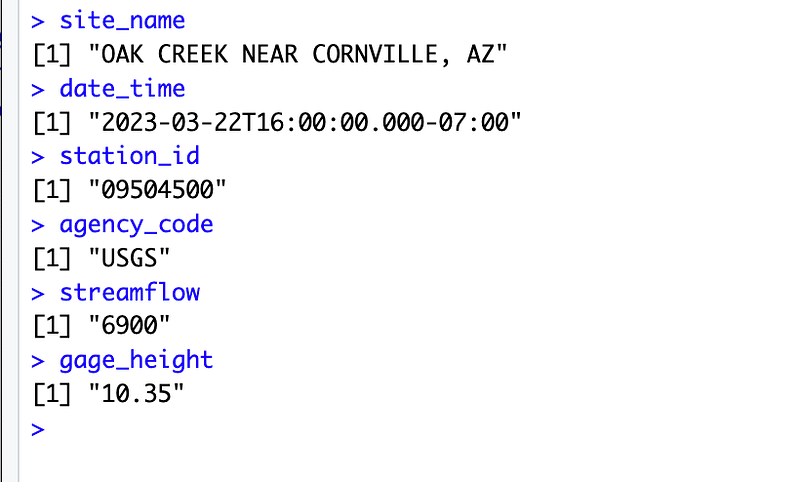
site_name
date_time
station_id
agency_code
streamflow
gage_height
The code in the R Studio console:
The output in the R Studio console:
Results
We can see that between when data was first collected for this article (1pm MST) and 3 hours later (4pm MST), the streamflow of Oak Creek has gone down from 11,500 ft³/s to 6,900 ft³/s. The gage height also dropped 1.4 feet (11.70 to 10.35).
USGS’s Water Services data is one of many sources of data on USGS.gov. Check out their website for more APIs, which include real-time and historical data on earthquakes, floods, wildfires, and more.
Questions and Feedback
If you have questions or feedback, email us at [email protected] or message us on Instagram (@protobioengineering).
If you liked this article, consider supporting us by donating a coffee.
More from USGS
- USGS API Homepage
- USGS Rest API web services
- USGS Instantaneous Water Service data URL generator
- National Water Dashboard
- Rivers vs. Streams vs. Creeks (USGS)


