
How to Detect Support & Resistance Levels and Breakout using Python
With full code and a demo notebook.
A breakout is a stock price moving outside a defined support or resistance level with increased volume. A breakout trader enters a long position after the stock price breaks above resistance or enters a short position after the stock breaks below support. — Investopedia
(Skip the introduction if you are already familiar with the concept of breakout and support & resistance)
Introduction
In trading, support and resistance levels are some of the most fundamental indicators and are very easy to understand. They are what they sound like.
A support level is a price range that acts as a support to the market so that when price hits the support level, it tends to bounce back up; a resistance level, on the other hand, acts like a ceiling where when the price hits, it tends to come back down.
With that said, when a breakout happens, for example when the price breaks through a resistance level, there’s a high chance the price will continue soaring upwards, and that resistance level will now become its support level.

The first question here is how do we programmatically find the support and resistance levels?
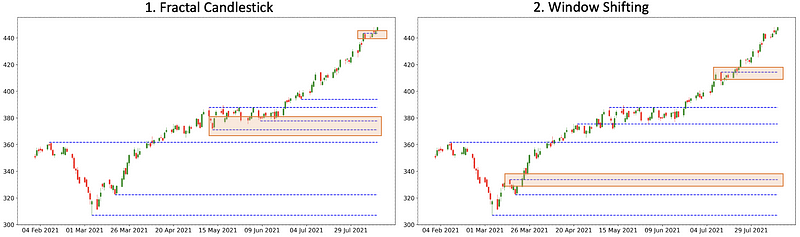
1. Fractal candlestick pattern
There are actually a few ways to do it. In his amazingly helpful article, Giancula is using fractal candlestick pattern to detect the pivot points which then become the support or resistance levels.
Take 5 candles, if the candle in the middle has the highest high and the 2nd and 4th candle have lower highs, we have a bearish fractal or a resistance level. Vice versa for a bullish fractal.

2. Window shifting method
Another way is to use a simple window shifting method to determine pivot points.
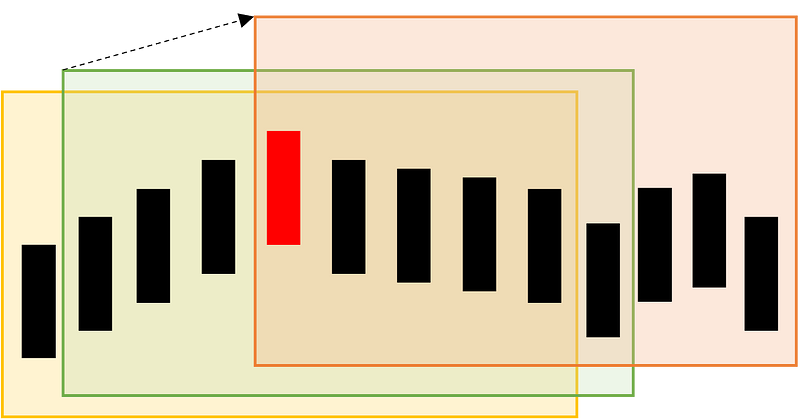
Let’s look at the illustration below. First, we take a window of 9 candles (illustrated by the yellow box) and find the maximum of the candles within the window. Then, shift the window up a candle (the green box) and find the maximum of the candles within the window. Do the same until you have shifted 5 times. If the candle with the highest value remains the same throughout the steps, we have a pivot point.
There is even a solution making use of K-means, a machine learning algorithm to detect support and resistance levels but we are not going to discuss it here.
In this tutorial, we are going to make use of the first two methods and create a simple program to help us find an instrument that just had a breakout from the support or resistance levels.
Implementation
Let’s start with the first method of detecting fractal candlestick pattern.
# import necessary libraries
!pip install yfinance
!pip install mplfinance
import pandas as pd
import yfinance as yf
import numpy as np
import math
from mplfinance.original_flavor import candlestick_ohlc
import matplotlib.dates as mpl_dates
import matplotlib.pyplot as plt
# get stock prices using yfinance library
def get_stock_price(symbol):
df = yf.download(symbol, start='2021-02-01', threads= False)
df['Date'] = pd.to_datetime(df.index)
df['Date'] = df['Date'].apply(mpl_dates.date2num)
df = df.loc[:,['Date', 'Open', 'High', 'Low', 'Close']]
return dfsymbol = 'COST'
df = get_stock_price(symbol)Once we have the stock prices in a pandas dataframe, we can loop through the prices and find candles that fit the fractal candlestick requirements. Some of the codes here are modified from the original codes.
#method 1: fractal candlestick pattern
# determine bullish fractal
def is_support(df,i):
cond1 = df['Low'][i] < df['Low'][i-1]
cond2 = df['Low'][i] < df['Low'][i+1]
cond3 = df['Low'][i+1] < df['Low'][i+2]
cond4 = df['Low'][i-1] < df['Low'][i-2]
return (cond1 and cond2 and cond3 and cond4) # determine bearish fractal
def is_resistance(df,i):
cond1 = df['High'][i] > df['High'][i-1]
cond2 = df['High'][i] > df['High'][i+1]
cond3 = df['High'][i+1] > df['High'][i+2]
cond4 = df['High'][i-1] > df['High'][i-2]
return (cond1 and cond2 and cond3 and cond4)# to make sure the new level area does not exist already
def is_far_from_level(value, levels, df):
ave = np.mean(df['High'] - df['Low'])
return np.sum([abs(value-level)<ave for _,level in levels])==0# a list to store resistance and support levels
levels = []
for i in range(2, df.shape[0] - 2):
if is_support(df, i):
low = df['Low'][i]
if is_far_from_level(low, levels, df):
levels.append((i, low))
elif is_resistance(df, i):
high = df['High'][i]
if is_far_from_level(high, levels, df):
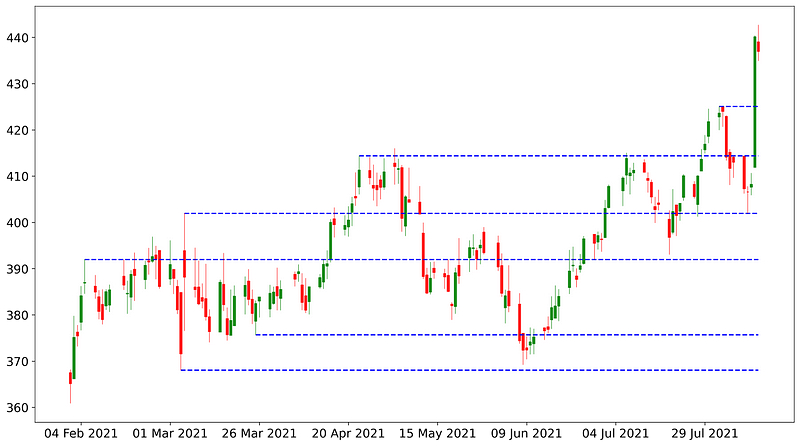
levels.append((i, high))Next, we can visualize the support and resistance levels using the following function.
# for visualization
def plot_all(levels, df):
fig, ax = plt.subplots(figsize=(16, 9))
candlestick_ohlc(ax,df.values,width=0.6, colorup='green',
colordown='red', alpha=0.8)
date_format = mpl_dates.DateFormatter('%d %b %Y')
ax.xaxis.set_major_formatter(date_format)
for level in levels:
plt.hlines(level[1], xmin = df['Date'][level[0]], xmax =
max(df['Date']), colors='blue', linestyle='--')
fig.show()Running the above codes will give you something like this.
Great! Now let’s move on to the second method and see what do we get.
#method 2: window shifting method
#using the same symbol as the first example above
symbol = 'COST'
df = get_stock_price(symbol)pivots = []
max_list = []
min_list = []
for i in range(5, len(df)-5):
# taking a window of 9 candles
high_range = df['High'][i-5:i+4]
current_max = high_range.max()
# if we find a new maximum value, empty the max_list
if current_max not in max_list:
max_list = []
max_list.append(current_max)
# if the maximum value remains the same after shifting 5 times
if len(max_list)==5 and is_far_from_level(current_max,pivots,df):
pivots.append((high_range.idxmax(), current_max))
low_range = df['Low'][i-5:i+5]
current_min = low_range.min()
if current_min not in min_list:
min_list = []
min_list.append(current_min)
if len(min_list)==5 and is_far_from_level(current_min,pivots,df):
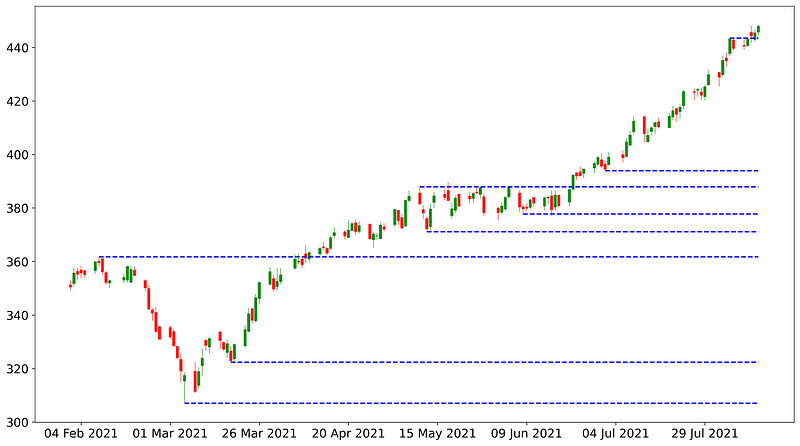
pivots.append((low_range.idxmin(), current_min))plot_all(pivots, df)As you might have noticed we are reusing some of the functions from the first method: is_far_from_level and plot_all. Running the above code will get us something like this.
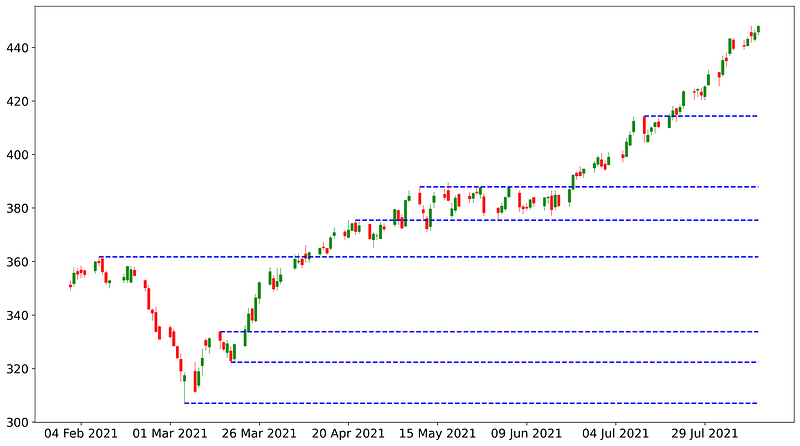
Comparing the results from both methods side by side tells us they produce fairly similar results and personally I think both are equally good and I have been using them in my screener program, which is coming next!
Screening
Right, here comes the good part. As mentioned in the introduction, our objective here is to screen for a stock that just had a breakout from the support or resistance levels.
Let’s look at the full code and I will explain it from there.
- Line 1–13: function of the first method.
- Line 15–36: function of the second method.
- Line 38–43: function to detect breakout, which returns true when the previous candle opens below a support or resistance level and the last candle opens and closes below that level.
- Line 45~: the main program to screen through the S&P 500 stocks for breakout
Running the above program on August 14th, 2021 gave me the following results.
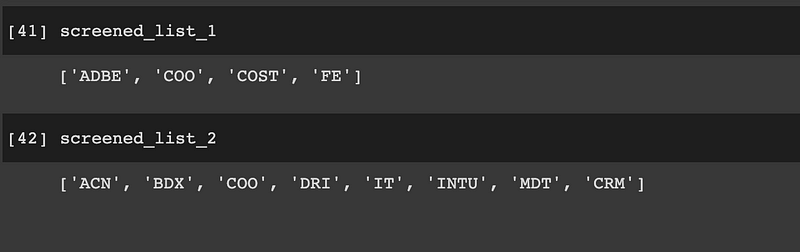
We can see that both lists contain quite different results but there’s also one common symbol: COO. Let’s plot the chart and there we go! A huge breakout occurred 2 days before.
Conclusion
We have successfully detected the key resistance and support levels using Python and more importantly, we are able to screen for stocks that just experienced a breakout.
Of course, that doesn’t mean we should just invest blindly in the stocks that we found using this program. Do more research and make sure your breakout strategy is valid and reliable. Here are some resources that might help:
- https://www.tradingwithrayner.com/breakout-trading-guide/
- https://www.investopedia.com/articles/trading/08/trading-breakouts.asp
If you like what you see, feel free to also check out my other stories here related to stock screening.
The full code and demo notebook of this tutorial is available here.
I create quality content and tutorials on technical analysis using Python. If you like what you see, and are not subscribed to Medium yet, feel free to do so via the link below and follow me along my journey (part of the fee will go directly to me). Thanks for your support.


