

How to create outstanding custom choropleth maps with Plotly and Dash 🌎
Make your first steps with GeoJSON files & learn how to build choropleth maps anywhere on the earth. Illustrated with covid open data.
Let’s begin with that weird word. Choropleth. If you never tried to plot those colored maps, it’s likely you never used that word. As a matter of fact, it comes from Greek. Choros means “area”, and Plethos means “multitude”. Then choropleth maps are those maps that represent data per geographic zones, each zone being colored on its own.
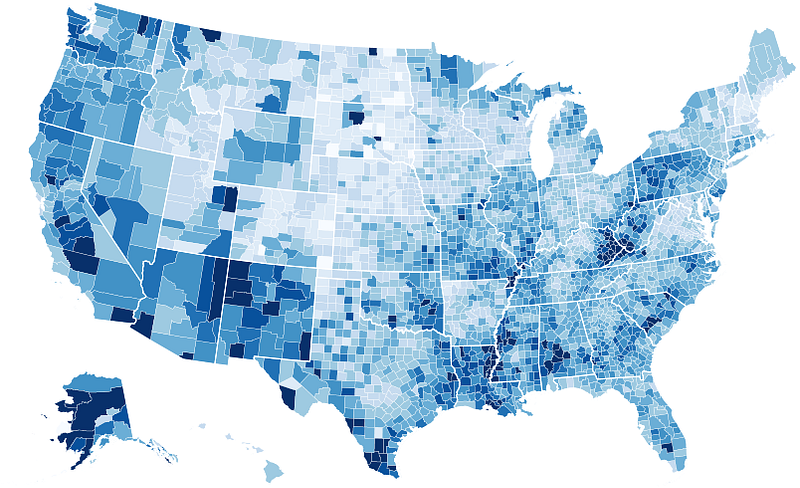
This previous example is a colored version of the United States. Today, most visualization tools come with a US state’s split, making it easy to color this land. But what if you want to plot data within a state? Or in another country? Or even in your own garden?
You’ll discover how to do so in this article using Plotly 😉
As a reminder, Plotly is a Data Visualisation Library that has interfaces with JavaScript, Python, and R. It is very complete and allows us to build nice graphics within minutes. The maintainers qualify it as “the front end for ML and data science models”.
Choropleth Theory
To build a choropleth map, there are 2 mandatory files:
- A dataset with the information you want to display
- A GeoJSON file with the delimitation of the areas to plot
Dataset
There is no mystery in what a dataset is. If you want to plot data on a map, you’ll first have to get this data. Soon we’ll format it for Plotly, but don’t worry there is no trick here.
GeoJSON
This deserves a little more attention. Geographic JSON (or GeoJSON) is an open format for encoding simple geospatial datasets using the JSON (JavaScript Object Notation) standard.
It is used to describe data such as points, lines, strings, polygons, as well as sets and subsets of these data types, and to add non-spatial information attributes.
They are defined by the GeoJSON specification (RFC 7946) and are dictionary-like objects which can only be composed of one of those nine: FeatureCollection, Feature, Point, LineString, MultiPoint, Polygon, MultiLineString, MultiPolygon, and GeometryCollection.
The widest object is the FeatureCollection which is basically a list of the main object: the Feature . A Feature is a dictionary with 3 keys:
- Type: each GeoJSON object starts by announcing its own type. Then for a Feature object, the value is “feature”. No more mystery.
- Geometry: it shall be either a Geometry object (see below) or, in the case that the Feature is unlocated, a JSON null value.
- Properties: it is a JSON object which may contain any information of the concerned geographic region. Soon, we’ll include our dataset values into this part, so that the GeosJSON contains all the information for the choropleth map.
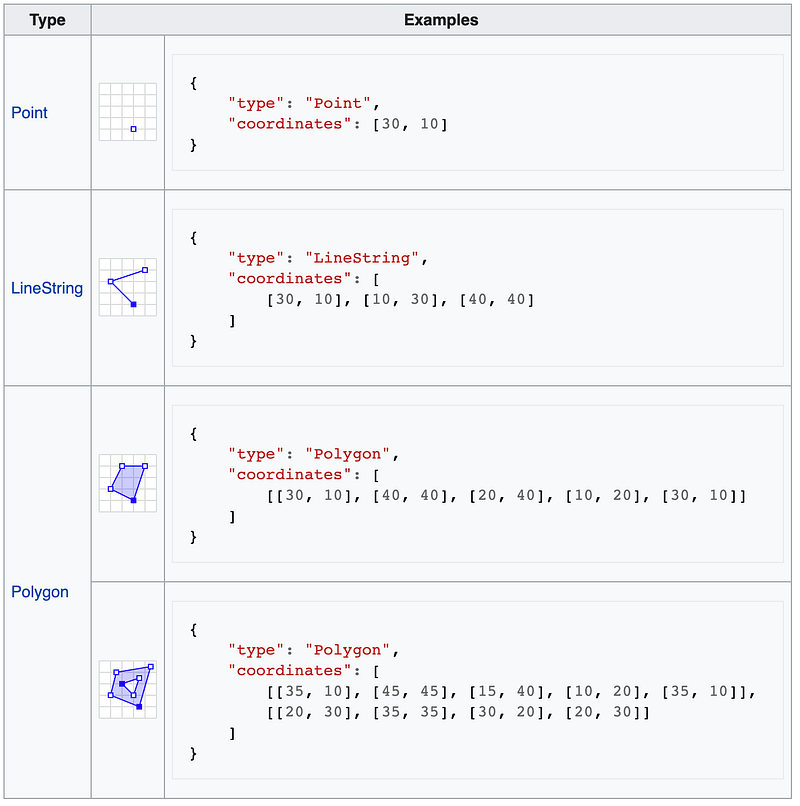
Below are some examples of the Geometry objects. I’ll not go through all of them, but you might guess that the interesting ones for us, today, are the Polygon ones 😉
Choropleth in Practice — Part 1 🦠 🌎 😷
In my previous tutorial about animated scatter maps, I used the COVID dataset from Hopkins University which is updated on a daily basis during the current crisis.
Today we’ll use the same dataset, but much more simplified. As choropleth maps are a sort of Photograph of a situation at a specific moment, we’ll only keep the data from a single day, for a single KPI. Let’s go with the number of confirmed Covid cases on November the 19th for every country of the world, and plot them with Plotly thanks to a GeoJSON file containing all the concerned geographic areas.
Step 1: Collecting Visualization Data
Data are available on opendatasoft. On each line, the key value can be confirmed , deaths, or recovered and the value corresponds to the number of persons concerned in the country form the country column at the date from the datecolumn. So let’s start by loading them with pandas and filter on the selected scope.
Note: As the dataset is becoming bigger every day, depending on your network, it might take a while to run on your computer.
The previous code performs this transformation on our data:
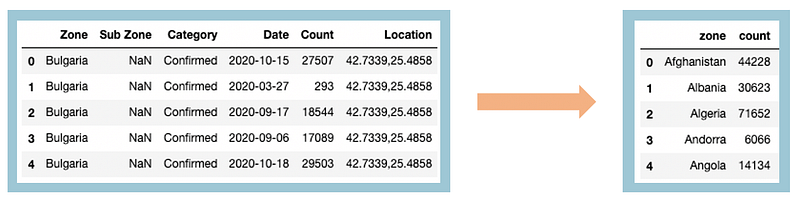
Now, we’re done with the data part. As mentioned previously, no mystery here. Let’s move to the geographical part 😃
Step 2: Getting the GeoJSON
With the rise of Open Data, lots of geographical data are accessible for free on the web. So whenever you need a geographical zone for your needs, I recommend you to look for “my zone GeoJSON” on google. Your country might also have an open data website with administrative information such as 🇺🇸data.gov, 🇨🇦 open.canada.ca, 🇦🇺 data.gov.au, or 🇫🇷 data.gouv.fr.
But as of today, we need a map with countries, and to do so we’ll use geojson-maps website. It is a very basic website where you can select parts of the words, a resolution level (low/medium/high), and build your custom GeoJSON.
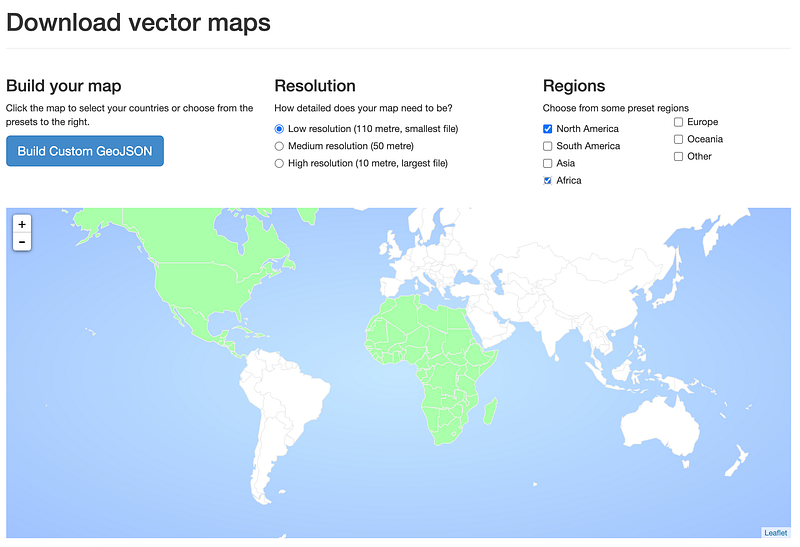
So I went on that website, selected the 7 world regions in low resolution, and downloaded the file. It comes with lots of properties for each country such as a name in different languages, estimated population, GDP, income group, census date, world region, subregion, sovereignty, Wikipedia link, etc.
But the most important for us, keeping our linking objective, is the ISO Alpha-2 or ISO Alpha-3 information. Both of these are international standards with 2 or 3 letters to describe any countries on the globe 🌏
Step 3: Linking our dataset and our GeoJSON
Now that we’ve Covid data and geographical surfaces, we’ll need to link them. In order to put it together with Plotly, the idea is basic.
First, we modify the GeoJSON to add a new key namedid in each Feature, in addition to properties , type, and geometry . And this id value must refer to a key in our data frame. In our example, the id will have to be the country name in the Zone column of our data.
When plotting, the choropleth maps, we’ll have to specify 4 necessary elements :
- The GeoJSON file with the
idkeys. - The DataFrame object which contains our data
- The column in the DataFrame which make the link between the GeoJSON data
- The column of the DataFrame that will give the intensity of the color. Basically, it is the indicator we want to see on the map.
Just before I mentioned the ISO codes, which are pretty useful most of the time. Unfortunately, these values are not available in our COVID dataset.
So that we’ll have to use the country names, which is a little more complicated such as the spelling of countries might vary for some countries depending on the sources. Example: United States, The United States, US, or USA might refer to the same country in different data sources, whereas the ISO A2 code would always be the same.
But let’s have a try and see what happens 😉
This one is a bit long, sorry about that! But it’s essentially due to comments. Tried to make it as easy as possible for your comprehension. Note: you’ll need to import the
jsonmodule to run that code.
Good news, the output of that code was the following: 148 countries found, 27 not found. Which basically means that the name information from the GeoJSON properties corresponds pretty well to the zone data from Hopkin’s dataset.
By printing the missing list, I got the following countries:
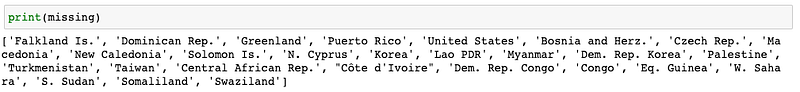
As suggested, we struggle with composed name countries. The easy-solution is to print the df['zone'].tolist() to see how the countries are spelled in the original dataset, then to create a conversion dictionary and use it while creating the GeoJSON file.
Well after further inspection we got 3 different situations:
- Countries spelled differently
- Countries that are in the JSON but not in the dataset (ex: Turkmenistan)
- Regions that are in the JSON but considered as a Sub Zone in the dataset, which we lost information by keeping only regions for a seak of simplicity (ex: Greenland which is in fact part of Denmark).
I’ll focus on the first category. Which leads to the following dictionary:
Then we use it to create the correct GeoJSON file for our map. I’ll note put the full code in here because it is very similar to the previous one. But you can find it on this GitHub gist.
Plotting the map
Now the easier part: putting it all together.
Plotly is a visualization library that has built-in map functionalities. Among them the choropleth You’ll need to install Plotly library before going further.
pip install plotlyNow we’ll use the plotly.express.choropleth function and let the magic happen. As mentioned in the previous part, we’ll specify 4 elements: the DataFrame with COVID data, the GeoJSON file, the column to make the link between both of them, and the color intensity of each area.
In our case, the COVID dataset takes values in a very wide range. Thus instead of using a linear scale, we’ll go for a logarithm one.
This is a bit of a trick to perform data transformation and make the colors more relevant on the graphic. In some cases, you might not have not to deal with it, or perform linear or other transformations.
And… Result!
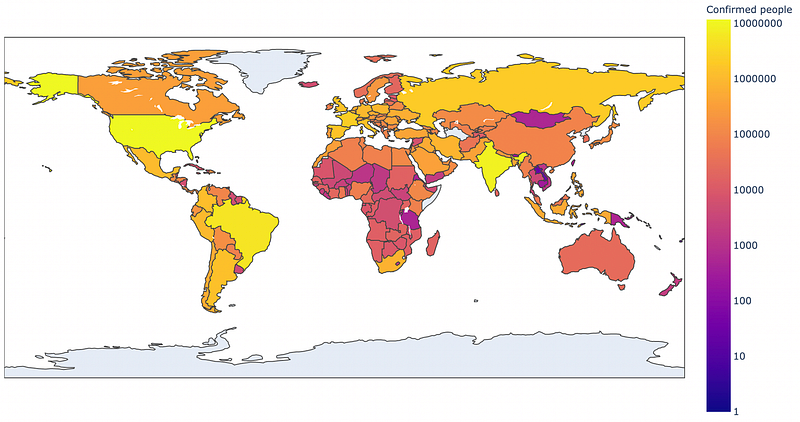
Nice! Isnt’it?
What? You think this could be better ?
Yeah! I do agree with you. And I guess that Plotly also does. And that’s probably why they made a partnership with Mapbox, to create much more attractive maps. Mapbox is another company that provides.
Most of the time you have to authenticate with a Token to use Mapbox. But today’s your lucky day. No token required to plot basic choropleth maps.
And the good news is that it’s almost immediate! So let’s switch from the plotly.express.choropleth to the plotly.express.choropleth_mapbox one, and make some little change.
Let’s start with Mapbox mandatories
- Add a
mapbox_style: this corresponds to the map background. There are a bunch of them which are token-free. And if you authenticate to the Mapbox API you‘d get some additional ones. Here we’ll go with theopen-street-mapone. - Define a
zoom: it corresponds to the level of zoom on the planet. It will change the tiles used for display. As we want to see the full planet, we’ll go for1. Ex a rule of thumb, using values such as3would zoom on the United States, and value as5would zoom on the United Kingdom. This is very experimental, you should try to select the one that best fits your use case. - Set the
centerof the map. As you can see it comes as a dictionary withlatfor the latitude andlonfor the longitude of the central point. I went for19-11as it is my birth date and it fitted well the example 😇
So now let’s see the other custom change that we made
- Changing the hover configuration with
hover_namewhich becomes the title of the hover box, andhover_datadictionary. The latter specify which information to display or not on the map from the same line in the DataFramedf. If you want more information about that, in a previous post I showed an example of how to use a custom HTML hover template with Plotly. - Changing the color scale. This yellow to purple default color scale (named
infernoby the way) does not really fit what we wanna show here. For both aesthetic and user experience I’d prefer some variation of the same color. And a color that would indicate that we’re here on a dramatic visualization implying sick people. After inspection of Plotly built-in color scales, I think that theYlOrRdcolor scale fits better our use case. - Finally, I added some opacity so that we could still see the names of countries that appear on the map when zooming on them.
0means transparent.1means fully opaque. I went for0.8.
Now let’s plot!
And… Result!
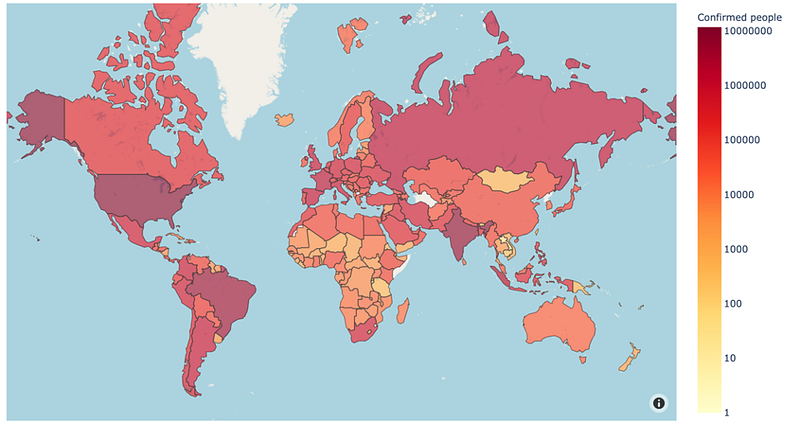
Much better, right?
Choropleth in Practice — Part 2 🦠 🇫🇷 🛏
This post is becoming a little long, so I won’t get into details about the code adaptation to another use case here, but for the one who’d be interested, I prepared a second post with adaptation details, through another COVID dataset, reporting the bed occupancy of each France’s region.
Coming soon: Choropleth Maps in practice with Plotly and Python 🌎 🐍
You’ll discover how to reuse today’s code and build a completely new choropleth map in a different geographical zone, on a different dataset, with as less as 30 lines of code 😎
Going deeper: adaptation to your own needs
So now you might understand better how to fit your data to a GeoJSON file and plot them with Plotly. If you have specific needs and want to display some local data to a map, there is a very useful website entitled geojson.io where you can plot your own contours on a map and download the associated GeoJSON file.
Remember the example of Feature at the beginning of this post? It was the delimitation of the Eiffel Tower. Here is how I got it.
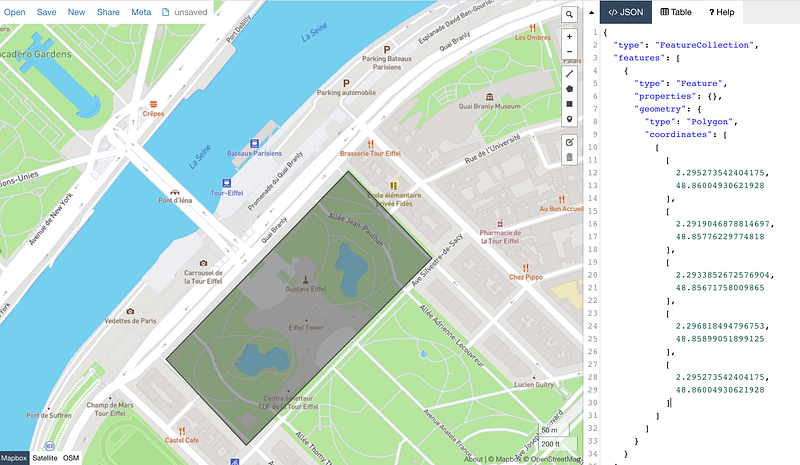
You might use it to detour the houses of your neighbor, specific monuments, parcels of your fields, or whatever you want to!
Conclusion
What a long journey to those choropleth maps! Hope you liked it! The key learning from today is the importance of GeoJSON files and how to link them with your data. When this is understood, any phenomenon can be plotted on a choropleth map using Plotly and Mapbox for free 😊
If you want to get more information on side subjects from this map I have some stories which might raise your interest:
- To animate your choropleth map with Plotly, and eventually display your KPI over time
- To embed this Plotly map in a Dash application and deploy it for free on the Internet thanks to Heroku
See you soon 🤠


