
How to create a real-time web application using FastAPI, Angular and MongoDB
Part 3: Frontend— Angular

Hi there! My name is Job and in this series, I’m going to guide you through my journey of creating a real-time web application. In this multipart guide, I tackle all aspects and learnings of creating a real-time web application. In this third part, I set up the frontend using the Angular frame and connect it to our API created in Part 1. Check out Part 2 for how to set up the MongoDB database using Docker.
Getting setup⚙️
To start off we need to install Node.js, a JavaScript runtime for running our server. Go to their download page and download & install the latest LTS. For me, this is version 16.15.1. Next, we need to have NPM (Node Package Manager) installed on our machine. Luckily Node.js already installs this for us so we can start using it right away!
For creating a new Angular application we need the Angular CLI. Open a new terminal at the root folder of our project and run the command npm install -g @angular/cli to install it. Now run ng new frontend to create the Angular application. It will ask if we want to share anonymous usage data about this project with the Angular Team at Google. I answer ‘No’ because I don’t want to share this with them but feel free to do so if you’d like. Answer ‘Yes’ to the question ‘Would you like to add Angular routing?’ and select the stylesheet format you would like to use. I’m going with sass. The Angular CLI will now create the project for you. After it’s done initializing open the newly created folder (‘frontend’ in my case) with your preferred IDE or code editor. For frontends this is VSCode for me.
Getting started🚀
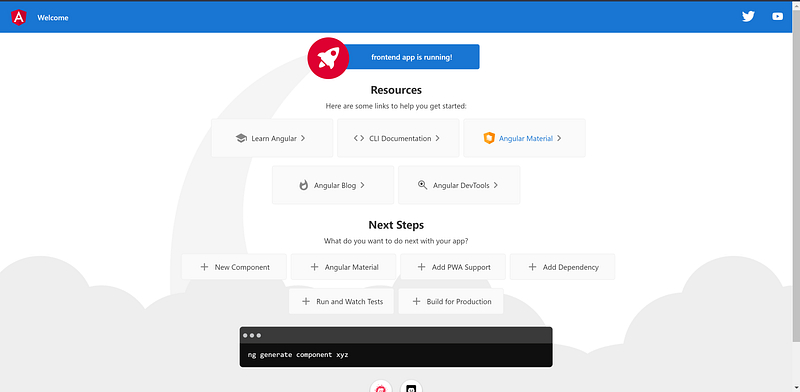
With the project opened in VSCode start by opening a new terminal and run ng serve --open. This will build the project and open your default browser at http://localhost:4200, this is where your frontend will be hosted.
A handy feature built into Angular is hot reloading. This means the server gets updated after editing the source code right away. This way you don’t have to restart your server after each little code change to see the effect or test some new functionality!
The goal for this project is to be able to view the sensor data plotted in a line graph. The data is retrieved via a WebSocket endpoint hosted by our API, which will get the data from the MongoDB database. To achieve this we need to install some packages we’re going to need. Install these by running the following command:
npm install --save bootstrap bootstrap-icons chart.js chartjs-plugin-zoom socket.io-clientLet’s start creating our frontend by updating the index.html to add a font and Material Icons from Google and styles.scss with some initial styles to get started.
Replace all contents of the default app.component.html with this line:
<router-outlet></router-outlet>The router outlet will take care of showing us the right page depending on the active URL. For instance, if we were to create a dashboard page to show us the graph we want to create for our weather data and want it to be available at http://localhost:4200/dashboard, the router outlet will change the contents of the page accordingly.
Let’s actually create the above-mentioned dashboard page by generating a new component using ng g c pages/dashboard (short for ng generate component {component_name}. This will create a new component for us in the pages/ folder and automatically register it to the app.module.ts declarations. This will make it available to use throughout our source code.
We can now add the route /dashboard to the Routes constant in app-routing.module.ts and direct it to the dashboard component. This tells the router to load the Dashboard component whenever we visit http://localhost:4200/dashboard.
Next, we’re going to create a chart component. Do this by running ng g c components/charts/line-chart. This will create a line-chart component in the components/charts/ folder. To create the chart and initialize it with some random data we need to add the following to line-chart.component.html and line-chart.component.html.
This will initialize a line chart with 6 random, hardcoded data points (which we’re going to replace later with the sensor data from the database) and make it interactable using the chartjs-plugin-zoom plugin. This is registered at the top of the file to the Chart object which is used to create the actual chart. This plugin makes it possible for us to interact with the chart. We can scroll up to horizontally zoom in and scroll down to zoom out again. By clicking and holding the chart we can drag it up and down.
The last thing left for us to do is load it into our dashboard.component.html so it’s rendered. To do this fill the contents of this file with this line of code:
<app-line-chart></app-line-chart>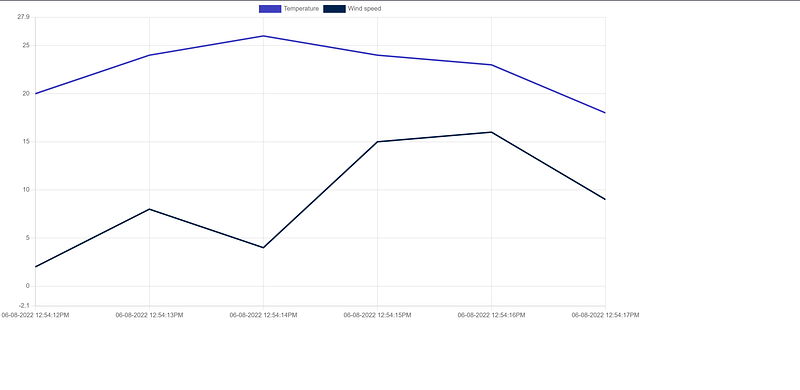
You’ve now successfully created your weather chart using Angular!
Now the fun part😁
Let’s connect our frontend to the API we created and get the sensor data from the database. We start by creating a WebSocket service that is going to handle the communication with the API. Do this by running ng g s services/socket in the terminal and define the service as follows:
This service connects to the WebSocket endpoint from our API, defined in the environments.ts file and environment.prod.tsfile used when running in production, and create an observable which will open the WebSocket connection for us. This then waits for data from the server and adds it to the messages list. Whenever we want to send a message to the server it will check if the connection is open and if so, sends the stringified data to the server and listen for the response, and so on, and so on…
We set the host for the WebSocket endpoint from the API to be host.docker.internal because we’re going to use production mode when we deploy our application using Docker.
Let’s now register the WebSocket service to our line chart component and initialize a subscription. This is then subscribed to the ‘messages’ list from the socket service and updates the ‘data’ attributes from the line chart with the data stored in the ‘messages’ list. This is then going to send a request for getting the data with sensor_id 123 every second under the condition that the value of the keep_going variable is set to true. If this value is set to false it will stop requesting the data until it’s toggled again by the start/stop button defined in the HTML.
Congratulations🎉
Congratulations! You’ve created a live graph displaying the sensor data using WebSockets. We started out by installing NodeJS and the Angular CLI to create a new Angular application. We installed the necessary modules and used them to create a line chart connected to a WebSocket endpoint using a service handling the communication. The API gets the data from the database, adds some new, random data, and gives it back to us after which the chart data gets updated with the new data. We can scroll up and down to horizontally zoom in and out and we can drag the chart up and down.
In Part 4, I show you how to run all three main components (API, database, and frontend) in a Docker container and run them all using only one command!
Checkout the source code on my GitHub


