
How to Create a Dashboard to Dominate the Stock Market Using Python and Dash
Free Options Order Flow, Prices, Fundamentals, Chatter all in one

Keep Your Eyes on the Big Picture
I’ve been fascinated with the stock market since I was a little kid. There is certainly no shortage of data to analyze, and if you find an edge you can make some easy money. To stay on top of the market, I designed a dashboard that incorporates interesting option market order flow, price charts, chatter and fundamentals. Having it all in one place makes it easy to monitor market sentiment and find potential plays! In this article, I’ll describe the components of the dashboard and explain how I created it using Python and Plotly’s Dash.
Contents:
Reviewing the Dashboard Sourcing the Data Reviewing Dash Framework Designing the File Structure Creating the Function Files Adding Callbacks Final Thoughts and Complete Code
The full code and GitHub link are toward the bottom of the page if you’re already familiar with Dash.
If you’re completely new to Dash, I recommend starting here:
Reviewing the Dashboard
The dashboard is designed using Dash Bootstrap CSS and is fairly responsive by default! On startup, the dashboard will load data from Twitter and Reddit. These data feeds are used to monitor interesting option flow and market chatter/sentiment.
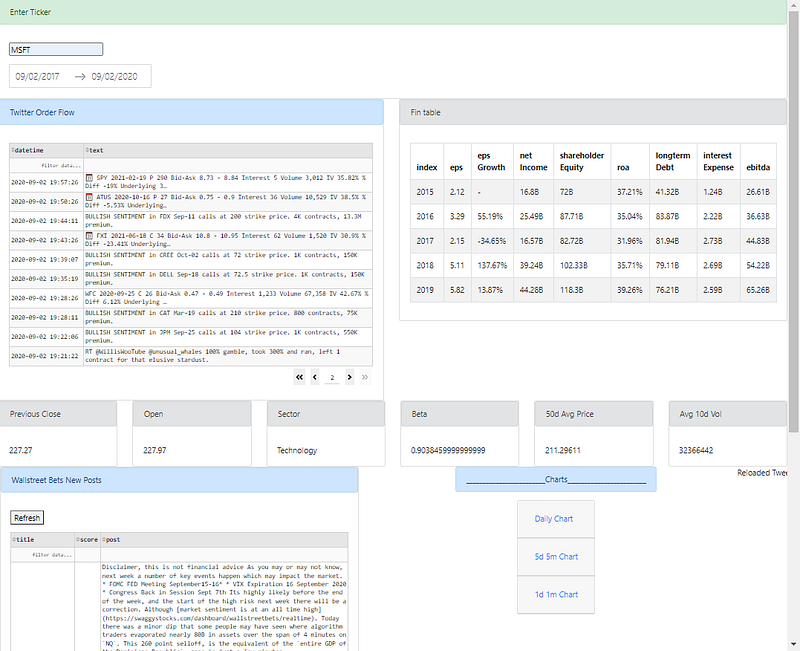
Beyond the data sources, the dashboard takes 3 initial inputs from a user:
Stock ticker, Start Date, End date

The Start Date and End Date are pre-populated with the maximum date range. When a ticker is entered, the dashboard pulls data from Yahoo! Finance and Market Watch to produce information about the company’s financials and price history. The price history data from Yahoo! Finance is used to produce three charts:
3 Year daily chart, 5 day 15 min chart, 1 day 1 minute chart
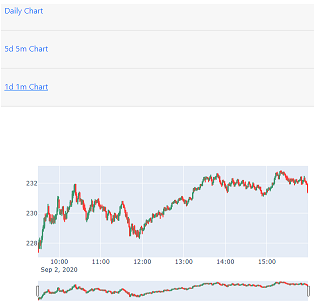
The 3 Year daily Chart can be adjusted by the Start Date and End Date fields giving a little bit more flexibility with the price data.
Sourcing the Data
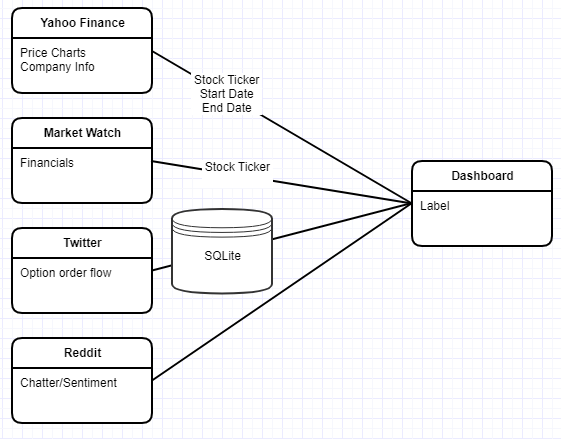
The dashboard pulls data from multiple sources. Most of the data is scraped from the web on the fly, but the Twitter data is also stored and read from an SQLite database to make refreshing and filtering much more performant.
Yahoo! Finance
Although Yahoo! Finance decommissioned their API a while back, the python library yfinance offers a reliable, threaded, and Pythonic way to download historical market data for free!
pip install yfinanceI use Yahoo! Finance to pull price history and company information like the beta and sector.
Market Watch
Market Watch is a market and business news information website.

Scraping Market Watch, it is easy to pull financial information about the company going back 5 years. The data is scraped from the website using the Beautiful Soup library.
pip install beautifulsoup4It helps if you are somewhat familiar with the html before getting into web scraping. The basics of web scraping are beyond the scope of this article.
For this tutorial, you will need to register an app with Twitter to get API Keys. I use the Python library Tweepy to interact with Twitter. Connecting Tweepy to Twitter uses OAuth1. Check out this tutorial for getting started with Tweepy and the Twitter API if needed!
pip install tweepyTwitter is used to download free options order flow data. Two users post free order flow data: SwaggyStocks and Unusual_whales. The premise behind watching option order flow is that big orders in the options market can indicate momentum in the underlying asset. Some people believe following big orders is following smart money. Just remember that even smart money can be wrong!
I am using PRAW to connect to the Reddit API. A user account to Reddit is required to use the API. It is completely free and only requires an email address! Read this tutorial if you’re completely new to using Reddit and the Reddit API.
pip install prawReddit is used to scrape new posts from the subreddit WallStreet Bets. It is a large community in which traders place high risk/high reward trades. It is useful for gauging market chatter and sentiment.
Dash Framework Refresher
Dash is a framework for Python written on top of Flask, Plotly.js, and React.js. Dash and Plotly are vast and powerful tools, and this is only a taste of what they can do! Check out the Dash community or Learn Python Dashboards for more examples and tutorials!
pip install dashDash apps are composed of a Layout and Callbacks:
Layout
The layout is made up of a tree of components that describe what the application looks like and how users experience the content.
Callbacks
Callbacks make the Dash apps interactive. Callbacks are Python functions that are automatically called whenever an input property changes.
Dash Bootstrap Components
To make it easier to design the app layout, I’m using Dash Bootstrap Components. Similar to how the dash-html-components library allows you to apply HTML using Python, the dash-bootstrap-components library allows you to apply Bootstraps front-end components that are affected by the Bootstrap CSS framework.
pip install dash-bootstrap-componentsThe responsive grid system in bootstrap CSS and the convenient container wrappers allow for a lot of customization. Bootstrap’s grid system uses a series of containers, rows, and 12 columns in which one can lay out and align content. Those have been included as components in dash-bootstrap-components library as Container, Row, and Col.
The File Structure
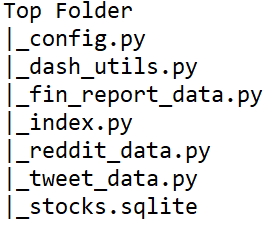
Although this seems like a lot of files, it isn’t really that much code! It is completely fine to have all the code in 1 file for this dashboard. I personally like short files, so I put the functions into their own file and call index.py to run the app.
File config.py & Managing API Keys
This project uses API keys to get data from Reddit and Twitter. If you’re new to managing your keys, make sure to save them into a config.py file instead of hard-coding them in your app. API keys can be very valuable and must be protected. Add the config file to your gitignore file to prevent it from being pushed to your repo too!
File stocks.sqlite
The file stocks.sqlite is the database file used to store the tweet data. That makes it easier to stream into the app as new tweets are generated. The refresh occurs automatically thanks to Dash’s Interval component!
Creating the Files
Finally on to the code! I’ll start with the simplest functions that pull the data and then end with creating the actual app file, index.py. I do my best to include comments in the code, as well as describe the overall functions.
Import dependencies
Start by importing the required libraries
import dash
import dash_core_components as dcc
import dash_html_components as html
import dash_bootstrap_components as dbc
from dash.dependencies import Input, Output, State
import dash_table
from dash.exceptions import PreventUpdate
import flask
from flask import Flask
import pandas as pd
import dateutil.relativedelta
from datetime import date
import datetime
import yfinance as yf
import numpy as np
import praw
import sqlite3import plotly
import plotly.graph_objects as go
from plotly.subplots import make_subplotsCreate dash_utils.py
The file dash_utils.py contains helper functions for the dash components used in the app’s layout. Anyone who has used dash before knows the layout can get pretty long pretty fast, especially if using a lot of data tables like this dashboard! To reduce the repetitiveness of adding components and bloating the layout, I created functions that I can reuse to add components to the dash app:
- ticker_inputs
- make_table
- make_card
- make_item
ticker_inputs
The function ticker_inputs is used to return the components that allow the user to enter the stock ticker and select a Start Date and End Date.
def ticker_inputs(inputID, pickerID, MONTH_CUTTOFF):
    #calculate the current date
    currentDate = date.today()
#calculate past date for the max allowed date
pastDate = currentDate - dateutil.relativedelta.relativedelta(months=MONTH_CUTTOFF)
#return the layout components
return html.Div([
dcc.Input(id = inputID, type="text", placeholder="MSFT")
, html.P(" ")
, dcc.DatePickerRange(
id = pickerID,
min_date_allowed=pastDate,
start_date = pastDate,
#end_date = currentDate
)])Notice the function takes inputID and pickerID as arguments to use as the component ID. Component ID’s must be unique and are used by the callbacks.
make_card
To make things look nice, I like using Cards! The function make_card is used to combine Dash Bootstrap components Card and Alert. Bootstrap’s cards provide a flexible content container and allow a fair amount of customization. Alert is used to easily add color and more style if desired.
def make_card(alert_message, color, cardbody, style_dict = None):

    return  dbc.Card([  dbc.Alert(alert_message, color=color)
        ,dbc.CardBody(cardbody)
        ], style = style_dict)
Notice the function takes in an alert message for the header, a color, a card body, and a style dictionary.
make_item
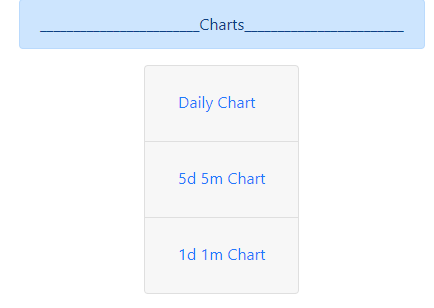
The function make_item is used to build the price chart Accordion.
def make_item(button, cardbody, i):
    # This function makes the accordion items
    return dbc.Card([
        dbc.CardHeader(
            html.H2(
                dbc.Button(
                    button,
                    color="link",
                    id=f"group-{i}-toggle"))),
        dbc.Collapse(
            dbc.CardBody(cardbody),
            id=f"collapse-{i}")])
Notice the function takes a button for the button name, cardbody for card body, and i for the Dash Bootstrap Collapse component ID. The component ID’s must be unique!
make_table
The last of the dash_util functions is make_table. Since Dash DataTable’s have so many parameters, tweaking them all individually can be tedious. Therefore, I made a function!
def make_table(id, dataframe, lineHeight = '17px', page_size = 5):
    return   dash_table.DataTable(
        id=id,
        css=[{'selector': '.row', 'rule': 'margin: 0'}],
        columns=[
            {"name": i, "id": i} for i in dataframe.columns
        ],
        style_header={
            'backgroundColor': 'rgb(230, 230, 230)',
            'fontWeight': 'bold'},
            style_cell={'textAlign': 'left'},
            style_data={
                'whiteSpace': 'normal',
                'height': 'auto',
                'lineHeight': lineHeight
            },

        style_data_conditional=[
                {
                    'if': {'row_index': 'odd'},
                    'backgroundColor': 'rgb(248, 248, 248)'
                }
            ],
        style_cell_conditional=[
            {'if': {'column_id': 'title'},
            'width': '130px'},
            {'if': {'column_id': 'post'},
            'width': '500px'},
            {'if': {'column_id': 'datetime'},
            'width': '130px'},
            {'if': {'column_id': 'text'},
            'width': '500px'}],
        page_current=0,
        page_size=page_size,
page_action='custom',filter_action='custom',
filter_query='',sort_action='custom',
sort_mode='multi',
sort_by=[]
)#end tableThe only arguments needed for the function are id for a unique Component ID, and df for a Pandas DataFrame. Review this tutorial for details on all the Dash Data_table parameters.
Create fin_report_data.py
This file contains the get_financial_report function used to scrape Market Watch and return financial data like EPS, EPS Growth, Net Income, and EBITDA. This function is a little complicated so I’ll explain it in chunks.
The function get_financial_report takes in the stock ticker and it builds two URLs to scrape:
- Market Watch’s /financials
- Market Watch’s /financials/balance-sheet
def get_financial_report(ticker):#build URLs
urlfinancials = 'https://www.marketwatch.com/investing/stock/'+ticker+'/financials'
urlbalancesheet = 'https://www.marketwatch.com/investing/stock/'+ticker+'/financials/balance-sheet'#request the data using beautiful soup
text_soup_financials = BeautifulSoup(requests.get(urlfinancials).text,"html")
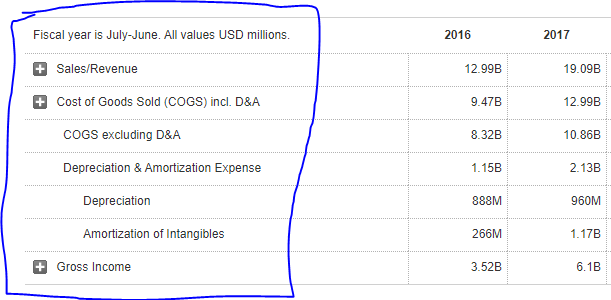
text_soup_balancesheet = BeautifulSoup(requests.get(urlbalancesheet).text,"html")Now that the web data is scraped, I want to find all the row titles. If the row title matches the value we want to use in the dashboard, I’ll save it to a list.
# build lists for Income statement
    titlesfinancials = text_soup_financials.findAll('td', {'class': 'rowTitle'})
    epslist=[]
    netincomelist = []
    longtermdebtlist = []
    interestexpenselist = []
    ebitdalist= []
#load data into lists if the row title is found
for title in titlesfinancials:
if 'EPS (Basic)' in title.text:
epslist.append ([td.text for td in title.findNextSiblings(attrs={'class': 'valueCell'}) if td.text])
if 'Net Income' in title.text:
netincomelist.append ([td.text for td in title.findNextSiblings(attrs={'class': 'valueCell'}) if td.text])
if 'Interest Expense' in title.text:
interestexpenselist.append ([td.text for td in title.findNextSiblings(attrs={'class': 'valueCell'}) if td.text])
if 'EBITDA' in title.text:
ebitdalist.append ([td.text for td in title.findNextSiblings(attrs={'class': 'valueCell'}) if td.text])# find the table headers for the Balance sheet
titlesbalancesheet = text_soup_balancesheet.findAll('td', {'class': 'rowTitle'})
equitylist=[]
for title in titlesbalancesheet:
if 'Total Shareholders\' Equity' in title.text:
equitylist.append( [td.text for td in title.findNextSiblings(attrs={'class': 'valueCell'}) if td.text])
if 'Long-Term Debt' in title.text:
longtermdebtlist.append( [td.text for td in title.findNextSiblings(attrs={'class': 'valueCell'}) if td.text])Notice findNextSiblings (beautifulsoup) is used to return the siblings of the Tag that match the given criteria and appear after this Tag in the document. To clarify, since the left most item (rowTitle) is what I use to match, findNextSiblings gets me to the value I want to save in the list.
Once the values are scraped, the helper function get_element is used to load the data.
#get the data from the income statement lists
 #use helper function get_element
    eps = get_element(epslist,0)
    epsGrowth = get_element(epslist,1)
    netIncome = get_element(netincomelist,0)
    shareholderEquity = get_element(equitylist,0)
    roa = get_element(equitylist,1)
longtermDebt = get_element(longtermdebtlist,0)
interestExpense = get_element(interestexpenselist,0)
ebitda = get_element(ebitdalist,0)Once the values have been saved to the lists, transform them into a pandas DataFrame. Reset the dataframe index and return the dataframe!
# load all the data into dataframe
    fin_df= pd.DataFrame({'eps': eps,'eps Growth': epsGrowth,'net Income': netIncome,'shareholder Equity': shareholderEquity,'roa':
                  roa,'longterm Debt': longtermDebt,'interest Expense': interestExpense,'ebitda': ebitda},index=range(date.today().year-5,date.today().year))

    fin_df.reset_index(inplace=True)

    return fin_df
#helper function
def get_element(list,element):
try:
return list[element]
except:
return '-'Notice the helper function get_element is used to return an “ — “ if it cannot find an item in the list of scraped data.
Create reddit_data.py
The file reddit_data.py contains the functions to interact with the Reddit API through Praw. Import the dependencies and the API key from the config.py file, then use a function to transform the data into a data frame.
import pandas as pd
import praw
from config import r_cid, r_csec, r_uag
def get_reddit(cid= r_cid, csec= r_csec, uag= r_uag, subreddit='wallstreetbets'):
#connect to reddit
reddit = praw.Reddit(client_id= cid, client_secret= csec, user_agent= uag)#get the new reddit posts
posts = reddit.subreddit(subreddit).new(limit=None)#load the posts into a pandas dataframe
p = []
for post in posts:
p.append([post.title, post.score, post.selftext])
posts_df = pd.DataFrame(p,columns=['title', 'score', 'post'])
return posts_dfNotice I define the function get_reddit(). It takes in the API credentials and the subreddit name (wallstreetbets by default). Notice within the function the data gets saved from Reddit to the variable posts. The data is then unpacked, and appended in list variable p, and then saved as pandas DataFrame object named posts_df.
Create twitter_data.py
The file tweet_data.py contains the functions to interact with the twitter API through Tweepy. Pulling historical tweets from users is a little complex since we want to save the results to SQLite. To make it less complex, I split it into two functions. The first is responsible for getting the twitter data. The second is responsible for cleaning and saving it:
- get_all_tweets
- get_options_flow
The function get_all_tweets pulls as many historical tweets as possible from the user, up to around 3200 max.
def get_all_tweets(screen_name
,consumer_key = t_conkey
, consumer_secret= t_consec
, access_key= t_akey
, access_secret= t_asec
):
#Twitter only allows access to a users most recent 3240 tweets with this method
#authorize twitter, initialize tweepy
auth = tweepy.OAuthHandler(consumer_key, consumer_secret)
auth.set_access_token(access_key, access_secret)
api = tweepy.API(auth)
#initialize a list to hold all the tweepy Tweets
alltweets = []
#make initial request for most recent tweets (200 is the maximum allowed count)
new_tweets = api.user_timeline(screen_name = screen_name,count=200)
#save most recent tweets
alltweets.extend(new_tweets)
#save the id of the oldest tweet less one
oldest = alltweets[-1].id - 1
#keep grabbing tweets until there are no tweets left to grab
while len(new_tweets) > 0:
#all subsequent requests use the max_id param to prevent duplicates
new_tweets = api.user_timeline(screen_name = screen_name,count=200,max_id=oldest)
#save most recent tweets
alltweets.extend(new_tweets)
#update the id of the oldest tweet less one
oldest = alltweets[-1].id - 1
outtweets = [[tweet.id_str, tweet.created_at, tweet.text] for tweet in alltweets]
tweets_df = pd.DataFrame(outtweets, columns = ['time', 'datetime', 'text'])return tweets_dfNotice the function takes the twitter API credentials and the username of the twitter account I want to track. The function cycles through the historical tweets, adding them to a list. The list is then transformed into a pandas DataFrame objected named tweets_df.
The function get_options_flow takes no arguments. It calls the get_all_tweets function, cleans the tweet data and saves it to the SQLite database so it can be called into the app frequently and automatically without impacting performance.
def get_options_flow():
#connect to the sqlite database
conn = sqlite3.connect('stocks.sqlite')
#use get_all_tweets to pull the data from the twitter users
ss = get_all_tweets(screen_name ="SwaggyStocks")
uw = get_all_tweets(screen_name ="unusual_whales")
#clean the text data
ss['source'] = 'swaggyStocks'
ss['text'] = hero.remove_urls(ss['text'])
ss['text'] = [n.replace('$','') for n in ss['text']]
#clean the text data
uw['source'] = 'unusual_whales'
uw['text'] = hero.remove_urls(uw['text'])
uw['text'] = [n.replace('$','') for n in uw['text']]
uw['text'] = [n.replace(':','') for n in uw['text']]
uw['text'] = [n.replace('\n',' ') for n in uw['text']]
uw['text'] = [n.replace(' ',' ') for n in uw['text']]
#concat the tweets into one dataframe
tweets = pd.concat([ss, uw])#save the tweets to sqlite database
tweets.to_sql('tweets', conn, if_exists = 'replace')return print('done')Notice the function uses regex and Texthero to clean the tweet text of special characters and URLs. Notice the two dataframes ss and uw of tweets are concatenated together and saved as one table in stocks.sqlite.
Create index.py
The index.py file consists of the code to instantiate the Dash app. It contains the layout and callbacks used to make the app interactive. This is the file I execute in the terminal using a command like $ python index.py
It is finally time to put it all together and construct the Dash App! Assuming the dependencies have been imported, start by instantiating the Dash App and calling the data functions to load the Twitter and Reddit data.
#Connect to sqlite database
conn = sqlite3.connect('stocks.sqlite')#instantiate dash app server using flask for easier hosting
server = Flask(__name__)
app = dash.Dash(__name__,server = server ,meta_tags=[{ "content": "width=device-width"}], external_stylesheets=[dbc.themes.BOOTSTRAP])#used for dynamic callbacks
app.config.suppress_callback_exceptions = True#get options flow from twitter
get_options_flow()
flow = pd.read_sql("select datetime, text from tweets order by datetime desc", conn)#get reddit data
global dfr
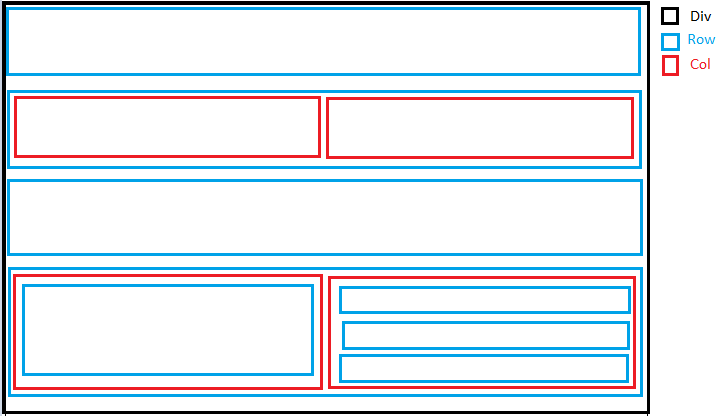
dfr = get_reddit()After instantiating the server and loading the data, create the layout. The layout I went with is fairly simple. The layout components are wrapped around each other to achieve the desired layout look. I use an html.Div component to wrap the bootstrap grid components dbc.Row and dbc.Col. I construct a layout organizing Rows and Columns within one another like so:
layout1 = html.Div([
dbc.Row([dbc.Col(make_card("Enter Ticker", "success", ticker_inputs('ticker-input', 'date-picker', 36)))]) #row 1
,dbc.Row([dbc.Col([make_card("Twitter Order Flow", 'primary', make_table('table-sorting-filtering2', flow, '17px', 10))])
,dbc.Col([make_card("Fin table ", "secondary", html.Div(id="fin-table"))])
])
, dbc.Row([make_card("select ticker", "warning", "select ticker")],id = 'cards') #row 2
, dbc.Row([
dbc.Col([
dbc.Row([make_card("Wallstreet Bets New Posts", 'primary'
,[html.P(html.Button('Refresh', id='refresh'))
, make_table('table-sorting-filtering', dfr, '17px', 4)])], justify = 'center')
])
,dbc.Col([dbc.Row([dbc.Alert("_Charts_", color="primary")], justify = 'center')
,dbc.Row(html.Div(id='x-vol-1'), justify = 'center')
, dcc.Interval(
id='interval-component',
interval=1*150000, # in milliseconds
n_intervals=0)
, dcc.Interval(
id='interval-component2',
interval=1*60000, # in milliseconds
n_intervals=0)
,dbc.Row([html.Div(id='tweets')])
])#end col
])#end row
]) #end divapp.layout= layout1Notice two things: Bold functions and Interval components.
I set all of the dash_util functions to bold so it is easier to see how they are strung together to produce cards with tables inside. For example, look at the Twitter Order Flow card:
make_card("Twitter Order Flow", 'primary', make_table('table-sorting-filtering2', flow, '17px', 10))
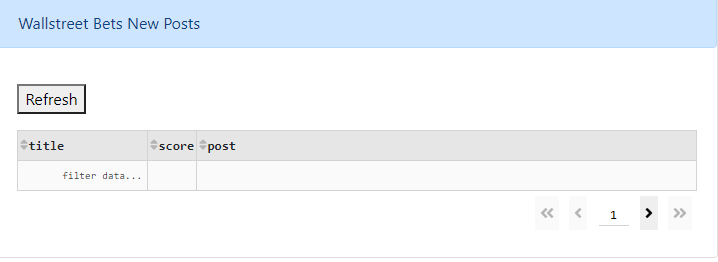
Notice I pass function make_table as cardbody in function make_card(title, color, cardbody, style_dict). That is how the tables appear inside the card in the layout!
Dash core component dcc.Interval is used to automatically refresh the Twitter feed every minute or so. That is why there is no Refresh button like the Reddit data.
Adding Callbacks
Now that the layout is complete, I’ll make the app functional by adding the callbacks. There are seven callbacks. I’ll break them down as follows:
Refreshing Twitter Data Loading the Company Info Cards Sorting and Filtering Reddit and Twitter tables Populating the Financial Report Populating the Charts
Refreshing Twitter Data
This callback uses the interval component to automatically execute the get_options_flow function every minute.
@app.callback(
Output('tweets', 'children'),
[Input('interval-component2', 'n_intervals'),
])
def new_tweets(n):
get_options_flow()
return html.P(f"Reloaded Tweets {n}")Loading the Company Info Cards
This callback passes the input Ticker to yfinance and returns bootstrap component Cards populated with company and historic price data. The make_card function is bold to make it easier to see.
@app.callback(Output('cards', 'children'),
[Input('ticker-input', 'value')])
def refresh_cards(ticker):
ticker = ticker.upper()
if ticker is None:
TICKER = 'MSFT'
else:
TICKER = yf.Ticker(ticker)
cards = [ dbc.Col(make_card("Previous Close ", "secondary", TICKER.info['previousClose']))
, dbc.Col(make_card("Open", "secondary", TICKER.info['open']))
, dbc.Col(make_card("Sector", 'secondary', TICKER.info['sector']))
, dbc.Col(make_card("Beta", 'secondary', TICKER.info['beta']))
, dbc.Col(make_card("50d Avg Price", 'secondary', TICKER.info['fiftyDayAverage']))
, dbc.Col(make_card("Avg 10d Vol", 'secondary', TICKER.info['averageVolume10days']))
] #end cards list
return cardsNotice I’m setting the ticker to upper case using .upper() for best results using yfinance and Market Watch.
Sorting and Filtering Reddit and Twitter tables
These callbacks are fairly similar so I’m only going to review one here. Check the full code at the end for both. The callbacks use mostly boiler plate code for Dash tables with sorting and filtering enabled.
The Reddit data callback takes in the n_clicks input from the dcc.Button component so the Refresh button can be used to reload the results.
@app.callback(
Output('table-sorting-filtering', 'data'),
[Input('table-sorting-filtering', "page_current"),
Input('table-sorting-filtering', "page_size"),
Input('table-sorting-filtering', 'sort_by'),
Input('table-sorting-filtering', 'filter_query'),
Input('refresh', 'n_clicks')])
def update_table(page_current, page_size, sort_by, filter, n_clicks):
filtering_expressions = filter.split(' && ') if n_clicks is None:
raise PreventUpdate
else:
dff = get_reddit()
for filter_part in filtering_expressions:
col_name, operator, filter_value = split_filter_part(filter_part) if operator in ('eq', 'ne', 'lt', 'le', 'gt', 'ge'):
# these operators match pandas series operator method names
dff = dff.loc[getattr(dff[col_name], operator)(filter_value)]
elif operator == 'contains':
dff = dff.loc[dff[col_name].str.contains(filter_value)]
elif operator == 'datestartswith':
# this is a simplification of the front-end filtering logic,
# only works with complete fields in standard format
dff = dff.loc[dff[col_name].str.startswith(filter_value)] if len(sort_by):
dff = dff.sort_values(
[col['column_id'] for col in sort_by],
ascending=[
col['direction'] == 'asc'
for col in sort_by
],
inplace=False) page = page_current
size = page_size
return dff.iloc[page * size: (page + 1) * size].to_dict('records')Populating the Financial Report
This callback takes the ticker and passes it to the get_fin_report function. It returns a Dash Bootstrap table instead of using the make_table function.
@app.callback(Output('fin-table', 'children'),
[Input('ticker-input', 'value')])
def fin_report(sym):
sym = sym.upper()
df = get_financial_report(sym)
table = dbc.Table.from_dataframe(df, striped=True
, bordered=True, hover=True)
return tablePopulating the Charts
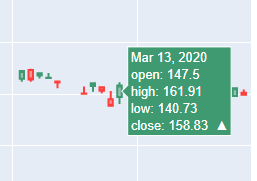
All three charts are called at once in the same callback. The callback takes the Ticker, Start Date and End Date as inputs. It also takes an interval input from dbc.Interval to refresh the chart data automatically. The graphs are generated using Plotly’s candlestick charts for the authentic trader experience! The callback returns the chart Accordion.
@app.callback(Output('x-vol-1', 'children'),
[Input('ticker-input', 'value')
, Input('date-picker', 'start_date')
, Input('date-picker', 'end_date')
, Input('interval-component', 'n_intervals')
])
def create_graph(ticker,startdate, enddate, n):
ticker = ticker.upper()
df1 = yf.download(ticker,startdate, enddate)
df1.reset_index(inplace=True)
fig1 = go.Figure(data=[go.Candlestick(x=df1['Date'],
open=df1['Open'], high=df1['High'],
low=df1['Low'], close=df1['Close'])
])
df2 = yf.download(ticker, period = "5d", interval = "1m")
df2.reset_index(inplace=True)
fig2 = go.Figure(data=[go.Candlestick(x=df2['Datetime'],
open=df2['Open'], high=df2['High'],
low=df2['Low'], close=df2['Close'])
]) df3 = yf.download(ticker, period = "1d", interval = "1m")
df3.reset_index(inplace=True)
fig3 = go.Figure(data=[go.Candlestick(x=df3['Datetime'],
open=df3['Open'], high=df3['High'],
low=df3['Low'], close=df3['Close'])
])
accordion = html.Div([make_item("Daily Chart",
dcc.Graph(figure = fig1), 1 )
, make_item("5d 5m Chart"
, dcc.Graph( figure = fig2), 2)
, make_item("1d 1m Chart"
, dcc.Graph(figure = fig3), 3)
], className="accordion")
return accordionCongratulations, the dashboard is completed! You are on your way to finding an edge and dominating the stock market! If you want to protect access to your dashboard, you can add user authentication. Learn how in my tutorial, How to Setup User Authentication for Dash Apps using Python and Flask.

Final Thoughts and Complete Code
Although this seems like a lot of code to go through, using Dash is fairly easy once you understand the layout and callback patterns. Using functions makes putting together the layout a breeze and saves on repeating code. This app is a great place to start, but can easily be enhanced to include technical analysis, more company info, and predictive analytics. It might even be possible to set up a broker API and trade through it!
Thanks for reading. Check out my other articles if you’re interested in the stock market, programming and data science:
The Code
Find it on Github too!
Dash_utils.py
import dash
import dash_core_components as dcc
import dash_html_components as html
import dash_bootstrap_components as dbc
from dash.dependencies import Input, Output, State
import dash_tableimport flask
from flask import Flask
import pandas as pd
import dateutil.relativedelta
from datetime import date
import datetime
import yfinance as yf
import numpy as np
import praw
import sqlite3import plotly
import plotly.graph_objects as go
from plotly.subplots import make_subplotsdef make_table(id, dataframe, lineHeight = '17px', page_size = 5):
return dash_table.DataTable(
id=id,
css=[{'selector': '.row', 'rule': 'margin: 0'}],
columns=[
{"name": i, "id": i} for i in dataframe.columns
],
style_header={
'backgroundColor': 'rgb(230, 230, 230)',
'fontWeight': 'bold'},
style_cell={'textAlign': 'left'},
style_data={
'whiteSpace': 'normal',
'height': 'auto',
'lineHeight': lineHeight
},
# style_table = {'width':300},
style_data_conditional=[
{
'if': {'row_index': 'odd'},
'backgroundColor': 'rgb(248, 248, 248)'
}
],
style_cell_conditional=[
{'if': {'column_id': 'title'},
'width': '130px'},
{'if': {'column_id': 'post'},
'width': '500px'},
{'if': {'column_id': 'datetime'},
'width': '130px'},
{'if': {'column_id': 'text'},
'width': '500px'}],
page_current=0,
page_size=page_size,
page_action='custom',filter_action='custom',
filter_query='',sort_action='custom',
sort_mode='multi',
sort_by=[],
#dataframe.to_dict('records')
)def make_card(alert_message, color, cardbody, style_dict = None):
return dbc.Card([ dbc.Alert(alert_message, color=color)
,dbc.CardBody(cardbody)
], style = style_dict)#end carddef ticker_inputs(inputID, pickerID, MONTH_CUTTOFF):
currentDate = date.today()
pastDate = currentDate - dateutil.relativedelta.relativedelta(months=MONTH_CUTTOFF)
return html.Div([
dcc.Input(id = inputID, type="text", placeholder="MSFT")
, html.P(" ")
, dcc.DatePickerRange(
id = pickerID,
min_date_allowed=pastDate,
#max_date_allowed=currentDate,
#initial_visible_month=dt(2017, 8, 5),
start_date = pastDate,
#end_date = currentDate
)])def make_item(button, cardbody, i):
# we use this function to make the example items to avoid code duplication
return dbc.Card([
dbc.CardHeader(
html.H2(
dbc.Button(
button,
color="link",
id=f"group-{i}-toggle",
))
),
dbc.Collapse(
dbc.CardBody(cardbody),
id=f"collapse-{i}",
)])Reddit_data.py
import pandas as pd
import dateutil.relativedelta
from datetime import date
import datetime
import yfinance as yf
import numpy as np
import praw
import sqlite3from config import r_cid, r_csec, r_uag#return a dataframe for the newest reddit posts
def get_reddit(cid= r_cid, csec= r_csec, uag= r_uag, subreddit='wallstreetbets'):

    #connect to reddit
reddit = praw.Reddit(client_id= cid, client_secret= csec, user_agent= uag)#get the new reddit posts
posts = reddit.subreddit(subreddit).new(limit=None)#load the posts into a pandas dataframe
p = []
for post in posts:
p.append([post.title, post.score, post.selftext])
posts_df = pd.DataFrame(p,columns=['title', 'score', 'post'])
return posts_dftweet_data.py
import tweepy
import pandas as pd
import sqlite3
import json
import datetime
from datetime import date
import texthero as hero
import regex as re
import stringfrom config import t_conkey, t_consec, t_akey, t_asecpd.set_option('display.max_colwidth',None)def get_all_tweets(screen_name
,consumer_key = t_conkey
, consumer_secret= t_consec
, access_key= t_akey
, access_secret= t_asec
):
#Twitter only allows access to a users most recent 3240 tweets with this method
#authorize twitter, initialize tweepy
auth = tweepy.OAuthHandler(consumer_key, consumer_secret)
auth.set_access_token(access_key, access_secret)
api = tweepy.API(auth)
#initialize a list to hold all the tweepy Tweets
alltweets = []
#make initial request for most recent tweets (200 is the maximum allowed count)
new_tweets = api.user_timeline(screen_name = screen_name,count=200)
#save most recent tweets
alltweets.extend(new_tweets)
#save the id of the oldest tweet less one
oldest = alltweets[-1].id - 1
#keep grabbing tweets until there are no tweets left to grab
while len(new_tweets) > 0:
#print(f"getting tweets before {oldest}")
#all subsiquent requests use the max_id param to prevent duplicates
new_tweets = api.user_timeline(screen_name = screen_name,count=200,max_id=oldest)
#save most recent tweets
alltweets.extend(new_tweets)
#update the id of the oldest tweet less one
oldest = alltweets[-1].id - 1
outtweets = [[tweet.id_str, tweet.created_at, tweet.text] for tweet in alltweets]
tweets_df = pd.DataFrame(outtweets, columns = ['time', 'datetime', 'text'])return tweets_dfdef get_options_flow():
conn = sqlite3.connect('stocks.sqlite')ss = get_all_tweets(screen_name ="SwaggyStocks")
uw = get_all_tweets(screen_name ="unusual_whales")
ss['source'] = 'swaggyStocks'
ss['text'] = hero.remove_urls(ss['text'])
ss['text'] = [n.replace('$','') for n in ss['text']]
uw['source'] = 'unusual_whales'
uw['text'] = hero.remove_urls(uw['text'])
uw['text'] = [n.replace('$','') for n in uw['text']]
uw['text'] = [n.replace(':','') for n in uw['text']]
uw['text'] = [n.replace('\n',' ') for n in uw['text']]
uw['text'] = [n.replace(' ',' ') for n in uw['text']]
tweets = pd.concat([ss, uw])
tweets.to_sql('tweets', conn, if_exists = 'replace')return print('done')get_fin_report.py
import pandas as pd
from bs4 import BeautifulSoup
import requests
from datetime import datedef get_financial_report(ticker):# try:
urlfinancials = 'https://www.marketwatch.com/investing/stock/'+ticker+'/financials'
urlbalancesheet = 'https://www.marketwatch.com/investing/stock/'+ticker+'/financials/balance-sheet'text_soup_financials = BeautifulSoup(requests.get(urlfinancials).text,"html") #read in
text_soup_balancesheet = BeautifulSoup(requests.get(urlbalancesheet).text,"html") #read in# build lists for Income statement
titlesfinancials = text_soup_financials.findAll('td', {'class': 'rowTitle'})
epslist=[]
netincomelist = []
longtermdebtlist = []
interestexpenselist = []
ebitdalist= []for title in titlesfinancials:
if 'EPS (Basic)' in title.text:
epslist.append ([td.text for td in title.findNextSiblings(attrs={'class': 'valueCell'}) if td.text])
if 'Net Income' in title.text:
netincomelist.append ([td.text for td in title.findNextSiblings(attrs={'class': 'valueCell'}) if td.text])
if 'Interest Expense' in title.text:
interestexpenselist.append ([td.text for td in title.findNextSiblings(attrs={'class': 'valueCell'}) if td.text])
if 'EBITDA' in title.text:
ebitdalist.append ([td.text for td in title.findNextSiblings(attrs={'class': 'valueCell'}) if td.text])# find the table headers for the Balance sheet
titlesbalancesheet = text_soup_balancesheet.findAll('td', {'class': 'rowTitle'})
equitylist=[]
for title in titlesbalancesheet:
if 'Total Shareholders\' Equity' in title.text:
equitylist.append( [td.text for td in title.findNextSiblings(attrs={'class': 'valueCell'}) if td.text])
if 'Long-Term Debt' in title.text:
longtermdebtlist.append( [td.text for td in title.findNextSiblings(attrs={'class': 'valueCell'}) if td.text])#get the data from the income statement lists
#use helper function get_element
eps = get_element(epslist,0)
epsGrowth = get_element(epslist,1)
netIncome = get_element(netincomelist,0)
shareholderEquity = get_element(equitylist,0)
roa = get_element(equitylist,1)longtermDebt = get_element(longtermdebtlist,0)
interestExpense = get_element(interestexpenselist,0)
ebitda = get_element(ebitdalist,0)# load all the data into dataframe
fin_df= pd.DataFrame({'eps': eps,'eps Growth': epsGrowth,'net Income': netIncome,'shareholder Equity': shareholderEquity,'roa':
roa,'longterm Debt': longtermDebt,'interest Expense': interestExpense,'ebitda': ebitda},index=range(date.today().year-5,date.today().year))
fin_df.reset_index(inplace=True)
return fin_dfdef get_element(list,element):
try:
return list[element]
except:
return '-'index.py
import dash
import dash_core_components as dcc
import dash_html_components as html
import dash_bootstrap_components as dbc
from dash.dependencies import Input, Output, State
import dash_table
from dash.exceptions import PreventUpdateimport flask
from flask import Flask
import pandas as pd
import dateutil.relativedelta
from datetime import date
import datetime
import yfinance as yf
import numpy as np
import praw
import sqlite3import plotly
import plotly.graph_objects as go
from plotly.subplots import make_subplotsfrom dash_utils import make_table, make_card, ticker_inputs, make_item
from reddit_data import get_reddit
from tweet_data import get_options_flow
from fin_report_data import get_financial_report #, get_financial_reportformattedconn = sqlite3.connect('stocks.sqlite')server = Flask(__name__)
app = dash.Dash(__name__,server = server ,meta_tags=[{ "content": "width=device-width"}], external_stylesheets=[dbc.themes.BOOTSTRAP])app.config.suppress_callback_exceptions = Trueget_options_flow()
flow = pd.read_sql("select datetime, text from tweets order by datetime desc", conn)global dfr
dfr = get_reddit()
layout1 = html.Div([
dbc.Row([dbc.Col(make_card("Enter Ticker", "success", ticker_inputs('ticker-input', 'date-picker', 36)))]) #row 1
,dbc.Row([dbc.Col([make_card("Twitter Order Flow", 'primary', make_table('table-sorting-filtering2', flow, '17px', 10))])
,dbc.Col([make_card("Fin table ", "secondary", html.Div(id="fin-table"))])
])
, dbc.Row([make_card("select ticker", "warning", "select ticker")],id = 'cards') #row 2
, dbc.Row([
dbc.Col([
dbc.Row([make_card("Wallstreet Bets New Posts"
, 'primary'
,[html.P(html.Button('Refresh', id='refresh'))
, make_table('table-sorting-filtering', dfr, '17px', 4)]
)], justify = 'center')
])
,dbc.Col([dbc.Row([dbc.Alert("__Charts__", color="primary")], justify = 'center')
,dbc.Row(html.Div(id='x-vol-1'), justify = 'center')
, dcc.Interval(
id='interval-component',
interval=1*150000, # in milliseconds
n_intervals=0)
, dcc.Interval(
id='interval-component2',
interval=1*60000, # in milliseconds
n_intervals=0)
,dbc.Row([html.Div(id='tweets')])
])#end col
])#end row
]) #end divapp.layout= layout1operators = [['ge ', '>='],
['le ', '<='],
['lt ', '<'],
['gt ', '>'],
['ne ', '!='],
['eq ', '='],
['contains '],
['datestartswith ']]def split_filter_part(filter_part):
for operator_type in operators:
for operator in operator_type:
if operator in filter_part:
name_part, value_part = filter_part.split(operator, 1)
name = name_part[name_part.find('{') + 1: name_part.rfind('}')]value_part = value_part.strip()
v0 = value_part[0]
if (v0 == value_part[-1] and v0 in ("'", '"', '`')):
value = value_part[1: -1].replace('\\' + v0, v0)
else:
try:
value = float(value_part)
except ValueError:
value = value_part# word operators need spaces after them in the filter string,
# but we don't want these later
return name, operator_type[0].strip(), valuereturn [None] * 3@app.callback(Output('cards', 'children'),
[Input('ticker-input', 'value')])
def refresh_cards(ticker):
ticker = ticker.upper()
if ticker is None:
TICKER = 'MSFT'
else:
TICKER = yf.Ticker(ticker)
cards = [ dbc.Col(make_card("Previous Close ", "secondary", TICKER.info['previousClose']))
, dbc.Col(make_card("Open", "secondary", TICKER.info['open']))
, dbc.Col(make_card("Sector", 'secondary', TICKER.info['sector']))
, dbc.Col(make_card("Beta", 'secondary', TICKER.info['beta']))
, dbc.Col(make_card("50d Avg Price", 'secondary', TICKER.info['fiftyDayAverage']))
, dbc.Col(make_card("Avg 10d Vol", 'secondary', TICKER.info['averageVolume10days']))
] #end cards list
return cards@app.callback(
[Output(f"collapse-{i}", "is_open") for i in range(1, 4)],
[Input(f"group-{i}-toggle", "n_clicks") for i in range(1, 4)],
[State(f"collapse-{i}", "is_open") for i in range(1, 4)],
)
def toggle_accordion(n1, n2, n3, is_open1, is_open2, is_open3):
ctx = dash.callback_context
if not ctx.triggered:
return ""
else:
button_id = ctx.triggered[0]["prop_id"].split(".")[0]
if button_id == "group-1-toggle" and n1:
return not is_open1, False, False
elif button_id == "group-2-toggle" and n2:
return False, not is_open2, False
elif button_id == "group-3-toggle" and n3:
return False, False, not is_open3
return False, False, False@app.callback(Output('x-vol-1', 'children'),
[Input('ticker-input', 'value')
, Input('date-picker', 'start_date')
, Input('date-picker', 'end_date')
, Input('interval-component', 'n_intervals')
])
def create_graph(ticker,startdate, enddate, n):
ticker = ticker.upper()
df1 = yf.download(ticker,startdate, enddate)
df1.reset_index(inplace=True)
fig1 = go.Figure(data=[go.Candlestick(x=df1['Date'],
open=df1['Open'], high=df1['High'],
low=df1['Low'], close=df1['Close'])
])
df2 = yf.download(ticker, period = "5d", interval = "1m")
df2.reset_index(inplace=True)
fig2 = go.Figure(data=[go.Candlestick(x=df2['Datetime'],
open=df2['Open'], high=df2['High'],
low=df2['Low'], close=df2['Close'])
])df3 = yf.download(ticker, period = "1d", interval = "1m")
df3.reset_index(inplace=True)
fig3 = go.Figure(data=[go.Candlestick(x=df3['Datetime'],
open=df3['Open'], high=df3['High'],
low=df3['Low'], close=df3['Close'])
])
accordion = html.Div([make_item("Daily Chart", dcc.Graph(figure = fig1), 1 )
, make_item("5d 5m Chart",dcc.Graph( figure = fig2), 2)
, make_item("1d 1m Chart", dcc.Graph(figure = fig3), 3)
], className="accordion")
return accordion@app.callback(
Output('tweets', 'children'),
[Input('interval-component2', 'n_intervals'),
])
def new_tweets(n):
get_options_flow()
return html.P(f"Reloaded Tweets {n}")@app.callback(
Output('table-sorting-filtering', 'data'),
[Input('table-sorting-filtering', "page_current"),
Input('table-sorting-filtering', "page_size"),
Input('table-sorting-filtering', 'sort_by'),
Input('table-sorting-filtering', 'filter_query'),
Input('refresh', 'n_clicks')])
def update_table(page_current, page_size, sort_by, filter, n_clicks):
filtering_expressions = filter.split(' && ')if n_clicks is None:
raise PreventUpdate
else:
dff = get_reddit()
for filter_part in filtering_expressions:
                col_name, operator, filter_value = split_filter_part(filter_part)
if operator in ('eq', 'ne', 'lt', 'le', 'gt', 'ge'):
# these operators match pandas series operator method names
dff = dff.loc[getattr(dff[col_name], operator)(filter_value)]
elif operator == 'contains':
dff = dff.loc[dff[col_name].str.contains(filter_value)]
elif operator == 'datestartswith':
# this is a simplification of the front-end filtering logic,
# only works with complete fields in standard format
dff = dff.loc[dff[col_name].str.startswith(filter_value)]if len(sort_by):
dff = dff.sort_values(
[col['column_id'] for col in sort_by],
ascending=[
col['direction'] == 'asc'
for col in sort_by
],
inplace=False)page = page_current
size = page_size
return dff.iloc[page * size: (page + 1) * size].to_dict('records')@app.callback(
Output('table-sorting-filtering2', 'data'),
[Input('table-sorting-filtering2', "page_current"),
Input('table-sorting-filtering2', "page_size"),
Input('table-sorting-filtering2', 'sort_by'),
Input('table-sorting-filtering2', 'filter_query'),
Input('interval-component', 'n_intervals')
])
def update_table2(page_current, page_size, sort_by, filter, n):
filtering_expressions = filter.split(' && ')
conn = sqlite3.connect('stocks.sqlite')
flow = pd.read_sql("select datetime, text, source from tweets order by datetime desc", conn)
dff = flowfor filter_part in filtering_expressions:
col_name, operator, filter_value = split_filter_part(filter_part)if operator in ('eq', 'ne', 'lt', 'le', 'gt', 'ge'):
# these operators match pandas series operator method names
dff = dff.loc[getattr(dff[col_name], operator)(filter_value)]
elif operator == 'contains':
dff = dff.loc[dff[col_name].str.contains(filter_value)]
elif operator == 'datestartswith':
# this is a simplification of the front-end filtering logic,
# only works with complete fields in standard format
dff = dff.loc[dff[col_name].str.startswith(filter_value)]if len(sort_by):
dff = dff.sort_values(
[col['column_id'] for col in sort_by],
ascending=[
col['direction'] == 'asc'
for col in sort_by
],
inplace=False
)page = page_current
size = page_size
return dff.iloc[page * size: (page + 1) * size].to_dict('records')@app.callback(Output('fin-table', 'children'),
[Input('ticker-input', 'value')])
def fin_report(sym):
sym = sym.upper()
df = get_financial_report(sym)
#table = make_table('table-sorting-filtering3', df, '20px',8)
table = dbc.Table.from_dataframe(df, striped=True, bordered=True, hover=True)return tableif __name__ == '__main__':
app.run_server()Thank You!
- If you enjoyed this, follow me on Medium for more
- Get FULL ACCESS and help support my content by subscribing
- Let’s connect on LinkedIn
- Analyze Data using Python? Check out my website


