
How to Calculate Variability measures (variance SD etc) in Statistics and Python

In this blog, I am going to talk about Variability measures with hands on in python. If you miss my previous blog about Central Tendency and Asymmetry measures with Python, please go to the below link. https://readmedium.com/how-to-calculate-central-tendency-and-asymmetry-measures-in-statistics-and-python-28b2bc10407d
Now it is time for measuring variability of data. Most commonly use measures are variance , standard deviation and coefficient of variance.
Variance, Standard Deviation & Coefficient of variation (CV):
These two measure the distribution of a set of data points around its mean value.
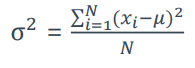
Reason for different formulas of population and sample data: When we are calculating for population data, we are 100% sure about measures. When we are considering sample data, there may be 5 sample data sets and for those 5 different measures. Due to this reason there are different formulas.
Population variance formula:
Sample variance formula:
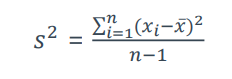
Here we are obtaining the result based on the difference of data point value from the mean of data set. So data point is close to mean, that means lower result and when it is far, that means higher result. Reason for squaring the difference, is not considering negative values as we taking the distance between one point to another.
Variance Example:
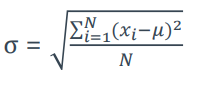
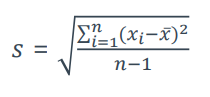
Standard Deviation: As variance is a square number, so it is a large value. Due to this standard deviation is coming to picture using square root function.
Population standard deviation formula
Sample standard deviation formula
Coefficient of variation (CV): Coefficient of variation is (standard deviation /mean). When we are comparing standard deviation of two or more data sets, those are meaningless. But comparing coefficient of variation is meaning full.
Coefficient of variation Example:
Python Coding for Variance, Standard Deviation and Coefficient of variation:
We have covered all univariate measures, now it’s time to explore measures which are related between two variables.
Covariance & Correlation:
Covariance: Covariance is a measure of the joint variability of two variables.
A positive covariance means that the two variables move together.
A covariance of 0 means that the two variables are independent.
A negative covariance means that the two variables move in opposite directions.
Covariance can take on values from -∞ to +∞.
This is a problem as it is very hard to calculate such numbers.
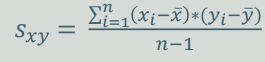
Sample Covariance formula:
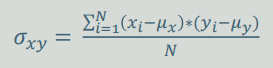
Population Covariance formula:
Covariance Example:
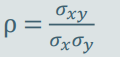
Correlation: Correlation is a measure of the joint variability of two variables. Unlike covariance, it takes on values between -1 and 1, thus it is easy for us to interpret the result.
A correlation of 1 is known as perfect positive correlation which means that one variable is perfectly explained by the other.
A correlation of 0 means that the variables are independent.
A correlation of -1, is known as perfect negative correlation which means that one variable is explaining the other one perfectly, but they move in opposite directions.
Sample correlation formula

Population correlation formula
Correlation Example:
Python Code for Covariance and Correlation:
Conclusion: In this blog, we learn how to do python coding for variability measures of statistics. If you have any questions, please post them in the comment section.


