avatarArpita Ghosh

Free AI web copilot to create summaries, insights and extended knowledge, download it at here

2412

Abstract

lowfullscreen="" frameborder="0" height="480" width="854"> </div> </div> </figure></iframe></div></div></figure><p id="0872"><b>Median: </b>The median is the midpoint of the ordered dataset. . It is not affected by outliers. In an ordered dataset, the median is the number at position (n+1)/2. Here n is number of observations. If this position is not a whole number, then the median is the simple average of the two numbers at positions closest to the calculated value.</p><p id="fd72"><b>Median Example: </b>If we consider the above data set, let’s find out median.</p> <figure id="b5e6"> <div> <div> <img class="ratio" src="http://placehold.it/16x9"> <iframe class="" src="https://cdn.embedly.com/widgets/media.html?src=https%3A%2F%2Fwww.youtube.com%2Fembed%2Fi5XmF2tGC9o%3Ffeature%3Doembed%26start%3D224%26end%3D274&amp;display_name=YouTube&amp;url=https%3A%2F%2Fwww.youtube.com%2Fwatch%3Fv%3Di5XmF2tGC9o&amp;image=https%3A%2F%2Fi.ytimg.com%2Fvi%2Fi5XmF2tGC9o%2Fhqdefault.jpg&amp;key=a19fcc184b9711e1b4764040d3dc5c07&amp;type=text%2Fhtml&amp;schema=youtube" allowfullscreen="" frameborder="0" height="480" width="854"> </div> </div> </figure></iframe></div></div></figure><p id="ed65"><b>Mode: </b>In a data set, the mode is the value which occurs most often. A dataset can have 0 modes, 1 mode or multiple modes. Normally, the mode is calculated by finding the value with the highest frequency.</p><p id="0b73"><b>Mode Example:</b></p> <figure id="770f"> <div> <div> <img class="ratio" src="http://placehold.it/16x9"> <iframe class="" src="https://cdn.embedly.com/widgets/media.html?src=https%3A%2F%2Fwww.youtube.com%2Fembed%2Fi5XmF2tGC9o%3Ffeature%3Doembed%26start%3D289%26end%3D315&amp;display_name=YouTube&amp;url=https%3A%2F%2Fwww.youtube.com%2Fwatch%3Fv%3Di5XmF2tGC9o&amp;image=https%3A%2F%2Fi.ytimg.com%2Fvi%2Fi5XmF2tGC9o%2Fhqdefault.jpg&amp;key=a19fcc184b9711e1b4764040d3dc5c07&amp;type=text%2Fhtml&amp;schema=youtube" allowfullscreen="" frameborder="0" height="480" width="854"> </div> </div> </figure></iframe></div></div></figure><p id="bd9d"><b>Python Coding for Central Tendency Measures</b></p> <figure id="938a"> <div> <div>

Options

            <img class="ratio" src="http://placehold.it/16x9">
            <iframe class="" src="https://cdn.embedly.com/widgets/media.html?src=https%3A%2F%2Fwww.youtube.com%2Fembed%2Fi5XmF2tGC9o%3Ffeature%3Doembed%26start%3D316%26end%3D377&amp;display_name=YouTube&amp;url=https%3A%2F%2Fwww.youtube.com%2Fwatch%3Fv%3Di5XmF2tGC9o&amp;image=https%3A%2F%2Fi.ytimg.com%2Fvi%2Fi5XmF2tGC9o%2Fhqdefault.jpg&amp;key=a19fcc184b9711e1b4764040d3dc5c07&amp;type=text%2Fhtml&amp;schema=youtube" allowfullscreen="" frameborder="0" height="480" width="854">
          </div>
        </div>
    </figure></iframe></div></div></figure><p id="27af">Now it is time for measuring <b>asymmetry</b> for a data set. For this context, we need to understand skewness of a data set.</p><p id="aa6e"><b>Skewness: </b>Skewness is a measure of asymmetry. It indicates the observations in a dataset are concentrated on which side.</p><figure id="89bb"><img src="https://cdn-images-1.readmedium.com/v2/resize:fit:800/1*pWpVU-GdiaHKHyfxFK2MyQ.png"><figcaption>Image by Author</figcaption></figure><p id="06cb">The above graph has right (positive)skewness. It means that the outliers are to the right (long tail to the right). Left (negative) skewness means that the outliers are to the left.</p><p id="929b">Normally, using different software, skewness is calculated. Formula of skewness is</p><figure id="e257"><img src="https://cdn-images-1.readmedium.com/v2/resize:fit:800/1*9HpqrX5vQUgg7tyjcKOw7A.png"><figcaption>Image by Author</figcaption></figure><p id="4b81"><b>Python Coding for Skewness</b></p>
    <figure id="07fb">
        <div>
          <div>
            <img class="ratio" src="http://placehold.it/16x9">
            <iframe class="" src="https://cdn.embedly.com/widgets/media.html?src=https%3A%2F%2Fwww.youtube.com%2Fembed%2Fi5XmF2tGC9o%3Ffeature%3Doembed%26start%3D461%26end%3D501&amp;display_name=YouTube&amp;url=https%3A%2F%2Fwww.youtube.com%2Fwatch%3Fv%3Di5XmF2tGC9o&amp;image=https%3A%2F%2Fi.ytimg.com%2Fvi%2Fi5XmF2tGC9o%2Fhqdefault.jpg&amp;key=a19fcc184b9711e1b4764040d3dc5c07&amp;type=text%2Fhtml&amp;schema=youtube" allowfullscreen="" frameborder="0" height="480" width="854">
          </div>
        </div>
    </figure></iframe></div></div></figure><p id="7038">Conclusion: In my next blog we will learn about variability with python coding.</p></article></body>

How to Calculate Central Tendency and Asymmetry measures in Statistics and Python

Image by Author

In this blog, I am going to talk about Central Tendency, asymmetry and variability with hands on using Python. If you miss my previous blog about Descriptive Statistics with Python, please go to the below link.https://readmedium.com/descriptive-statistics-with-python-part-1-9f34e48abc05

What is Central Tendency? : In statistics, a central tendency is a central or typical value for a probability distribution.

Purpose of Central Tendency: It is a single value which is the representative of an entire distributed data. There are three main measures in central tendency, mean, median and mode.

Now we are going to in detail to know about these measures.

Mean: Mean is mostly used for measuring central tendency. It is a simple average of whole data set. Formula of calculating mean of a data set is

(𝑥1 + 𝑥2 + 𝑥3 + ⋯ + 𝑥𝑁−1 + 𝑥𝑁 ) /N

Where 𝑥1, 𝑥2 , 𝑥3 , ⋯ ,𝑥𝑁−1 , 𝑥𝑁 => r Data values , N = Total number of sample data.
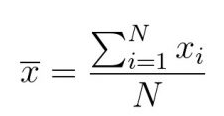
Image by Author

For population data, it is denoted as μ and for sample data x bar (symbol shown in above image)

Note: Mean is easily affected by outliers.

Mean Example: Find out Mean explanation with some example.

Median: The median is the midpoint of the ordered dataset. . It is not affected by outliers. In an ordered dataset, the median is the number at position (n+1)/2. Here n is number of observations. If this position is not a whole number, then the median is the simple average of the two numbers at positions closest to the calculated value.

Median Example: If we consider the above data set, let’s find out median.

Mode: In a data set, the mode is the value which occurs most often. A dataset can have 0 modes, 1 mode or multiple modes. Normally, the mode is calculated by finding the value with the highest frequency.

Mode Example:

Python Coding for Central Tendency Measures

Now it is time for measuring asymmetry for a data set. For this context, we need to understand skewness of a data set.

Skewness: Skewness is a measure of asymmetry. It indicates the observations in a dataset are concentrated on which side.
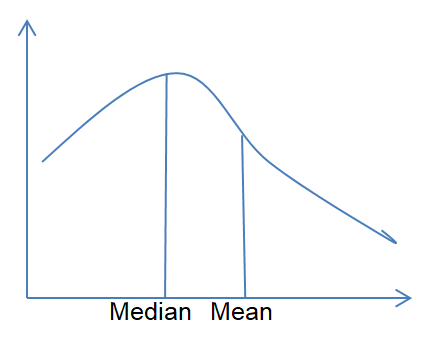
Image by Author

The above graph has right (positive)skewness. It means that the outliers are to the right (long tail to the right). Left (negative) skewness means that the outliers are to the left.

Normally, using different software, skewness is calculated. Formula of skewness is
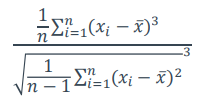
Image by Author

Python Coding for Skewness

Conclusion: In my next blog we will learn about variability with python coding.

Statistics
Central Tendency
Data Science
Machine Learning
Python
Recommended from ReadMedium