avatarArpita Ghosh

Free AI web copilot to create summaries, insights and extended knowledge, download it at here

3001

Abstract

"</span>,<span class="hljs-string">"Banana"</span>,<span class="hljs-string">"Orange"</span>] cate_list Output: [<span class="hljs-string">'Apple'</span>, <span class="hljs-string">'Banana'</span>, <span class="hljs-string">'Orange'</span>] cate_dict={<span class="hljs-number">1</span>:<span class="hljs-string">"Apple"</span>,<span class="hljs-number">2</span>:<span class="hljs-string">"Banana"</span>,<span class="hljs-number">3</span>:<span class="hljs-string">"Orange"</span>} cate_dict Output: {<span class="hljs-number">1</span>: <span class="hljs-string">'Apple'</span>, <span class="hljs-number">2</span>: <span class="hljs-string">'Banana'</span>, <span class="hljs-number">3</span>: <span class="hljs-string">'Orange'</span>} num_list=[<span class="hljs-number">1</span>,<span class="hljs-number">2</span>,<span class="hljs-number">6</span>,<span class="hljs-number">7</span>,<span class="hljs-number">4</span>] num_list Output: [<span class="hljs-number">1</span>, <span class="hljs-number">2</span>, <span class="hljs-number">6</span>, <span class="hljs-number">7</span>, <span class="hljs-number">4</span>] <span class="hljs-built_in">print</span>(np.random.rand(<span class="hljs-number">5</span>)) <span class="hljs-built_in">print</span>(np.random.randint(<span class="hljs-number">1</span>,<span class="hljs-number">16</span>,<span class="hljs-number">10</span>)) <span class="hljs-comment"># Type of Numerical data : Discrete and Continuous. Age is discrete #data, Month is continuous data.</span> <span class="hljs-comment"># Convert dictionary to data frame </span> data={<span class="hljs-string">'Age'</span>: [<span class="hljs-number">20</span>,<span class="hljs-number">25</span>,<span class="hljs-number">20</span>,<span class="hljs-number">35</span>,<span class="hljs-number">40</span>,<span class="hljs-number">45</span>,<span class="hljs-number">50</span>,<span class="hljs-number">55</span>,<span class="hljs-number">60</span>,<span class="hljs-number">65</span>,<span class="hljs-number">70</span>,<span class="hljs-number">75</span>],<span class="hljs-string">'Month'</span>:[<span class="hljs-number">1</span>,<span class="hljs-number">2</span>,<span class="hljs-number">3</span>,<span class="hljs-number">4</span>,<span class="hljs-number">5</span>,<span class="hljs-number">6</span>,<span class="hljs-number">7</span>,<span class="hljs-number">8</span>,<span class="hljs-number">9</span>,<span class="hljs-number">10</span>,<span class="hljs-number">11</span>,<span class="hljs-number">12</span>]} df1=pd.DataFrame.from_dict(data) df1</pre></div><p id="f422"><b>Levels of Measurement </b>There are two types of levels of measurement, Qualitative and Quantitative. Two qualitative levels: nominal and ordinal. There are two quantitative levels: interval and ratio.</p><figure id="0168"><img src="https://cdn-images-1.readmedium.com/v2/resize:fit:800/0*1yXd_wi125UppBnI"><figcaption>Image by Author</figcaption></figure><figure id="fa15"><img src="https:

Options

//cdn-images-1.readmedium.com/v2/resize:fit:800/0*sGsOj6LbOTX5s_i4"><figcaption>Image by Author</figcaption></figure><div id="42f5"><pre><span class="hljs-comment"># Nominal Data </span> nominal_dict={<span class="hljs-string">'Gender'</span>: [<span class="hljs-string">'Female'</span>,<span class="hljs-string">'Male'</span>],<span class="hljs-string">'Hair_Color'</span>: [<span class="hljs-string">'Black'</span>,<span class="hljs-string">'White'</span>]} <span class="hljs-attribute">df2</span>=pd.DataFrame.from_dict(nominal_dict) df2 Output: Gender Hair_Color 0 Female Black 1 Male White</pre></div><div id="8a41"><pre><span class="hljs-comment"># Ordinal Data </span> ordinal_dict={<span class="hljs-string">'Rating'</span>: [<span class="hljs-string">'Satified'</span>,<span class="hljs-string">'Avg Satisfied'</span>,<span class="hljs-string">'Not Satisfied'</span>]} <span class="hljs-attribute">df3</span>=pd.DataFrame.from_dict(ordinal_dict) df3 Output: Rating 0 Satified 1 Avg Satisfied 2 <span class="hljs-keyword">Not</span> Satisfied</pre></div><div id="628f"><pre><span class="hljs-comment">#Interval Data </span> <span class="hljs-attribute">interval_data</span>={'Income':[<span class="hljs-number">25000</span>,<span class="hljs-number">30000</span>,<span class="hljs-number">40000</span>]} df4=pd.DataFrame.from_dict(interval_data) <span class="hljs-attribute">df4</span> <span class="hljs-attribute">Output</span>: <span class="hljs-attribute">Income</span> <span class="hljs-attribute">0</span> <span class="hljs-number">25000</span> <span class="hljs-attribute">1</span> <span class="hljs-number">30000</span> <span class="hljs-attribute">2</span> <span class="hljs-number">40000</span> <span class="hljs-comment"># Ratio Data : measurement of heights. </span> <span class="hljs-attribute">ratio_data</span>={'Height':[<span class="hljs-number">160</span>,<span class="hljs-number">167</span>,<span class="hljs-number">170</span>]} df5=pd.DataFrame.from_dict(ratio_data) <span class="hljs-attribute">df5</span> <span class="hljs-attribute">Output</span>: <span class="hljs-attribute">Height</span> <span class="hljs-attribute">0</span> <span class="hljs-number">160</span> <span class="hljs-attribute">1</span> <span class="hljs-number">167</span> <span class="hljs-attribute">2</span> <span class="hljs-number">170</span></pre></div><p id="062f">Conclusion : Till now we talked about different types of variables, in next blog, will discuss about <b>Central Tendency (end part of descriptive statistics) with Pythons</b>.</p><figure id="3790"><img src="https://cdn-images-1.readmedium.com/v2/resize:fit:800/0*dm0kPQeH4ZVWNoTd"><figcaption></figcaption></figure><p id="bc9a"><i>Originally published at <a href="https://arpitatechcorner.wordpress.com/2020/11/23/descriptive-statistics-with-python-part-1/">http://arpitatechcorner.wordpress.com</a> on November 23, 2020.</i></p></article></body>

Descriptive Statistics with Python: Part 1
Image by Author

Introduction: To learn about data science or machine learning , it is basic necessity to know about statistics. Nowadays if anybody is attending data science or data analyst interview , it is obvious to face some questions related to statistics. If someone is new to data science world, it is very difficult for him/her to relate statistical application using python code.

In this blog I wrote python code with key notes related to descriptive statistics.

What is Statistics? To know about , we first know about to term . Population and Sample. Population is total data set collected for analysis , denoted as N. Sample is subset of population, denoted as n. Statistics is mathematical analysis and representation about this sample data. Parameter is the mathematical representation of population data.

For example, one company wants to conduct a survey on employee satisfaction for the entire company. You were tasked with contacting your project members about their opinion and then submitting them to the HR manager. Is it population or sample data? What should be the name of this presented value?

Answer: It is Sample data and presented value is called Statistics. Because you took only one project members’ data which is a small part of whole company data.

Types of Data Now we have to understand how many types of data are there. There are two types of data, categorical and numerical. Numerical data is divided into discrete and continuous.
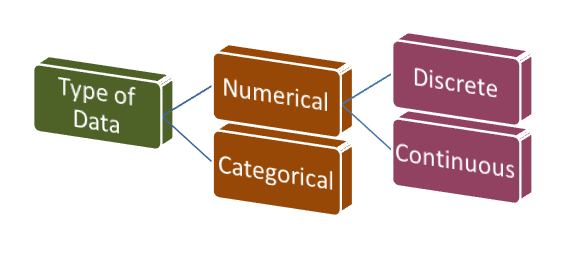
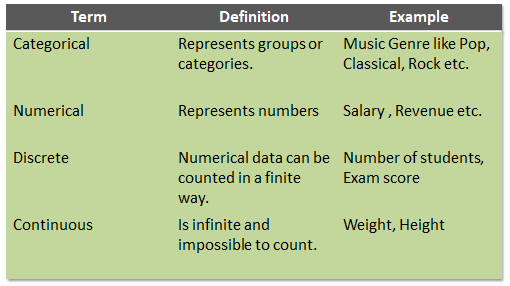
Image by Author
Image by Author

Now let’s start with python coding.

#Declare all required packages in jupyter notebook
import pandas as pd
import numpy as np
import matplotlib.pyplot as plt
import seaborn as sns 
%matplotlib inline
from matplotlib.ticker 
import PercentFormatter
# Type of Data : Categorical and Numerical  
cate_list=["Apple","Banana","Orange"] 
cate_list 
Output: ['Apple', 'Banana', 'Orange'] 
cate_dict={1:"Apple",2:"Banana",3:"Orange"} 
cate_dict 
Output: {1: 'Apple', 2: 'Banana', 3: 'Orange'} 
num_list=[1,2,6,7,4] 
num_list 
Output: [1, 2, 6, 7, 4] 
print(np.random.rand(5)) 
print(np.random.randint(1,16,10))
# Type of Numerical data : Discrete and Continuous. Age is discrete #data, Month is continuous data.
# Convert dictionary to data frame 
data={'Age': [20,25,20,35,40,45,50,55,60,65,70,75],'Month':[1,2,3,4,5,6,7,8,9,10,11,12]} 
df1=pd.DataFrame.from_dict(data) 
df1

Levels of Measurement There are two types of levels of measurement, Qualitative and Quantitative. Two qualitative levels: nominal and ordinal. There are two quantitative levels: interval and ratio.
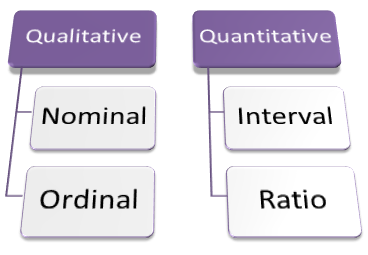
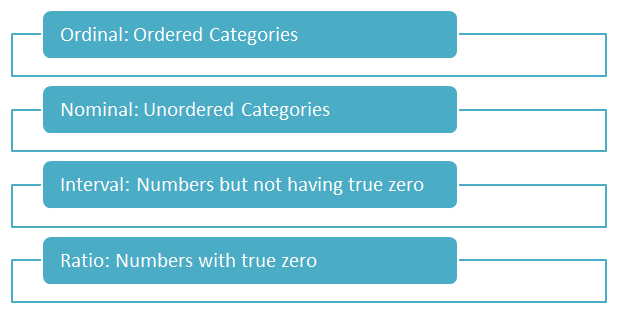
Image by Author
Image by Author
# Nominal Data  
nominal_dict={'Gender': ['Female','Male'],'Hair_Color': ['Black','White']} 
df2=pd.DataFrame.from_dict(nominal_dict) 
df2 
Output:
     Gender  Hair_Color
 0    Female  Black
 1    Male    White
# Ordinal Data 
ordinal_dict={'Rating': ['Satified','Avg Satisfied','Not Satisfied']} 
df3=pd.DataFrame.from_dict(ordinal_dict) 
df3 
Output:
       Rating
 0    Satified
 1    Avg Satisfied
 2    Not Satisfied
#Interval Data  
interval_data={'Income':[25000,30000,40000]} df4=pd.DataFrame.from_dict(interval_data) 
df4 
Output:
      Income
 0    25000
 1    30000
 2    40000
# Ratio Data : measurement of heights.  
ratio_data={'Height':[160,167,170]} df5=pd.DataFrame.from_dict(ratio_data) 
df5 
Output:
    Height
 0    160
 1    167
 2    170

Conclusion : Till now we talked about different types of variables, in next blog, will discuss about Central Tendency (end part of descriptive statistics) with Pythons.

Originally published at http://arpitatechcorner.wordpress.com on November 23, 2020.

Statistics
Data Science
Python
Women In Data Science
Recommended from ReadMedium