avatarScott Hughey (TheWriteScott)

Free AI web copilot to create summaries, insights and extended knowledge, download it at here

3969

Abstract

lors, and no axes by default, streamlining the process of plotting vector data. If needed, you can easily customize the appearance using gspatial_plot, Geopandas, or Matplotlib parameters.</p><div id="7f83"><pre>gsp<span class="hljs-selector-class">.shapeplot</span>(usa, figsize=(<span class="hljs-number">15</span>, <span class="hljs-number">15</span>))</pre></div><figure id="5a4f"><img src="https://cdn-images-1.readmedium.com/v2/resize:fit:800/1*hgepISp4blKLRyoMFCcqAg.png"><figcaption></figcaption></figure><p id="970d">You also have the option to adjust the parameters according to your needs. For instance, let’s incorporate a title into the visualization:</p><div id="b7f0"><pre>gsp.shapeplot( usa, title=<span class="hljs-string">"USA MAP"</span>, title_kwds={<span class="hljs-string">"fontsize"</span>: 25, <span class="hljs-string">"fontname"</span>: <span class="hljs-string">"sans-serif"</span>, <span class="hljs-string">"fontweight"</span>: 3}, )</pre></div><figure id="4438"><img src="https://cdn-images-1.readmedium.com/v2/resize:fit:800/1*mIWUUXOP3u1uiZXQs_N2Lg.png"><figcaption></figcaption></figure><p id="1dc8"><b>Here’s the explanation of the shapeplot function’s parameters:</b></p><p id="7d22">• data (GeoDataFrame): GeoDataFrame used as the data source for the map. • title (str): Title displayed on the map. Default is None. • title_kwds (dict): Keyword arguments for configuring title appearance using matplotlib.pyplot.title. Default is an empty dictionary. • figsize (tuple): Dimensions of the figure. Default is (15, 15). • facecolor (str): Background color of the figure. Default is “white”. • edgecolor (str): Color of the map’s edges. Default is “black”. • linewidth (float): Line width for shapes. Default is 0.5. • color (str): Color of the shape. Default is “#F1F3F4”. • annot (bool): Toggle annotations on/off. Default is False. • annot_column (str/GeoDataFrame column): Source column for annotations. Default is None. • annot_align (str): Text alignment for annotations. Default is “center”. • annot_kwds (dict): Keyword arguments for customizing annotations. Default is an empty dictionary. • ax (matplotlib axis): Existing axis for plotting, if needed. Default is None. • axis_on (bool): Toggle axis visibility. Default is False. • **geopandas_plot_kwds: Additional keyword arguments for Geopandas plot customization.</p><p id="5a62">Returns: Matplotlib axis object (ax) representing the map.</p><p id="39a4">This function enables straightforward GeoDataFrame shape plotting with customizable options for appearance and annotations, while allowing flexibility in using existing axes for plotting. The function returns a matplotlib axis object representing the generated map.</p><h1 id="7308">pointplot</h1><p id="e010">Point plot is designed specifically for visualizing point data. A key distinction between point plot and shapeplot lies in the ability to utilize a base vector layer of shapes. This base layer allows points to be plotted on top, enabling a layered representation.</p><div id="62be"><pre>usa_points = usa.representative_point() gsp.pointplot(usa_points, <span class="hljs-keyword">base</span>=usa)</pre></div><figure id="e5d7"><img src="https://cdn-images-1.readmedium.com/v2/resize:fit:800/1*ZOiYi_T2DL9CU9Kx7-KpGA.png"><figcaption></figcaption></figure><p id="6b86">Alternatively, you have the option to plot the polygons themselves instead of just their boundaries in the base layer.</p><div id="aac0"><pre>gsp.pointplot(usa_points, <span class="hljs-keyword">base</span>=usa, base_boundary=False)</pre></div><figure id="3412"><img src="https://cdn-images-1.readmedium.com/v2/resize:fit:800/1*_Sz_IGkazfobhvTpV3Y8Ag.png"><figcaption></figcaption></figure><p id="8f2e">Points can be plotted independently, without the need for a base layer.</p><div id="30aa"><pre>gsp<span class="hljs-selector-class">.pointplot</span>(usa_points)</pre></div><figure id="d8ed"><img src="https://cdn

Options

-images-1.readmedium.com/v2/resize:fit:800/1*zFOL9eUsmS-5S67MeufNcQ.png"><figcaption></figcaption></figure><p id="5c42">Matplotlib axis objects offer the ability to merge and combine multiple plots.</p><div id="4753"><pre>ax = gsp.shapeplot(usa, figsize=(<span class="hljs-number">15</span>, <span class="hljs-number">15</span>)) gsp.pointplot(usa_points, ax=ax)</pre></div><figure id="f05f"><img src="https://cdn-images-1.readmedium.com/v2/resize:fit:800/1*_Sz_IGkazfobhvTpV3Y8Ag.png"><figcaption></figcaption></figure><p id="b9e0">It’s also possible to tailor the appearance of the base layer according to your preferences.</p><div id="3dfa"><pre>gsp.pointplot( usa_points, base=usa, basecolor=<span class="hljs-string">"#7aebff"</span>, base_boundary=<span class="hljs-literal">False</span>, title=<span class="hljs-string">"USA Points"</span>, title_kwds={<span class="hljs-string">"fontsize"</span>: <span class="hljs-number">25</span>, <span class="hljs-string">"fontname"</span>: <span class="hljs-string">"sans-serif"</span>, <span class="hljs-string">"fontweight"</span>: <span class="hljs-number">3</span>}, )</pre></div><figure id="ce5a"><img src="https://cdn-images-1.readmedium.com/v2/resize:fit:800/1*AiPv5roDBIrvCc92oIvZ4g.png"><figcaption></figcaption></figure><p id="3d19"><b>Here’s the breakdown of the pointplot function’s parameters:</b></p><p id="a875">• data (GeoDataFrame): The GeoDataFrame used for plotting the map. • base (GeoDataFrame): Base GeoDataFrame on top of which the data will be plotted. Defaults to None. • title (str): Title of the map. Defaults to None. • title_kwds (dict): Keyword arguments for configuring the appearance of the title using matplotlib.pyplot.title. Defaults to an empty dictionary. • figsize (tuple): Size of the figure. Defaults to (15, 15). • color (str): Color of the point. Defaults to “#ffb536”. • edgecolor (str): Color of the map’s edges. Defaults to “black”. • basecolor (str): Color of the base data. Defaults to “#F1F3F4”. • baseboundarycolor (str): Boundary color of the base data. Defaults to “black”. • base_boundary (bool): Toggle visibility of base data boundaries. Defaults to True. • boundary_linewidth (float): Linewidth of the base data boundaries. Defaults to 0.5. • linewidth (float): Width of lines for shapes. Defaults to 0.5. • annot (bool): If True, annotations are generated. Defaults to False. • annot_column (str/GeoDataFrame column): If annot is True, column should be passed as the source for annotation. Defaults to None. • annot_align (str): Text alignment for annotations. Defaults to “center”. • annot_kwds (dict): Keyword arguments for annotation customization. Defaults to an empty dictionary. • ax (matplotlib axis): Existing axis for plotting. Defaults to None. • axis_on (bool): Toggle axis visibility. Defaults to False. • facecolor (str): Figure’s face color. Defaults to “white”. • **geopandas_plot_kwds: Additional Geopandas plot keyword arguments.</p><p id="fd44">Returns: Matplotlib axis object (ax).</p><h1 id="44de">Tips for Polished Maps</h1><p id="46bb"><b>Harmonious Color Choices:</b> Experiment with color palettes to create maps that are visually pleasing and easy to understand. Choose colors that enhance the readability of your map.</p><p id="6be4"><b>Precise Annotations:</b> Annotations provide context to your maps. Customize annotation alignment and appearance to guide viewers through your spatial narrative seamlessly.</p><p id="b235"><b>Seamless Matplotlib Integration:</b> Leverage the integration with Matplotlib to fine-tune your maps’ aesthetics, titles, and labels for a polished final product.</p><h1 id="071e">Conclusion</h1><p id="3df6">In this tutorial, we’ve covered the essentials of crafting geospatial maps using the gspatial_plot library. With gspatial_plot, the process of geospatial mapping becomes more manageable and easy. See you in the next tutorial— happy mapping!</p></article></body>

A Complete Collection

How I Made $0.35 On 1 Story And Why It’s Thrilling

Making 35X My Goal

Image by Canva Pro and Scott Hughey

I’ve only written on Medium for two months, but I’ve met all my goals so far.

Soon, I’ll write the mandatory article about those specific goals. You're apparently not allowed to achieve milestones without a self-congratulatory piece. It’s in the terms of service somewhere, I bet. (Far be it from me to break that trend.)

However, today’s topic is that a few days ago, I acknowledged an unspoken goal and immediately made it happen with some help from a writer's network.

I wanted to earn money on every eligible story.

Like so many in my early days, I had a lot to learn about writing on this platform. And let’s face it, I’m about to pass 1.5 months.

  • It’s still early days for me.
  • I still have a lot to learn.

One great thing about Medium is the ability to practice in real-time. I write articles. I get to see how they perform, both short and long-term. Armed with that data and seeing how other successful writers operate, I adjust and refine.

It’s like a video game. It’s fun.

Like everyone here, or so I imagine, I have stories that have only earned pennies. That’s okay. I’m going to get better. Like when I learned to combine SEO with fine-tuned titles, images, and prose. And you know what?

I’m still going to have articles that only earn pennies.

You can’t predict which writings will take off. Often, they’re not the ones you believe will do so.

But, the more we write, the more we can understand (after the fact) which factors contributed to higher earners and which ones kept less productive stories from being read.

This leads me to the one article.

The $0.00 article.

You don’t have to read it, but it’s here if you’re interested in language learning.

I realized that it was my only article that hadn’t made a single cent. After this zero article, my worst earning one has only made $0.05. And I was okay with that.

But this… blemish on my record?

I don’t think I have the type of OCD that helps around the house.

My clothes don’t have to be ironed just right, and my work desk is a travesty. I’m unorganized. True story: my wife’s been out of town for over a week, and while the place isn’t a pigsty, I’ve got a lot of cleaning to catch up on before she returns.

But, touch me on one side of the body (say my left shoulder) and I have to touch the other side. It has to be symmetrical. In case you’re wondering, yes, it makes for great fun in the bedroom. That’s one form of OCD I may have.

And this $0.00? It irked me. It was another one.

I wrote the $0.00 story before I had a better handle of writing titles or refining SEO. My formatting in those early days (over a month ago, that’s ancient!) wasn’t superb.

So I leapt into action:

  • I tweaked the SEO settings.
  • I gave it a better title and subtitle.
  • I rewrote the beginning to get readers into the story right away.

And you know what happened?

Nothing.

Since the article is about language, I’ll amend that to nada.

$0.00.

Writers Network and Medium Engagement

I’ve learned from several sources that connecting with other writers can help promote your work. The source I finally took to heart was Christopher Kokoski.

Christopher is going to think I’m stalking him. Seriously. This is maybe the third or fourth article I’ve tagged him in.

But I remember exactly where I was, in a doctor’s waiting room waiting on my daughter, when I came across three of his articles on how many gazillion dollars (I forget the exact amount) he’d made on Medium in such a short time.

One specific piece of advice he gave was joining Facebook groups to connect to other Medium writers.

I did so, grudgingly. Facebook is not my favorite media platform. (Before discovering Medium, it was Quora.)

Through there, I connected with other writers, including Courtney Burry and Deborah Weir. They’re important to the story because they became editors on my first publication, Open Letters To. That’s important because, through our ongoing dialogue, Deborah decided to start her own Facebook group: Medium Engagement.

It’s an intentionally small group. Much like Medium did recently, this group decided not to focus on claps but actual reading. We read each other's work. We comment on it. We give advice. It’s awesome-sauce.

It was perfect.

I told them I needed help. I just wanted to make $0.01 on that article so I could say every article had made money.

I also posted it in another group, and for the life of me, I can’t find the post. Aigner Loren Wilson read it there, and I was very grateful. I’m not sure if anyone else there did. Sorry. I don’t even remember which group it was, and it’s too far down my notifications now.

Between Aigner and the Medium Engagement group, I finally got some views and reads.

The Results: An Astonishing $0.35 and GROWING!?

Medium gives a share of its member’s fees to the writers they read, based on a complicated reading time formula.

I’m not going to break it down because while I understand the basics, I doubt anybody outside of Medium knows exactly how it works.

I assumed, wrongly as it turned out, that I’d need somewhere between 15–30 minutes of reading time to make a cent. This was wild conjecture based on the presumption that most writers in these groups read a lot of articles.

I know I do. I sometimes wonder if I “give away” my $5 or so within the first 1–3 days of each month. I feel bad sometimes for the writers I discover later in the month.

Here’s what happened.

Image Screenshot by Scott Hughey (Author)

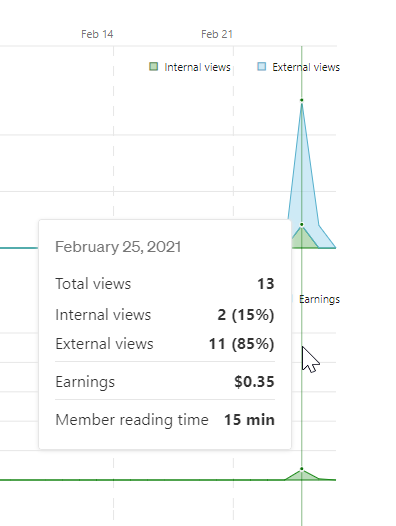
I received 13 views that day. 11 were external. The two internal ones were particularly interesting. The views from Facebook helped in some way because that article wasn’t getting internal views before.

Here, I’ll show you.

Image Screenshot by Scott Hughey (Author)

The article received one internal view the day it was published. Somehow, it also got one external view later on. That might have been when I adjusted the SEO settings.

And then, with my plea to the writer’s group, I tripled the internal views.

It’s not nothing.

Neither were my earnings, finally!

I seriously would have been happy with one cent.

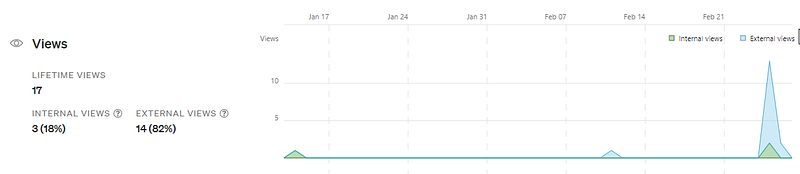
Those fifteen minutes resulted in $0.35! Not only that, but today, it received two more external views, one minute of reading time, and four more cents.

I’m actually up to $0.39. That’s four cents more than when I started writing this article.

About two weeks ago, I wrote about how I may have sabotaged my best-performing article’s earnings. Perhaps now, I’ve done the opposite with my least-performing one.

Food for thought.

Take-aways:

  1. Continue to improve based on everything you learn.
  2. Connect with other supportive writers.
  3. When you have to do so, don’t be above begging.

Happy writing and connecting!

Scott Hughey would like to point out that while he may have done the begging thing, it was a most dignified begging. Honest.

Medium
Publishing
Writing Tips
Writing
Productivity
Recommended from ReadMedium