
How I improved my score on Kaggle’s House Price competition using advanced regression techniques

In my last post I discussed how to improve the score on Kaggle’s Titanic competition by utilising advanced classification techniques. The link to this post can be found here:-https://readmedium.com/how-i-improved-my-score-on-kaggles-titanic-competition-by-using-advanced-classification-techniques-a2f5f63f7194
In this post I intend to improve the score on Kaggle’s House Price competition by using advanced regression techniques. The techniques I tend to employ are a little different from those I used in my last post, so it is therefore important to read the post to the very end to find out what those differences are.
The link to the Kaggle House Price competition can be found here:- https://www.kaggle.com/c/house-prices-advanced-regression-techniques
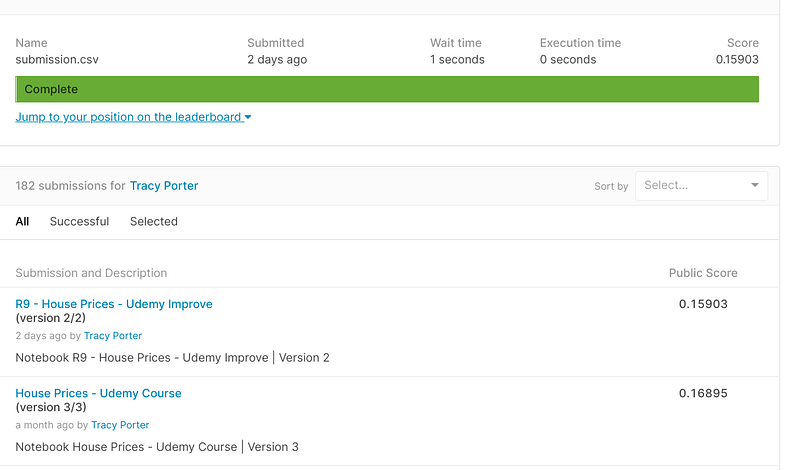
As can be seen from the screenshot below, I was able to improve the score on Kaggle’s House Prices competition over 1 point by employing a few advanced regression techniques, to include imputation, scaling, removing outliers, feature selection, model selection, parameter tuning, and ensembles:-
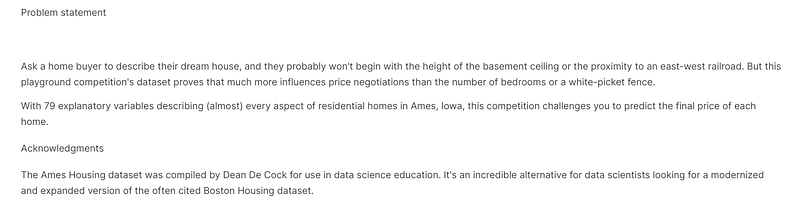
I created the program in Kaggle’s free online Jupyter Notebook and stored it in the House Price repository. The problem statement for the House Price competition can be seen below:-
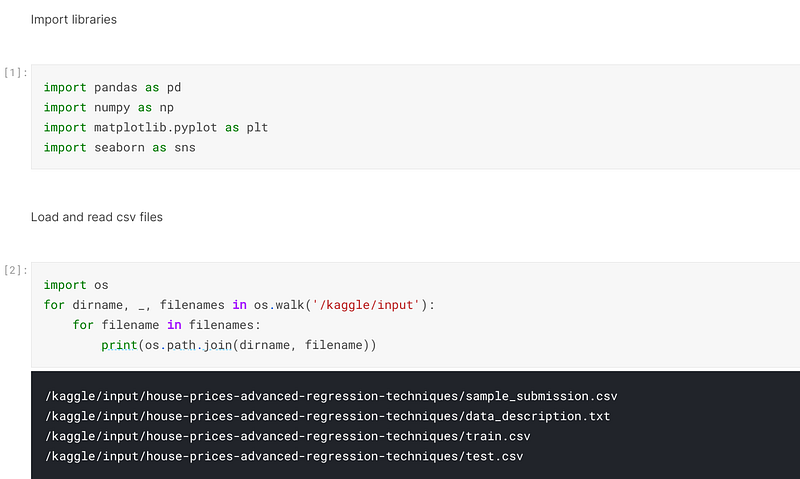
Once I created the program in the Jupyter Notebook, I imported the libraries that I would need to execute the program. I generally only import libraries as I need them, so on this occasion I imported pandas, numpy, sklearn, matplotlib and seaborn. Pandas creates and manipulates dataframes, numpy creates arrays and carries out algebraic computations, sklearn houses the copious machine learning functions, and matplotlib and seaborn are graphics libraries that plot the various data points.
I then used the os library to go into the operating system and retrieve the csv files that would be used in the program:-
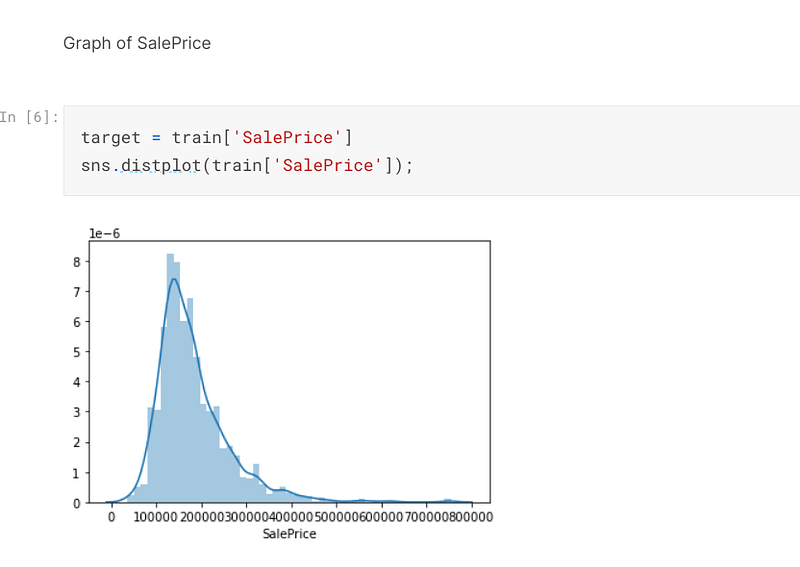
I defined the variable, target, which is composed of the sale price of the properties.
I then used seaborn to plot the sale price of the properties:-
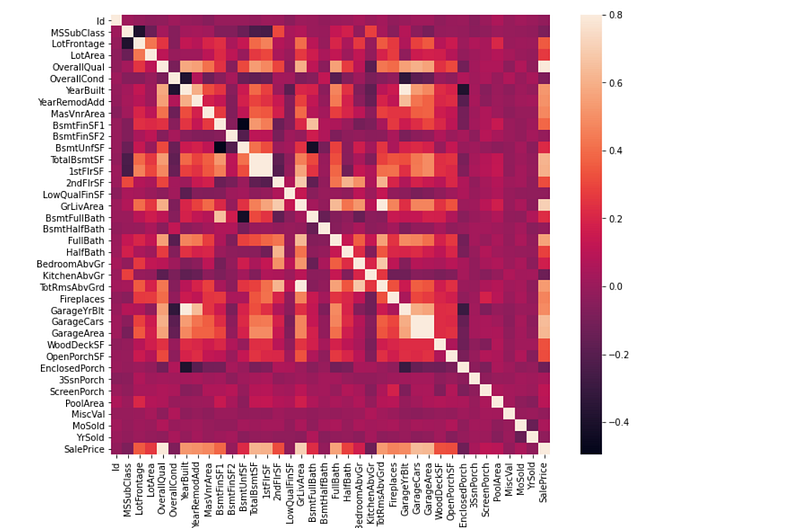
I then created a heatmap, which reveals the correlation that all of the numerical features have to each other:-
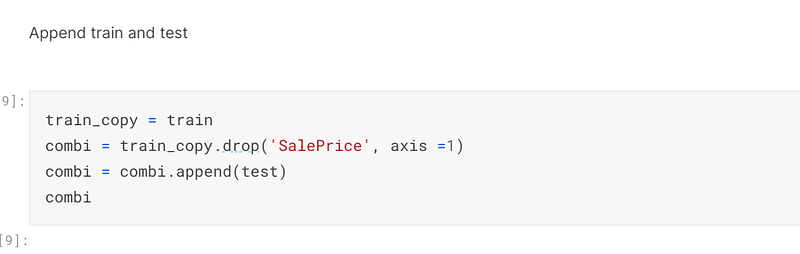
I dropped the column, ‘SalePrice’, from a copy of the train file and then appended the test file to that file to create the file, combi, which will be used as the basis to make predictions on:-
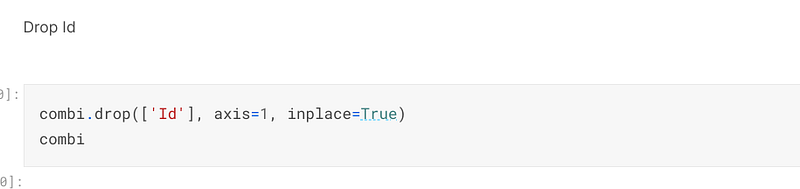
I then dropped the column, ‘Id’, from combi because it is not necessary to make predictions on the data:-
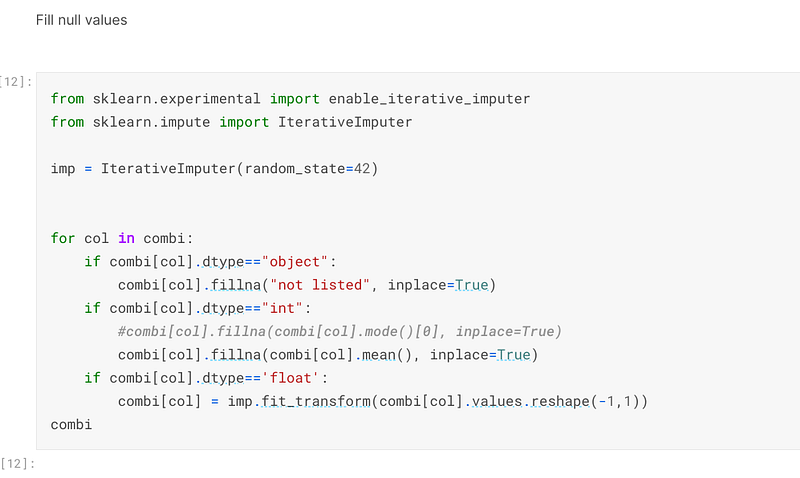
The first advanced regression technique I employed was to use a for loop to impute all of the missing values in the dataset, being objects, integers, or floats. The floats were imputed using sklearn’s IterativeImputer, which as an experimental function:-
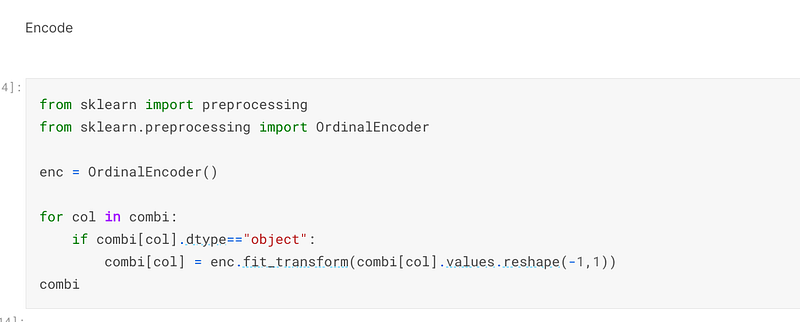
Once the missing values had been imputed, I used sklearn’s OrdinalEncoder to encode all of the features that were data type object:-
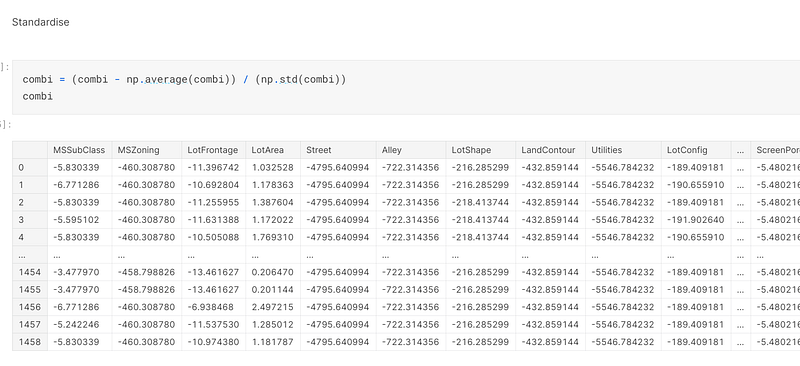
The second advanced regression technique that I employed was to standardise the data, to ensure all of the data points were in close proximity to each other so it will be easier for the model to make predictions on it:-
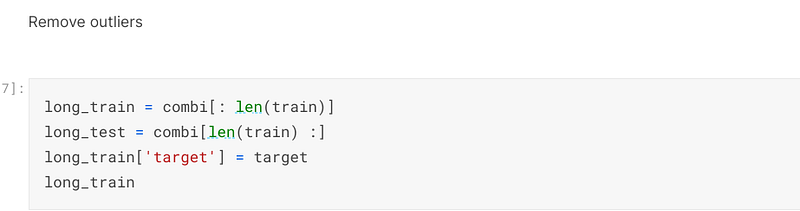
The third advanced regression technique I used was to remove the outliers from the training set. I initially accomplished this by creating the variables of long_train and long_target to keep the train and test datasets separate from each other:-
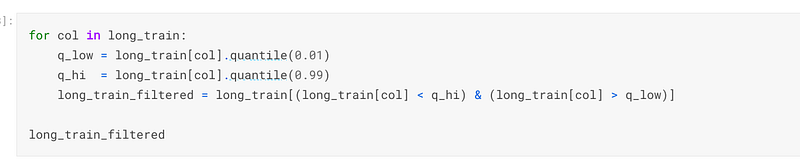
I then set up the lower and higher limits and filtered them out of the training dataset:-
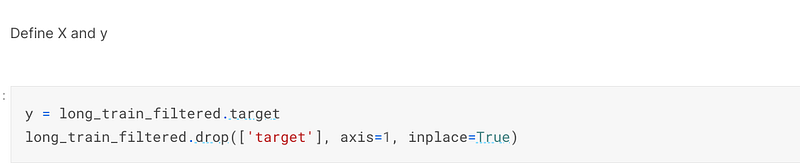
Once the outliers had been filtered out, I defined the y variable and then dropped it from the train dataset:-
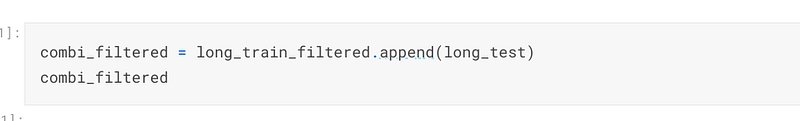
I then appended the filtered test file to the filtered train file to come up with a filtered combi file:-
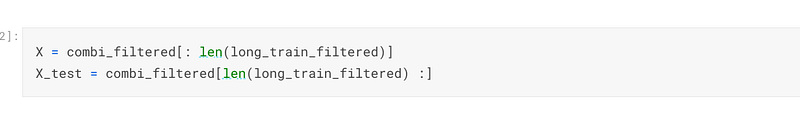
Once the combi_filtered file had been established, I defined the X and X_test variables:-
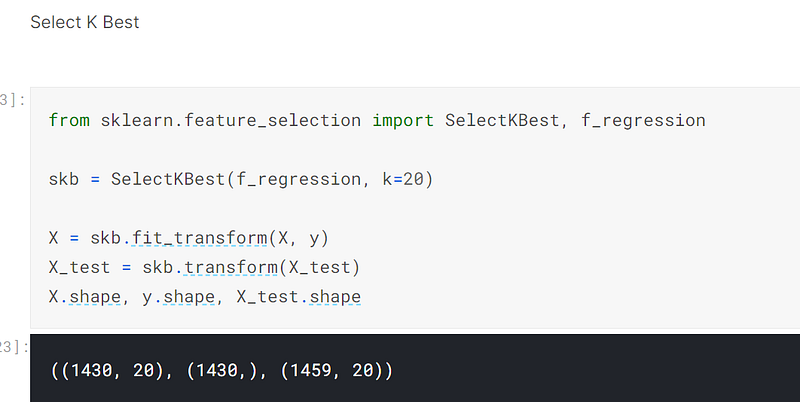
The fourth advanced regression technique I used was to use sklearn’s SelectKBest method to choose the 20 best features for the model to make predictions on:-
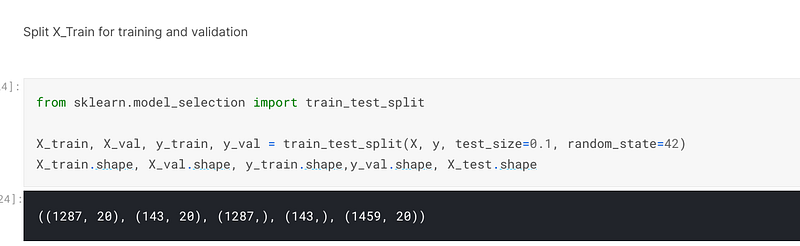
I then used sklearn to split the X and y variables into training and testing datasets:-
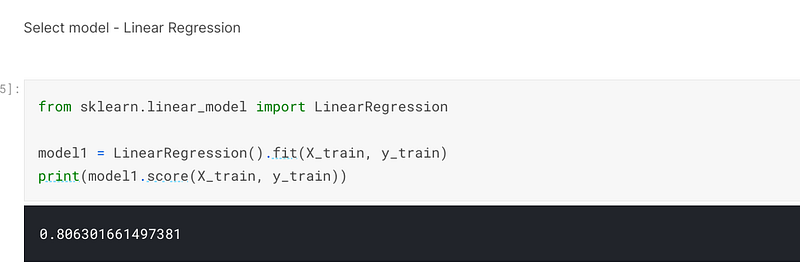
The fifth advanced regression technique I employed was model selection. For this purpose I chose three models to make predictions on. In addith, the sixth advanced regression technique I employed was to use sklearn’s GridSearchCV to select the correct parameters to tune the model to, but I have not included the code in this post.
The first model I selected was sklearn’s LinearRegression model, for which I scored 80% accuracy when I trained and fitted the model:-
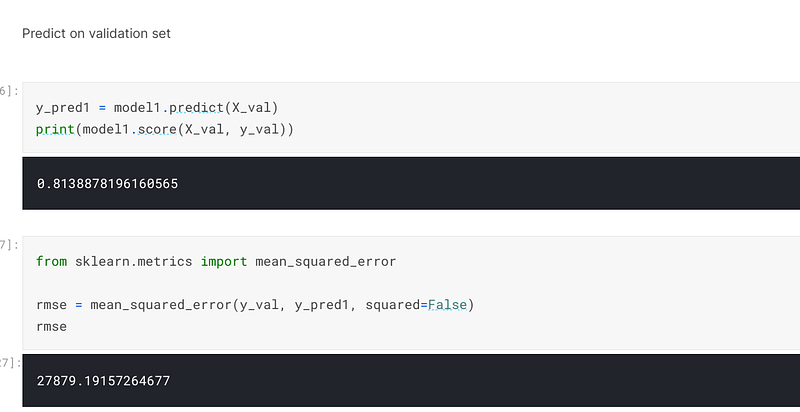
When I predicted on the validation set, I achieved an accuracy of 81% and an error of 27879:-
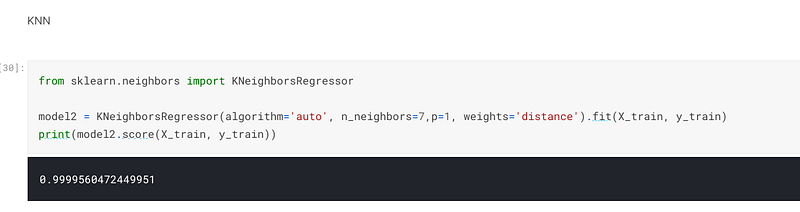
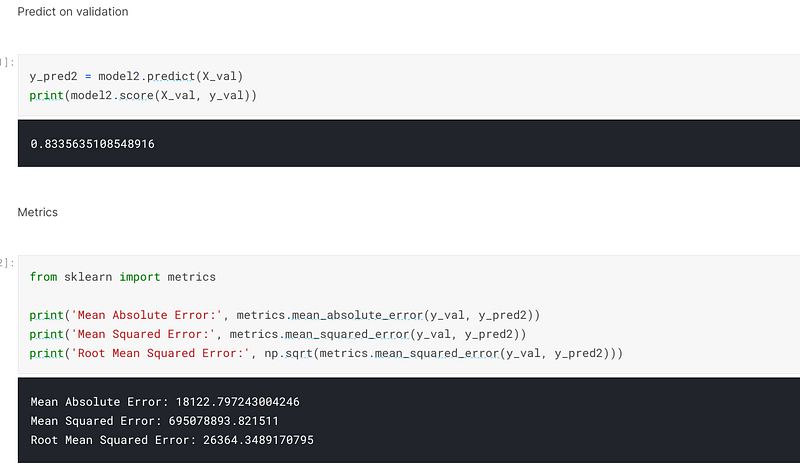
The second model I selected was sklearn’s KNearesrNeighbor, and I scored 99.99% accuracy when I trained and fitted the model:-
When I predicted on the validation set, I achieved an accuracy of 83.36% and an error of 26364:-
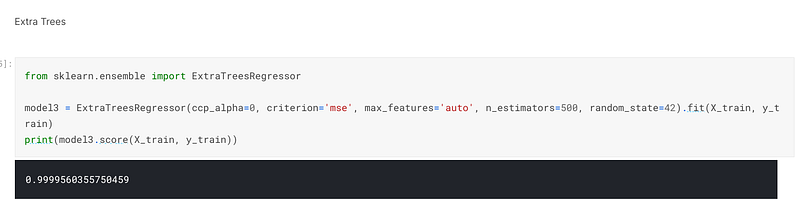
The third model I selected was ExtraTrees. I achieved an accuracy of 99.99% when I trained and fitted the model:-
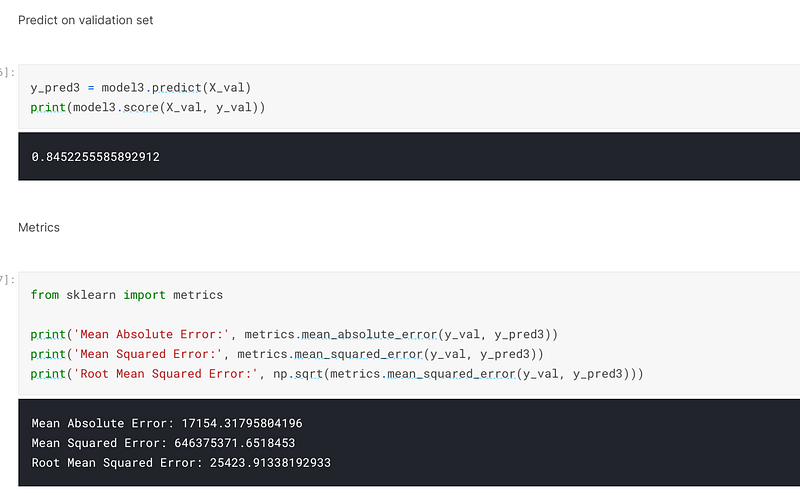
When I predicted on the validation set, I achieved an accuracy of 84.5% and an error of 25423:-
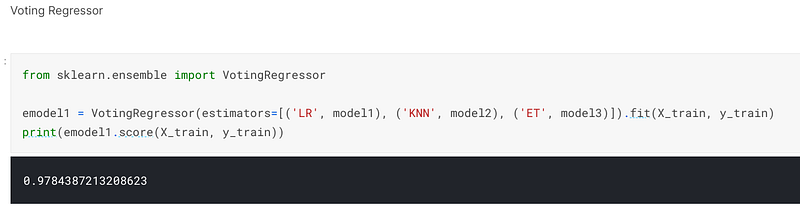
The seventh advanced regression technique I employed was to choose an ensemble method. In this instance I chose a voting regressor, which combined the three models I had previously used and averages those predictions to form one final prediction. When I employed this technique I scored 97.85% accuracy when I trained and fitted the model:-
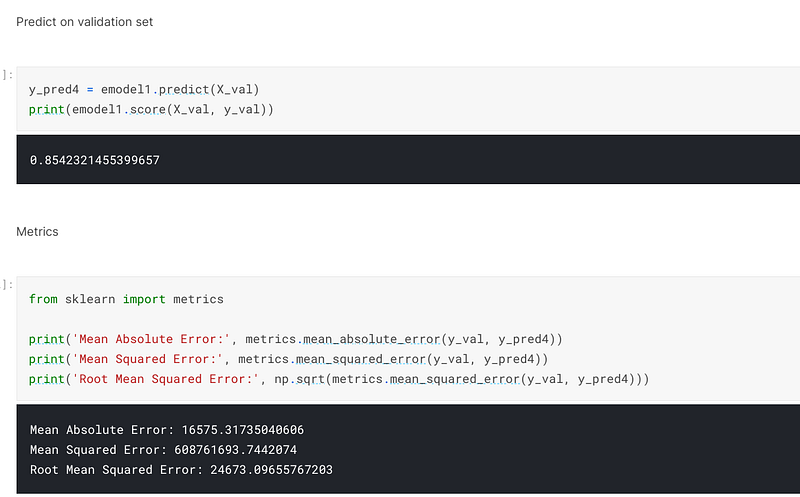
When I predicted on the validation set, I achieved an accuracy of 85.42% and an error of 24673. Because this is a regression problem, the error is what is looked at. Therefore, the lower the error is, the better the score is:-
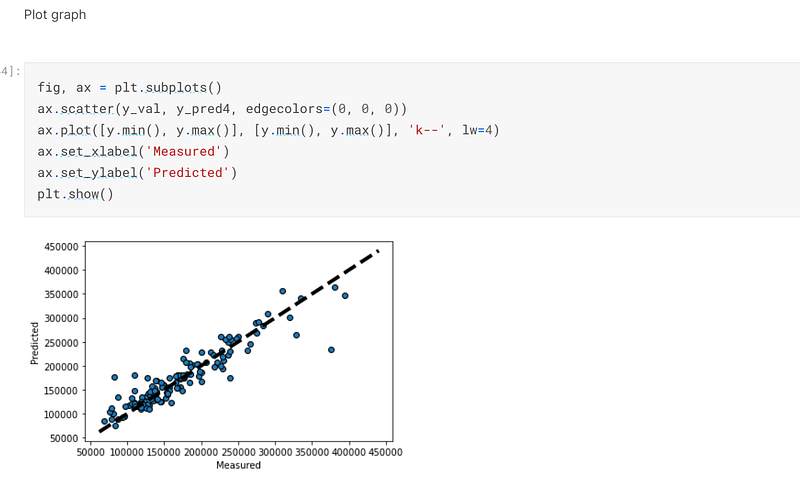
I then used matplotlib to plot a graph of how the predicted values compare to the actual values:-
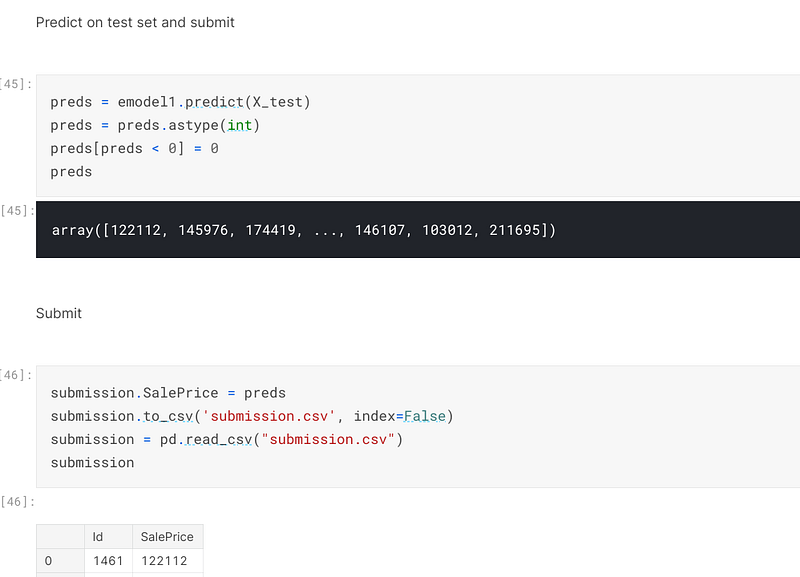
Once the validation set had been successfully predicted on, I predicted on the X_test set and prepared the predictions to be submitted to Kaggle for scoring:-
In this instance I scored about one point better than my previous submissions. This reveals that by employing advanced regression techniques, it is possible to improve one’s score when entering Kaggle competitions.
The code for this post can be found in my personal Kaggle account, the link being here:- https://www.kaggle.com/tracyporter/r9-house-prices-udemy-improve/notebook?scriptVersionId=77678320


