
How I improved my score on Kaggle’s Titanic competition by using advanced classification techniques
I am always looking for ways to improve my score on the various Kaggle competitions, with the Titanic competition being the one that I have devoted the majority of my time to. My personal Kaggle account is full of Jupyter Notebooks where I have endeavored to improve my score on the leaderboard by employing one technique after another. The link for Kaggle’s Titanic competition can be found here:- https://www.kaggle.com/c/titanic
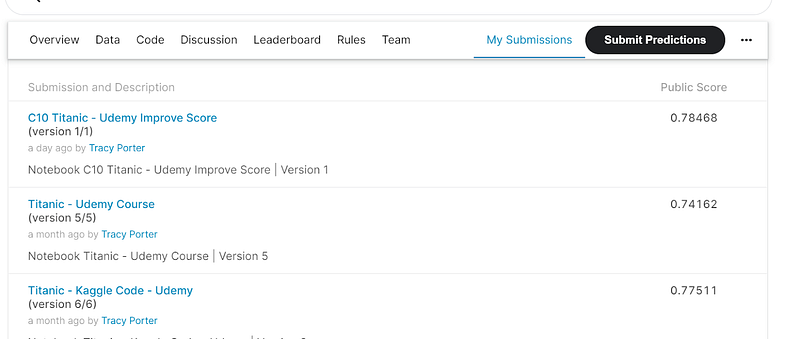
In this post I intend to show how I have employed several techniques all in one Jupyter Notebook to achieve as high a score as I can without going specifically programming the known survivors into the algorithm. I have employed the following techniques to achieve a score of 78.47% on the leaderboard: mapping, imputation, scaling, bins, feature selection, model selection, and grid searching:-
I have written the program in Kaggle’s free online Jupyter Notebook and submitted my predictions to Kaggle when I ascertained that the program was in good working order.
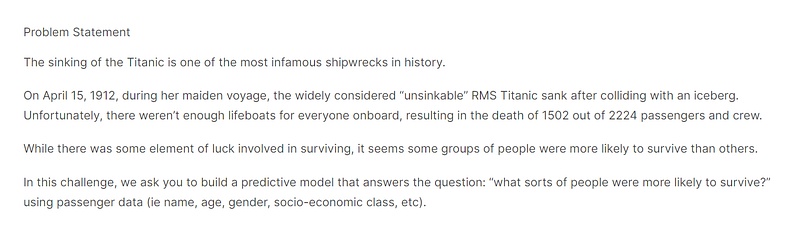
The problem statement for the Titanic competition can be found in the screenshot below:-
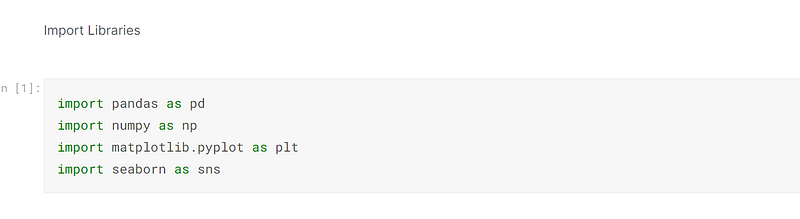
The first thing to do upon creating the program was to import the libraries, and in this instance I imported pandas, numpy, sklearn, matplotlib and seaborn. Pandas is used to create dataframes and manipulate them, numpy creates arrays and performs algebraic computations, sklearn houses a multitude of machine learning functions, and matplotlib and seaborn graphically plot data points to visually represent the data:-
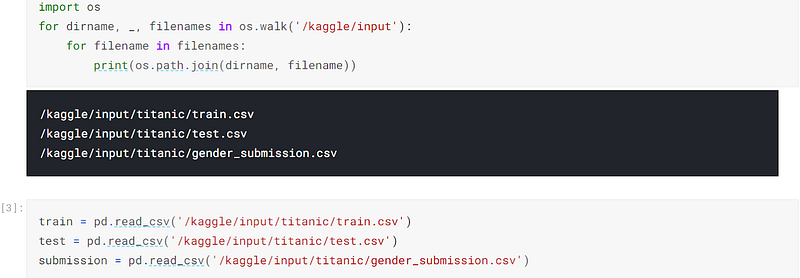
I then used the os function to go into the operating system and retrieve the files that would be used in the execution of the program.
Once the files were retrieved, I used pandas to read the csv files and convert them into dataframes:-
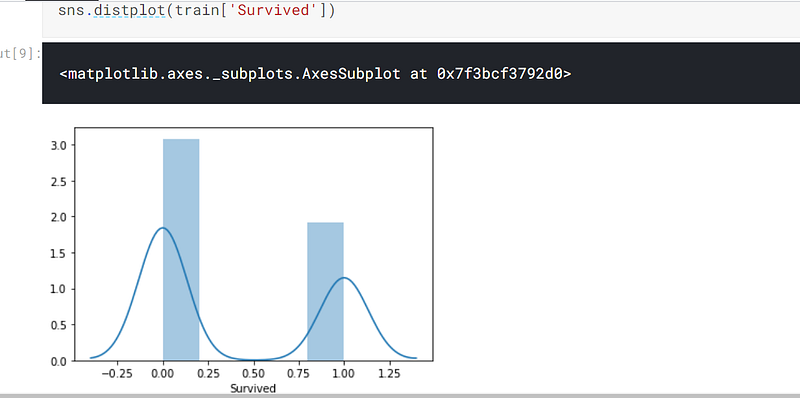
I then used seaborn to analyse the target, which is the column. ‘Survived’. I can be seen from diagram that more people perished than survived:-
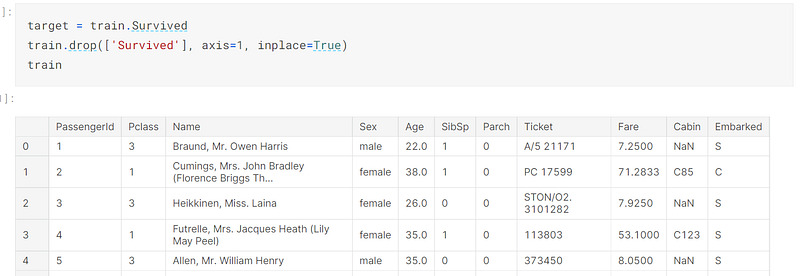
I then defined the variable, target, which is where the column, ‘Survived’, is stored.
I then dropped the column, ‘Survived’ from the dataframe, train:-
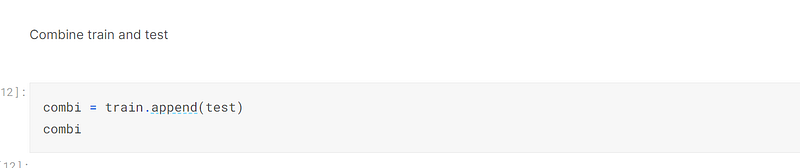
I then appended the dataframe, test, to the dataframe, train, to create one large dataframe, combi:-
Once I had adequately prepared, I used code to extract the title from the name and put those titles in a dictionary:-
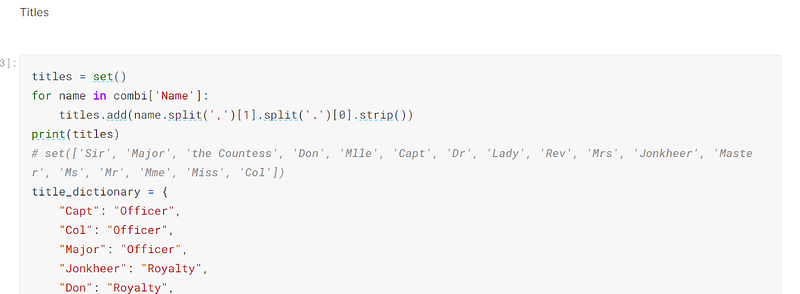
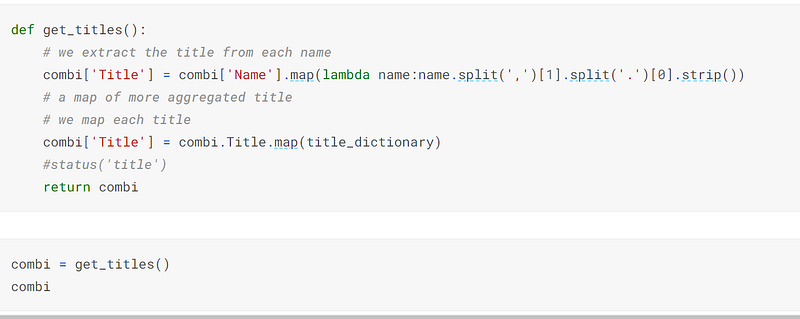
I then inserted code that forms the function that will extract titles from the name and map the dictionary to the column, ‘Title’.
I then called the function to use in the dataframe, combi:-
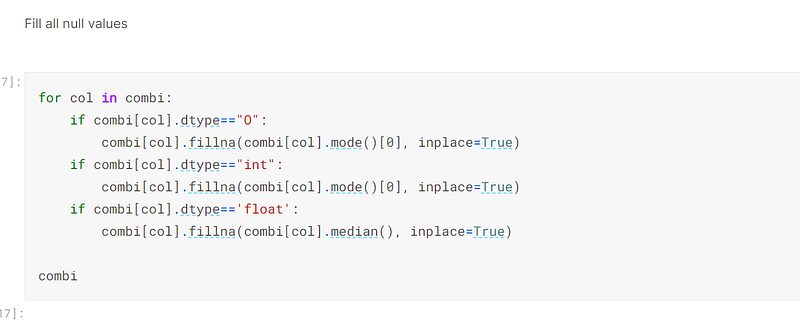
The second technique was to impute the missing values:-
The third technique I used was to create bins to compartmentalise the age and fare of the passengers:-
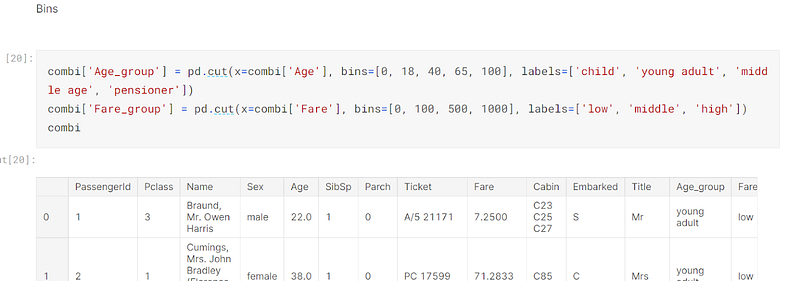
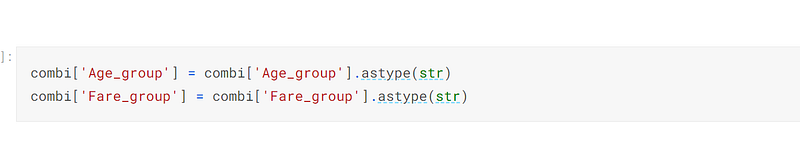
When I created the bins, the resulting columns were categorical, which are difficult to encode, so I converted the two resulting columns to strings, which would make their data types objects:-
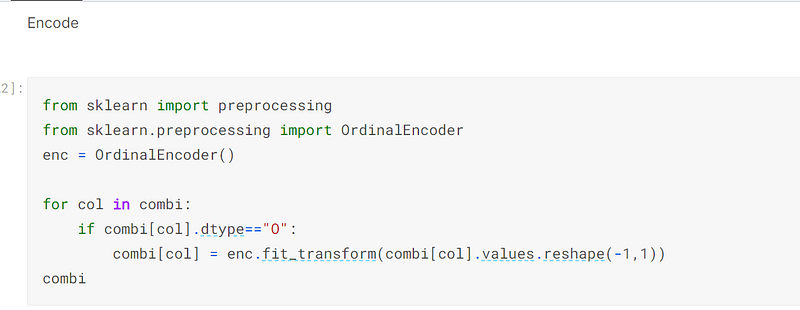
The fourth technique I employed was to use sklearn’s OrdinalEncoder to encode all of the columns of data type object:-
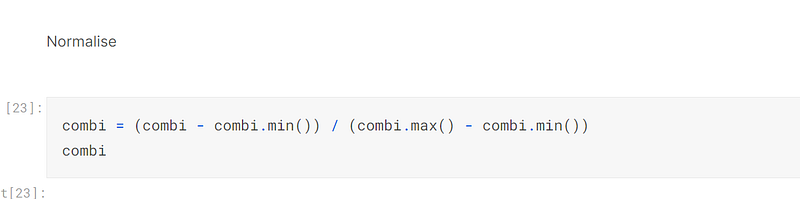
The fifth technique I employed was to normalise the dataframe, combi, to convert all of the cells to values between zero and one, which makes it easier for the model to make precise predictions:-
The sixth technique I used was to employ feature selection.
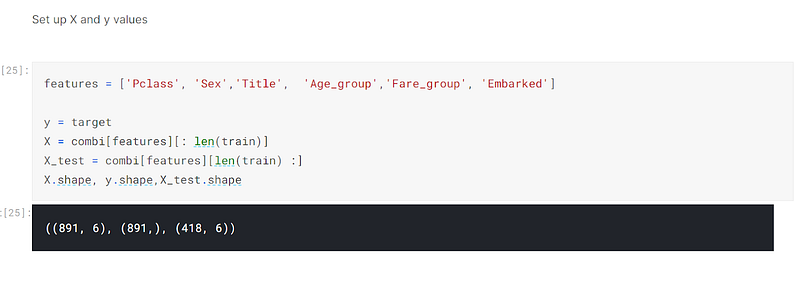
I defined the X, y and X_test variables. The X and X_test variables did not accept all of the columns, but features, being defined as the columns, ‘Pclass’, ‘Sex’, ‘Title’, ‘Age_group’, ‘Fare_group’, ‘Embarked’:-
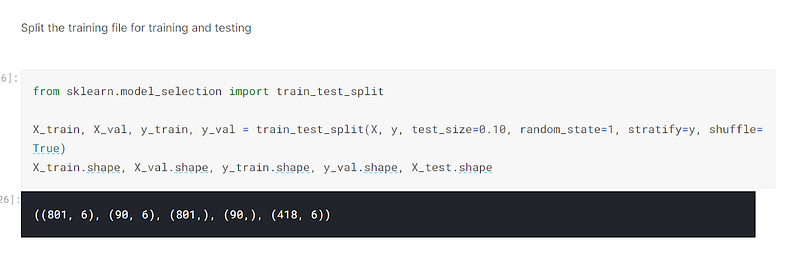
I then used sklearn’s train_test_split to split the dataset into training and validating sets:-
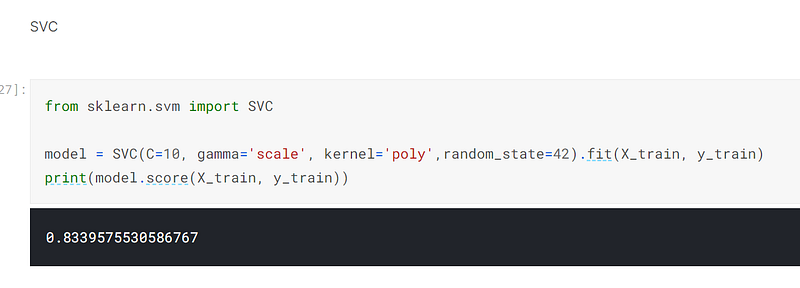
The seventh technique I employed was to use sklearn’s SVC estimator to make predictions. I had used sklearn’s GridSearchCV, being the eighth technique I employed, to tune the parameters in a program I had written in Google Colab, and simply transferred the code and parameter tuning to this Kaggle Jupyter Notebook. I achieved 83.4% using this estimator with the appropriate parameter tuning:-
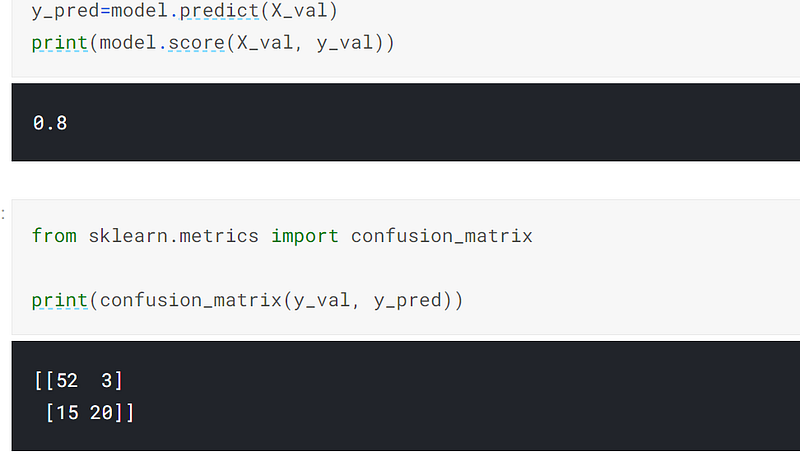
I then predicted on the validation set and achieved 80% accuracy:-
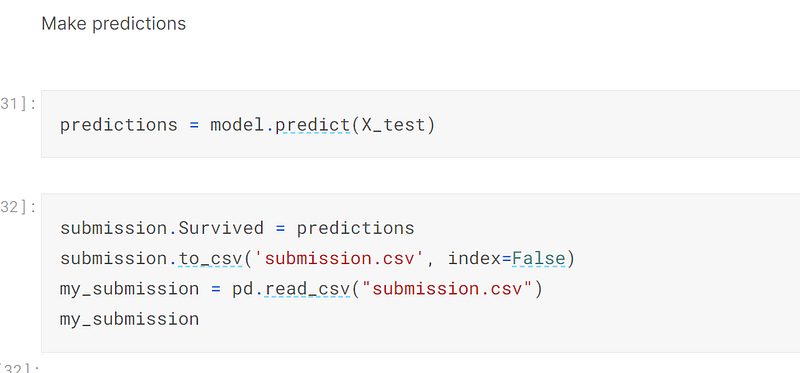
Once the validation set had been successfully predicted on, I predicted on the test dataset and submitted them to Kaggle to be put on the leaderboard:-
In summary, I don’t think it will be possible to achieve accuracy of predictions much higher than this. I have read that those individuals who score higher than 85% have found out the survivors and have hard coded them into the program, and that is something I am not prepared to do.
My next big task is the House Price competition, so watch this space:-
The code for this post can be found in its entirety in my personal Kaggle account, the link being here:- https://www.kaggle.com/tracyporter/c10-titanic-udemy-improve-score?scriptVersionId=77605421