How I Correctly Picked Villanova to Win the 2018 NCAA Men’s Basketball Tournament
Plus, a full breakdown of how my data-optimized bracket performed
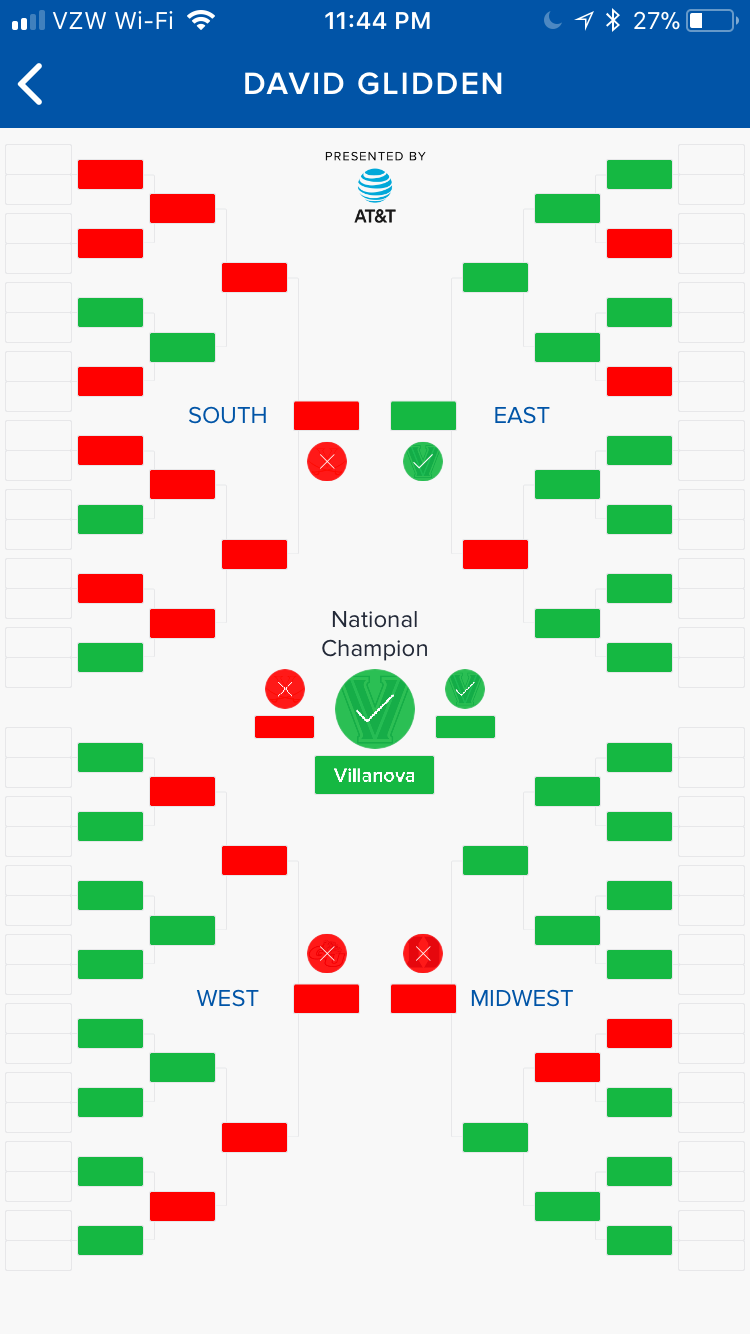
Early last month, I publicly revealed the in-depth method I use to fill out my NCAA basketball tournament bracket, including the exact bracket I was using this year that correctly selected Villanova as the eventual champion.
With Villanova’s win tonight, my bracket placed in the 94.5th percentile in ESPN’s Tournament Challenge pool, ranking in the top 946k of 17.3 million entries, an impressive result. I won or placed toward the top of most family and friends bracket pools.
The bracket performed consistently well from the first weekend. Here’s a round-by-round breakdown of its ranking in the ESPN bracket pool after each round:
- Round of 64: 98.0th percentile
- Round of 32: 99.1st percentile
- Sweet 16: 95.8th percentile
- Elite 8: 79.4th percentile
- Final Four: 86.2nd percentile
- Championship: 94.5th percentile
For comparison, here’s how my bracket performed relative to other brackets:
- My bracket: 1,120 points, 94.5th percentile
- FiveThirtyEight’s bracket: 1,110 points, 93.4th percentile
- Vegas bracket: 860 points, 81.1st percentile
- Chalk bracket (picking higher seed to win each game): 810 points, 78.2nd percentile
- Crowd bracket: 750 points, ~70th percentile
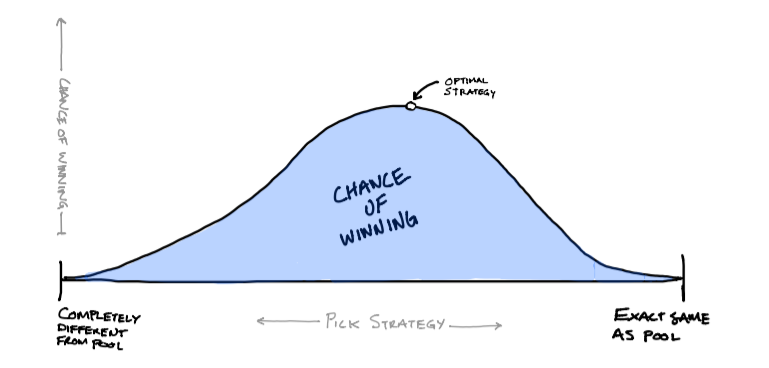
My secrets to success involved comparing crowd data with win probabilities published prior to the tournament. I composed a perfectly optimized bracket that balanced maximum potential points while being different enough to have a chance at beating the crowd — the optimal strategy:

I built a comprehensive spreadsheet that crunched the numbers and spit out the optimal bracket. This was the bracket I submitted to the various online pools.
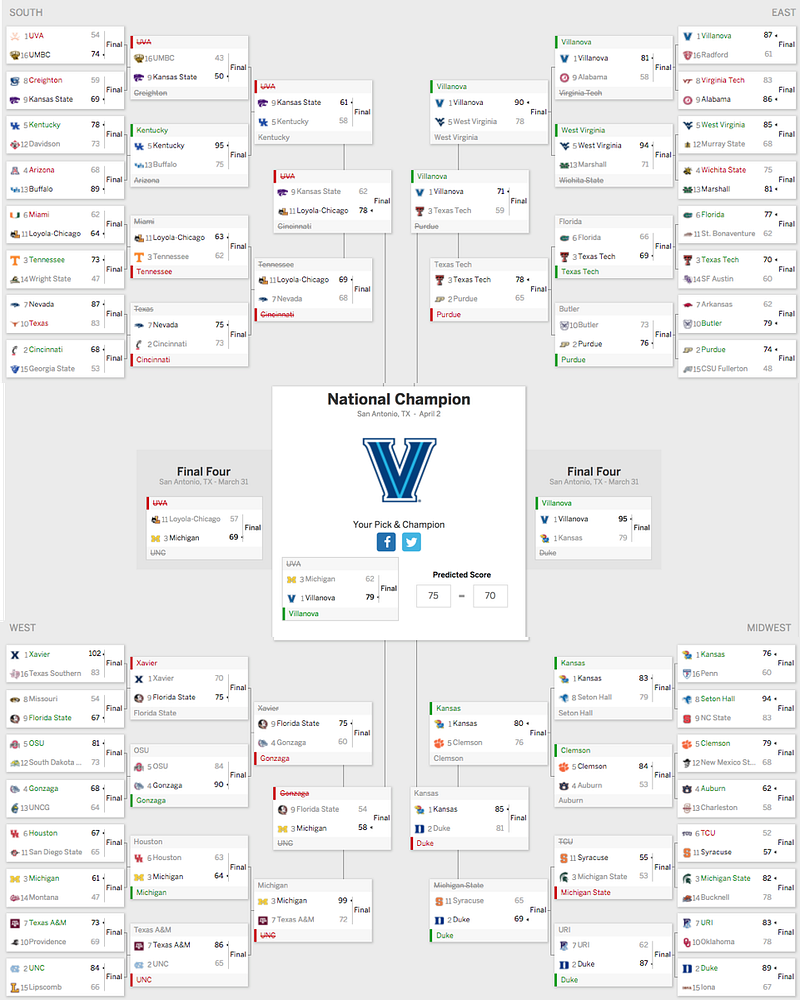
Villanova carried my bracket to success, accounting for 630 of my 1120 points, or 56.25%. However, after a crazy tournament, it’s worth reviewing a few pivotal teams that helped to make (or break) my bracket throughout the tournament.
The Final Four
Villanova
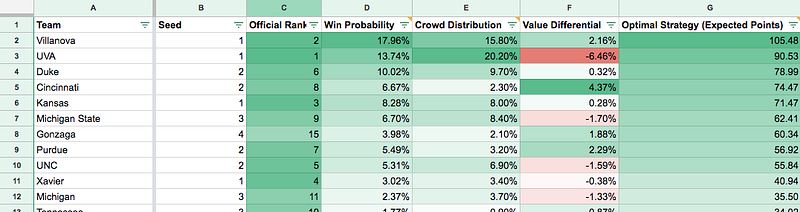
Villanova wasn’t a very unorthodox pick to win the tournament. In fact, Villanova was given a 17.96% chance of winning the tournament by FiveThirtyEight, the highest probability given to any team. However, optimal strategy weighs both probability and crowd pick distribution, and even considering those factors, it still recommended Villanova. For comparison, last year, Villanova was also the most likely to win the tournament, but the math told me to pick Gonzaga. Gonzaga beat Villanova in the Final Four before losing to UNC in the championship game.
This year, the crowd picked Virginia to win 20.2% of the time, compared with the 13.74% chance to cut down the nets, making them the most overvalued team in the field by 6.46 percentage points.
Villanova was slightly undervalued, picked by 15.8% of the field. This value, combined with the high probabilities for Villanova, led the math to suggest Villanova as the most optimal championship pick.
Michigan
Michigan was a slightly overvalued team; 3.7% of the crowd picked them to win the national championship, but they only had a 2.37% chance, according to FiveThirtyEight. Being overvalued is common with strong college sports programs, although they were less overvalued than true blue bloods Duke and Kansas.
My methodology had them as the 11th best pick to win the title, right in line with the probabilities. I had them 6th on that side of the bracket, after #1 UVA, #2 Cincinnati, #4 Gonzaga, #2 UNC, and #1 Xavier.
Due to the madness of this year’s March, Michigan was quite fortunate to not have to face any of those teams. In fact they had the easiest road to the championship of any team since the advent of the 64-team field in 1985. They didn’t have to play a single team seeded fifth or better until they met Villanova in the championship.
Furthermore, they barely made it through Round of 32 — they were nearly upset by a strong 6-seeded Houston team on a buzzer beater (Houston had an 88.5% chance of winning that game with 10 seconds left).
My second-steepest drop in the ESPN rankings was after Michigan beat Florida State in the Elite Eight. I went from 95.8th percentile to 86.9th percentile. Michigan was a fairly trendy pick to get out of the West region, and so I lost a lot of ground on the crowd from that one game alone.
Kansas
When I saw how the math had filled out my bracket, I was skeptical that the chips would fall according to plan in the Midwest region. However, it ended up being one of my best-performing regions, making 12 of 15 correct picks. I correctly picked Kansas and Duke to make it to the Elite Eight, despite a tough road for Kansas: the (presumably) best 16 seed in history, a strong Seton Hall team, and a capable Clemson team.
In fact, in my experimental “optimal round by round” bracket, I had Penn becoming the first #16 seed to beat a #1 seed. I guess I was just looking at the wrong corner of the bracket…
When Kansas met Duke in the Final Four, the two teams did justice to the pre-game hype by putting on one of the most exciting games of the tournament, an overtime thriller that Kansas pulled away to win. That win caused my bracket’s largest drop in the ESPN pool, dropping 11 percentage points from 90.3rd percentile to 79.4th percentile.
I wasn’t the only one who took a loss that night. 17.5% of the crowd had Duke making it to the Final Four, compared to only 14.7% for Kansas.
Loyola-Chicago
This year’s Cinderella takes its place alongside the VCU’s and George Mason’s of the world who have had their school’s name put on the map by their basketball team’s strong performance in March.
What to make of the 2018 darlings? A lot of commentators and experts correctly had them pegged as a dark horse before the tournament started. FiveThirtyEight’s Elo ratings marked them as the 25th-best team in the tournament, but when combined with other ranking methodologies, the Ramblers settled in at 44th overall, not far from their 46th-place ranking by the selection committee.
My bracket model simply saw too much potential for Miami to beat Loyola.
The Ramblers and Sister Jean made an incredible run, but it almost didn’t happen. They won their first three games by a combined four(!) points. The craziness of the South region made predicting a Loyola run to the Final Four even more difficult. Prior to the tournament, FiveThirtyEight gave Loyola a 0.8% chance of making it to the Final Four.
Notables
UMBC over Virginia
Why didn’t my model pick the first #16 upset of a #1 seed, when UMBC knocked off Virginia? Let me count the ways:
- The first 132 sixteenth-seeded teams couldn’t achieve that feat
- FiveThirtyEight gave UMBC a 2.15% chance of winning the game
- Virginia was the #1 overall seed, not just any #1 seed.
- My model projected that Virginia would earn my bracket an average 125.92 points in my pools.
In the end, a perfect storm of events wrote the University of Maryland-Baltimore County Retrievers into the history books, in a way that no model could have predicted.
#5 Seed Success
At least one #12 seed has knocked off a #5 seed in the round of 64 in 16 of the past 18 years, but my model stuck with all #5 seeds and was rewarded with four correct picks against quite a few trendy #12 teams.
My model correctly picked Kentucky, West Virginia, and Clemson to all proceed to the Sweet 16, besting the lackluster field of #4 seeds this year.
Dark Horses and Cinderellas
The dark horses I predicted in my original post, Kentucky, West Virginia, Houston, and Seton Hall all did well, advancing to the round of 32 and then either advancing to the Sweet 16 or putting up a good fight.
I advised to watch out for Cinderella potentials #10 Butler and #10 Texas. Butler quasi-upset #7 Arkansas before falling in a close matchup to Purdue, and Texas choked in its pursuit against Nevada, at one point having a 93% chance of winning the game, maintaining an 86% chance of winning with 6 seconds left in the game.
Before You Go
Enjoyed this post? Give it a few 👏, share it with friends, and follow me.
If you liked this post, you may also like my other posts about sports and data:
- The Ultimate Guide to Filling Out Your Bracket for March Madness
- How I Outsmarted a FiveThirtyEight Forecasting Algorithm
- How I Used 200 Experts and Reddit’s Comment Ranking Algorithm to Win My Office NFL Pick’em Pool