
How I Used 200 Experts and Reddit’s Comment Ranking Algorithm to Win My Office NFL Pick’em Pool
I find a disproportionate amount of joy in participating in my office’s NFL pick’em pool each year. Last year (2015–2016 NFL season), without any coherent strategy, I started 18th of 24 and fought my way up to being tied in 4th by the end of the season. This year, I figured that if I employed a consistent strategy, I might actually win.
And win I did.
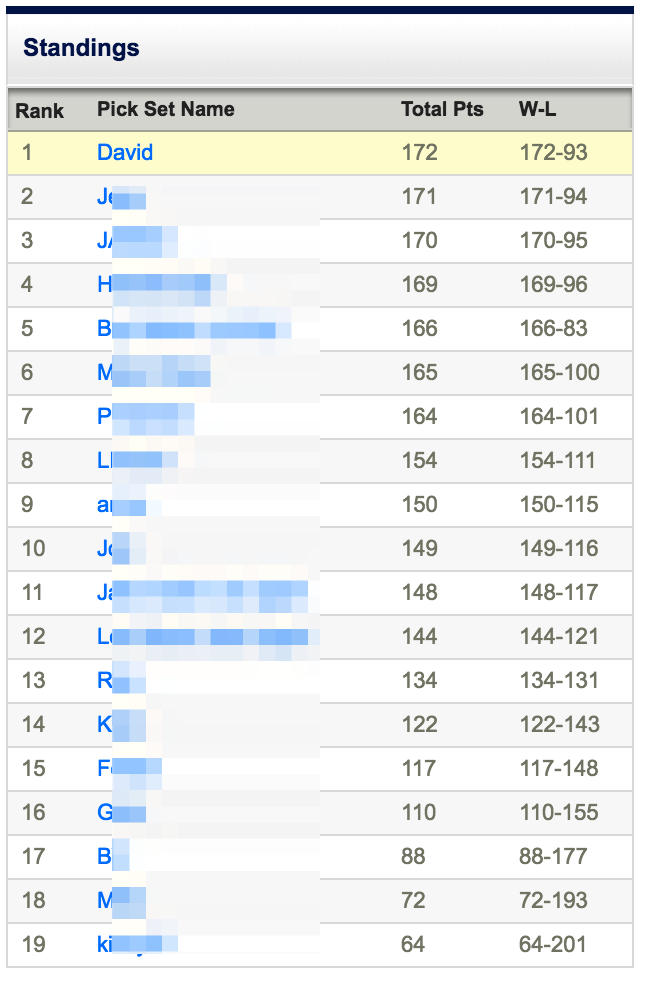
New England’s unbelievable Super Bowl win yesterday over Atlanta placed me 1st out of 19 colleagues with a record of 172 of 265 correct picks.
How did I do it? I created a system that used data from over 200 “experts” and a variation of Reddit’s comment ranking algorithm to methodically generate a winning edge over my colleagues.
My broad thesis was this: each week, I would follow the advice of the expert with the best track record, using his or her pre-announced picks as my own for the next week.
As these experts proved their proficiency at picking winners, I followed their coattails to success. As they jockeyed and traded places as the top-ranked oracle, I switched my allegiance accordingly.
My logic, while fallible in theory, was successful in practice: past success among certain experts did guarantee me future performance.
The result? A system that turned thousands of expert predictions into office bragging rights.
Gathering “Expert” Predictions
If I was going to follow the coattails of the most reliable expert, I first needed data to tell me which of these so-called “experts” was actually consistently picking winners each week.
I found just what I needed at NFL Pickwatch.
NFL Pickwatch tracks the picks and predictions by NFL “experts” each week over the course of the NFL season. Most of the experts are NFL media analysts (hence their “expert” status), but NFL Pickwatch also tracks the Vegas line, ESPN user consensus, Microsoft’s artificial intelligence bot Cortana, and algorithms such as FiveThirtyEight’s Elo predictions. The guys behind NFL Pickwatch, in their own words, “track, watch and stalk (figuratively) each NFL expert across every network and website”.
NFL Pickwatch has weekly expert predictions dating back to the 2014 season. In August, I manually copied and pasted 2014 and 2015 season weekly pick data from NFL Pickwatch into a Google spreadsheet. Each week’s worth of data looks something like this:
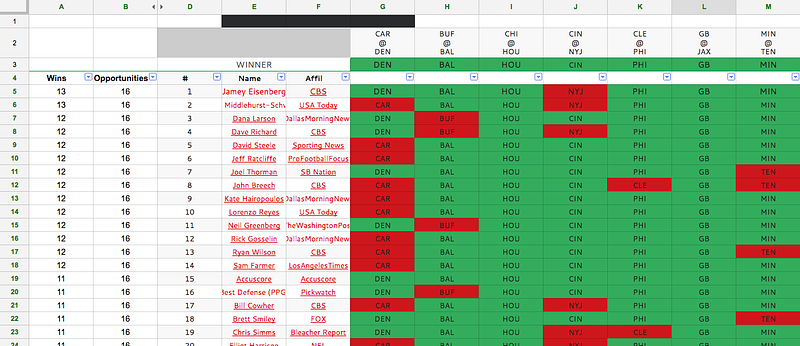
Row 3 contains the winner of each game, which I would post manually each week. A formula at left calculated the number of wins out of total picks.
The formula only penalized experts for wrong picks, not incomplete ones. I calculated this myself instead of relying on NFL Pickwatch’s calculations, as they only stopped penalizing for incomplete picks at the beginning of the 2016 season.
Finding the Best Expert
One challenge with the data from NFL Pickwatch was that they only could track the predictions that experts provided publicly. Over the years, NFL Pickwatch has expanded the number of experts they track. This meant that some experts had data going back to 2014 while others were new kids on the block at the beginning of the 2016 season. This made comparing experts a challenge.
The Problem with Win Percentage
A natural starting point for comparing experts is to compare their win percentage, that is, the number of correct predictions of total predictions made. For example, if I made 100 predictions and picked the correct winner in 60 of them, my win percentage would be 60%.
The problem with this approach is that experts with a proven consistency over 500 games could not be so easily compared to a new expert who had a lucky first week.
For example, across the 2014, 2015, and 2016 seasons, to be considered a top expert in the 90th percentile of all experts, an expert had to pick winners correctly at least 66.25% of the time. A few benchmarks over that same time period for reference:
- Vegas line: 66.11%
- ESPN fan consensus: 66.29%
- Home teams won 56.4% of the time
Using win percentage to rank experts would result in a proven expert who predicted 400 winners in 600 games (66.67% win percentage) ranking below a new entrant who got lucky in his first week, picking 13 of 16 winners correctly (81.25% win percentage).
I wanted my system to balance favoring new entrants, who may have found an innovative way of making predictions, with experts who consistently performed well over multiple seasons.
Enter Reddit’s Comment Ranking Algorithm
A few years ago I ran across an article by Amir Salihefendic detailing how Reddit ranks comments.
Reddit allows comments to be upvoted and downvoted to rank comments according to their crowdsourced quality. To rank them, Reddit must compare a comment that has 1 upvote and 0 downvotes to another that have 50 upvotes and 0 downvotes. Both have a 100% “positive” rating, but Reddit’s algorithm ranks the second comment higher than the first.
Reddit does this by performing a “confidence sort”. It balances the quality of a comment with the confidence that the current allocation of upvotes versus downvotes will be accurate in the long run. See “How Not to Sort by Average Rating” for why this methodology is much more accurate than ranking calculations made at other sites such as Urban Dictionary and Amazon.
To perform a confidence sort, Reddit uses a Wilson score interval:
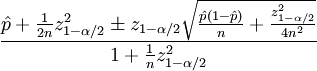
Salihefendic explains:
“In the above formula the parameters are defined in a following way:
- p is the observed fraction of positive ratings
- n is the total number of ratings
- zα/2 is the (1-α/2) quantile of the standard normal distribution
Let’s summarize the above in a following manner:
- The confidence sort treats the vote count as a statistical sampling of a hypothetical full vote by everyone”
We can use the same parameters to calculate a Wilson score interval for our experts. In our case,
- p is the number of correct predictions
- n is the total number of predictions made
- zα/2 remains the desired quantile of the standard normal distribution, or how confident we want to be about the accuracy of expert predictions
Here’s how the formula is represented in an Excel formula: =sqrt((p/n)+z*z/(2*n)-z*(((p/n)*(1-(p/n))+z*z/(4*n))/n))/(1+z*z/n)
According to Salihefendic, Reddit’s comment ranking algorithm uses a confidence interval (the value for z above) of 1.281551565545. He claims that this is equivalent to an 85% confidence interval, meaning that:
- “The confidence sort gives a comment a provisional ranking that it is 85% sure it will get to
- The more votes, the closer the 85% confidence score gets to the actual score”
I think he’s mistaken, based on this quantile function table on Wikipedia that shows 1.28 to be the value for an 80% confidence interval, not 85%.
Regardless, the general idea is the same. We should select a value for z based on how confident we want to be about an expert’s prediction quality.
In experimenting with different z values, I chose to use 1.6, rounded from the 1.644853626951 value representing a 90% confidence interval. I chose 90% over 95% and 98% confidence intervals (z = 2.0, z = 2.3, respectively). I felt 90% gave me the best balance of deference towards time-tested experts and being aggressive enough to recognize “rising stars” after just a few weeks of consistent superior picks.
Combining the Data and the Algorithm
Using two seasons worth of data from NFL Pickwatch, I ranked 177 experts based on their Wilson score interval. The top 5 experts:
- FiveThirtyEight — 0.8205 (360 of 531, 67.8%)
- ESPN Fans — 0.8144 (356 of 533, 66.8%)
- Jamey Eisenberg — 0.8144 (356 of 533, 66.8%)
- Pickwatch Fan Picks— 0.8133 (355 of 533, 66.6%)
- Josh Katzowitz — 0.8129 (354 of 532, 66.5%)
So, for the first week of the 2016 season, I used FiveThirtyEight’s picks as my own.
I repeated this method every week. I exported the previous week’s results from NFL Pickwatch, recalculated Wilson score intervals for each expert, and changed my picks accordingly. In the 2016 season, NFL Pickwatch added over 30 experts, bringing the total number of experts to over 200. I also added a few of my own experts, which I might write about in a future post.
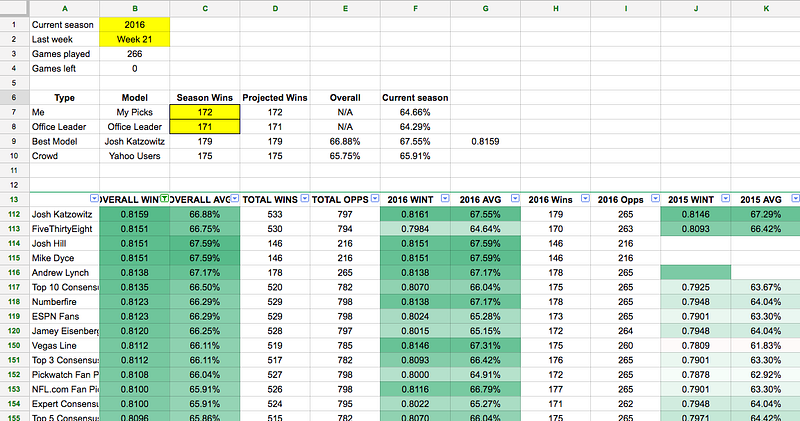
Here’s the full spreadsheet showing my system, with data from Week 1 of the 2014 season through yesterday’s Super Bowl 51.
As you can see above, FiveThirtyEight’s Elo model had dominated throughout the 2014 and 2015 seasons, ending nearly a full percentage point above the second-ranked “expert”, ESPN Fans by the start of the 2016 season. Because of this, FiveThirtyEight remained ahead of the pack the entire 2016 season!
Despite the hours of work copy and pasting data and creating a complicated spreadsheet of auto-generating formulas, my system consistently told me to simply follow the advice of FiveThirtyEight.
FiveThirtyEight would remain the top expert throughout the entire regular season, only being kicked off the throne after the first week of the 2016 playoffs.
By the end of this season, using data from the 2014, 2015, and 2016 (including playoffs and Super Bowls in each season), the current top 5 experts are:
- Josh Katzowitz — 0.8159 (533 of 797, 66.9%)
- FiveThirtyEight — 0.8151 (530 of 794, 66.8%)
- Mike Dyce — 0.8151 (146 of 216, 67.6%)
- Josh Hill — 0.8151 (146 of 216, 67.6%)
- Andrew Lynch — 0.8138 (178 of 265, 7.2%)
Here’s how these five experts have ranked over each week starting from Week 1 of 2014:
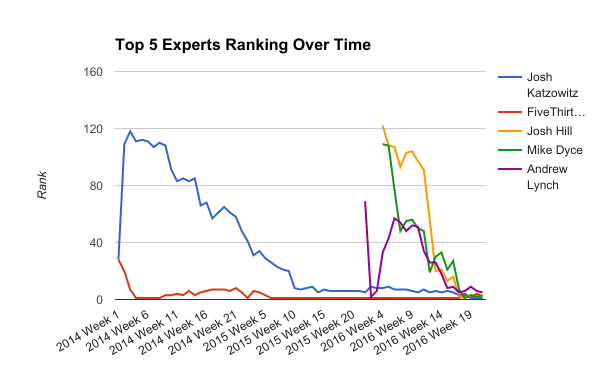
As you can tell, FiveThirtyEight has dominated in the past three years, standing atop the leader board for 39 of 63 weeks, only succumbing to Josh Katzowitz in these last few weeks of the 2016 playoffs.
Winning the Office Pool
Using this system, which essentially amounted to just copying FiveThirtyEight’s picks all season, I made 172 correct picks of 265 games for a final win percentage of 64.66%. My second-place coworker made 171 correct picks, nearly winning it all until her Super Bowl 51 pick, the Atlanta Falcons, collapsed in the fourth quarter.
Now, I readily admit that our office is not particularly sports-crazed. Additionally, the pool was obviously pretty small. This system probably wouldn’t have worked in another larger office pool. Nonetheless, the countless hours I had putting this system together was a ton of fun and just happened to end up the winner.
The sad thing? If any of us had just followed the crowd and picked the Yahoo User favorites, we would have ended in 1st with 174 correct picks. If we picked the Vegas Line favorites, we would have ended with 175 correct picks. This goes to show the power of the crowd and the markets, and why one should be cautious in attempting to beat either.
But for this year at least, the office glory — and a few bucks — are mine.
Let me know what you think of my approach in the comments below. I didn’t spend the time noting its various flaws in detail, but if you read this far, I’m sure you’ve got some smart critiques and suggestions of your own.