
Machine Learning Art
How do you analyze a dataset?
Visualization for understanding — Computer Vision
My everyday creative work is usually a data-driven project. Therefore, it’s essential to ensure that the CV datasets you’re using are reliable and provide data that can be used. Below you will find out how you can check it with the help of visualization.
- April 2022 — AI art tools update can be found ➡️ HERE ⬅️
Most research about computer vision is done by looking at the inner workings of the models, what was learned and how it is different from other models. While this information may be interesting, less research has been done on studying Computer Vision datasets and their attributes. For example, some research uses quantitative methods to evaluate Computer Vision datasets. Unfortunately, their study reveals many biases in these datasets, limiting their generalizability and representativeness. Similarly, several researchers looked into label imbalance issues in various Computer Vision datasets and their influence on multiple tasks to find ways to reduce the bias associated with them.
For evaluating Computer Vision (CV) datasets, the authors look at various data visualization strategies. By using dataset-level analysis, these approaches aid in understanding attributes and hidden patterns in such data. They show how such a study may forecast the possible influence of dataset features on CV models and suggest suitable mitigation of their flaws. They look at several ways of visualizing different modalities of CV datasets.
the article is a summary of the paper — Project Page (scroll down)
the list of visualization techniques:
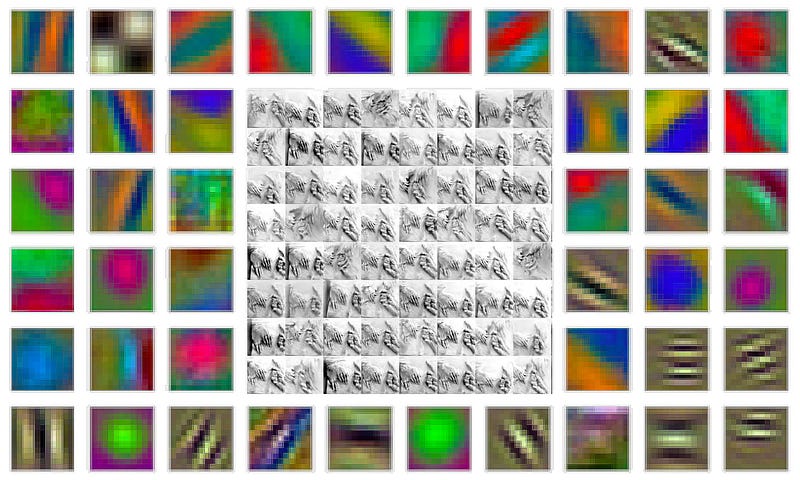
🔵 Pixel-Level Component Analysis (Whole Images , Image Patches)
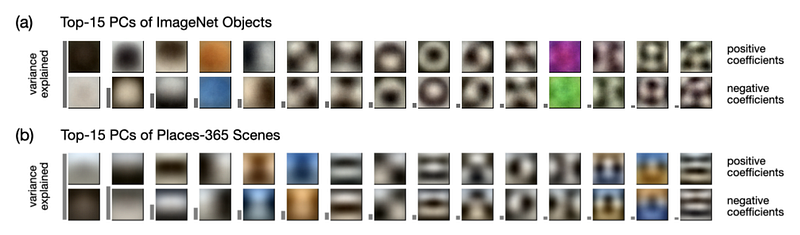
Analyzing the P-L Component in the pixel space will help you figure out which picture characteristics are responsible for the dataset’s substantial variances and, as a result, anticipate their probable usefulness for the model.
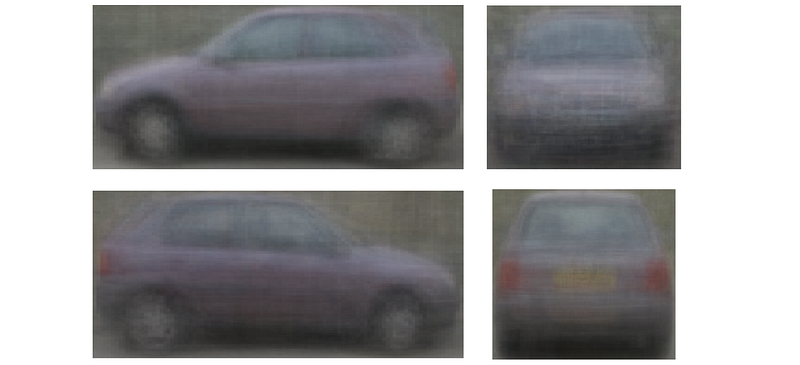
🔵 Spatial Analysis
Exploring the spatial pattern of item types can assist in identifying critical weaknesses in a Computer Vision dataset.
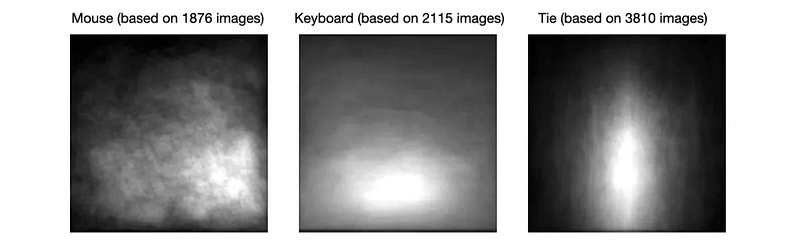
🔵 Average Image Analysis
In classification datasets, average computing photos per class might provide visual signals that classifiers can exploit as “bypass” instead of learning important semantic features.
🔵 Metadata and Content-based Analysis
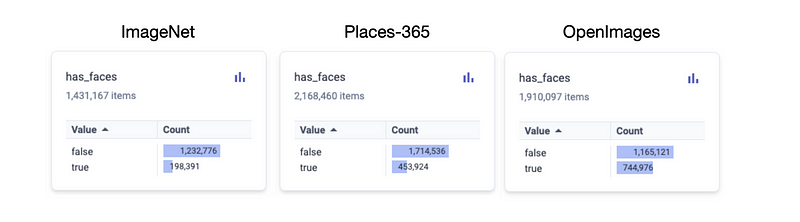
In order to facilitate the curation and labeling of representative datasets, geolocation analysis helps examine the variety of a dataset and investigate multiple manifestations of specified classes and attributes.
🟠 Analysis using Trained Models
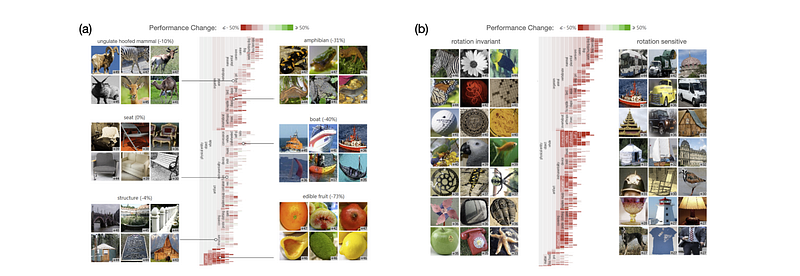
The above image: ImageNet classification accuracy after two perturbations, illustrated for distinct classes and their hierarchies. The classes are represented by the vertical dimension, and the vertical icicle plot depicts their hierarchy. When photos are (a) converted to grayscale (b) rotated by 90 degrees, color indicates which classes and groups in the hierarchy are influenced the most.
The dichotomous character of diverse CV datasets is shown via difficulty analysis. For example, after a few training epochs, the majority of ImageNet samples can either be correctly identified or continue to be misclassified throughout the training process. Such insights are extremely useful in comprehending the behavior of various learning paradigms and architectures, as well as how they are influenced by underlying flaws in the training data.
The visual analysis provides specific advantages for bettering our comprehension of CV datasets. It can give you information about their qualities that isn’t usually evident or widely known.
The authors conducted a fascinating analysis of the available methods. I recommend that you read the entire article below. The link also includes some exciting scenarios for the future in CV datasets visualization.

Title: A Tour of Visualization Techniques for Computer Vision Datasets
The Authors: Bilal Alsallakh, Pamela Bhattacharya, Vanessa Feng, Narine Kokhlikyan, Orion Reblitz-Richardson, Rahul Rajan, David Yan
Project page:
https://arxiv.org/pdf/2204.08601.pdf
Keywords: computer vision, Artificial Intelligence, datasets, Machine Learning, AI art, art, digital art, Metadata, Analysis
I invite you to explore the concept of “AI creativity” by reading and learning from the many articles found on 🔵 MLearning.ai 🟠
- Check out my instagram with new material every week
- If you enjoyed this, follow me on Medium for more
- Want to collaborate? Let’s connect on LinkedIn
- https://linktr.ee/datasculptor
- 3D Machine Learning generated model on sketchfab
Data Scientists must think like an artist when finding a solution when creating a piece of code. Artists enjoy working on interesting problems, even if there is no obvious answer.
All our writers (members) receive the opportunity to be promoted on our social media, which increases the popularity of articles published on MLearning.ai


