
Home vs. Away: Automatic Formation Analysis using Tracking Data
An automatic formation detection method utilizing ball and player tracking data to analyze football matches, uncovering the relationship between formations, execution styles, home advantage, ...
Introduction
The research paper starts by discusses the historical evolution of soccer formations and the lack of analytical measures to quantify team behaviors in the sport. The authors highlight the dynamic and continuous nature of soccer, coupled with the constant swapping of player positions within a formation, as challenges for meaningful comparisons and analysis. However, they note that new data sources containing ball-events or ball and player tracking information have started to provide objective measures for analysis.
The authors reference previous works that have debunked some commonly-held beliefs in soccer, such as the timing of goals after scoring and the relationship between corners and goals. They also discuss the concept of “home advantage” and its existence in professional sports, including soccer, where teams are more likely to win at home. They mention studies that attribute the home advantage to factors like referees’ favorable calls for home teams.
The research paper presents the authors’ investigation into the home advantage phenomenon using an entire season’s worth of ball tracking data. They find that home teams have more shots and goals, as well as greater possession in the forward third compared to away teams, suggesting a more conservative playing style for away teams. The authors aim to explore whether the same home advantage exists across seasons and identify the potential causes, such as teams playing different formations or playing formations differently.
Given the large amount of data available for each game, manually labeling formations across an entire season is impractical. Thus, the authors propose an automatic solution using an Expectation-Maximization (EM) method to detect and visualize formations from player tracking data. They highlight the need for dynamic updating of the method to account for the swapping of player positions within formations. The authors believe that their method can provide unique insights into team characteristics and enable meaningful and efficient visualization and summarization of games.
In the subsequent sections, the paper will showcase the application of their method and present the findings regarding the home advantage phenomenon.
Re-Exploring the Home Advantage
In this section, the research paper discusses the re-exploration of the home advantage phenomenon using a different data source. The authors previously analyzed an entire season of ball-tracking data from the English Premier League and found that home teams had more shots, goals, and possession in the forward third compared to away teams, despite similar passing and shooting accuracy.
To investigate this phenomenon further, the authors used an entire season of player tracking and ball event data from Prozone. The dataset consisted of 20 teams playing home and away matches, with data including player locations at a rate of 10 frames-per-second and ball events. The identities of the league and teams were anonymized for privacy reasons.
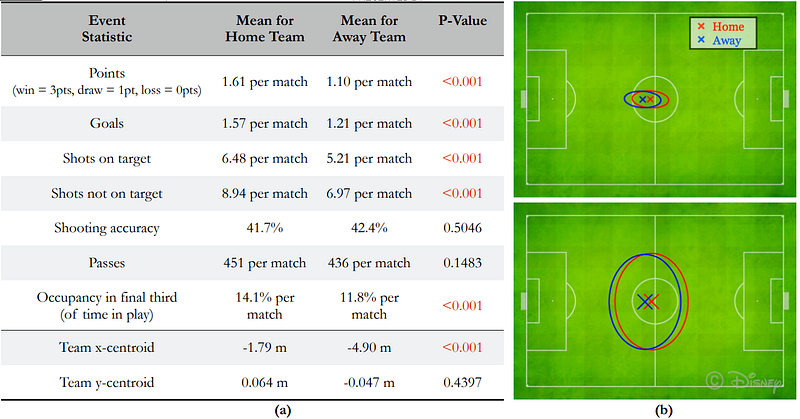
The results of the analysis reaffirmed the previous findings. Home teams in this dataset also had more shots, goals, points, and possession in the forward third (as depicted in Figure 2(a)). The shooting proficiency and number of passes were roughly the same for both home and away teams. Additionally, Figure 2(b) shows that home teams had a more advanced mean position on the field compared to away teams, indicating a difference in playing style. The authors raise questions about whether this difference is due to teams playing with two strikers at home or a global trend of players pushing forward.
To explore the formations and the way players move during games, the authors propose the detection and visualization of formations.
Automatically Detecting Formations from Tracking Data
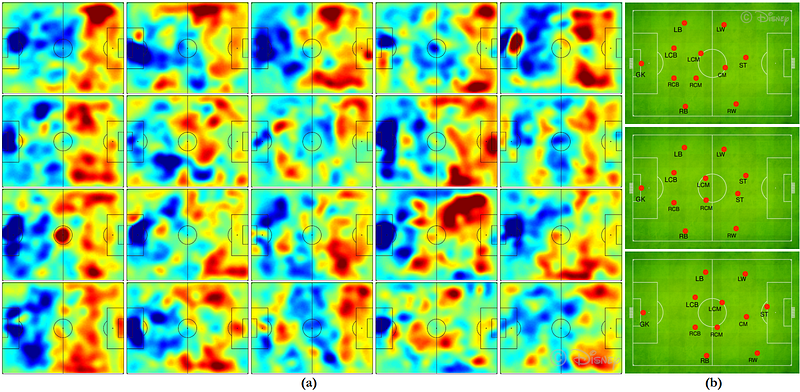
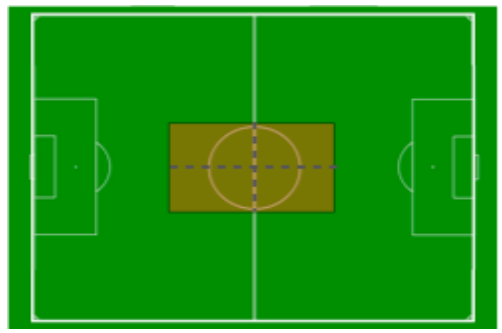
In this following section, the focus is put on automatically detecting formations from tracking data in soccer. Formations represent the spatial arrangement of players and their roles within a team. The authors use a 4–3–3 formation as an example, where each player is assigned a specific role. To account for the relative positions of players, the formations are normalized by removing the centroid and aligning them with the halfway line.
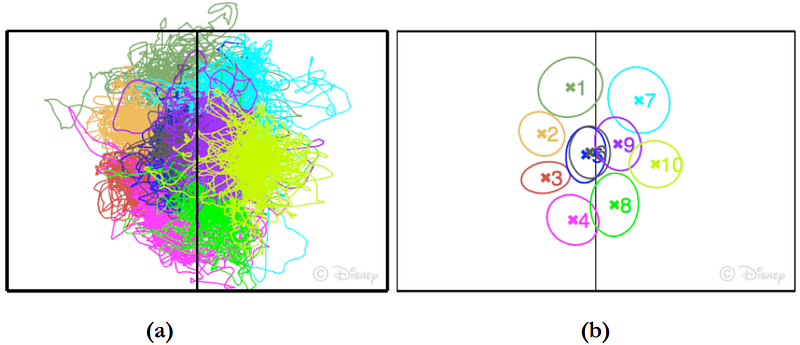
Detecting formations becomes challenging due to the dynamic nature of soccer, with players frequently swapping roles during a match. A static ordering of players based on their starting roles does not accurately represent the team’s structure. To overcome this, the authors propose a dynamic ordering of players based on their roles at each instant in time. However, the challenge lies in not knowing the formation in advance. To address this, an Expectation-Maximization approach is used, where initial player roles are assigned based on mean positions, and the Hungarian algorithm is applied to update player roles in each frame. This process iterates until convergence.
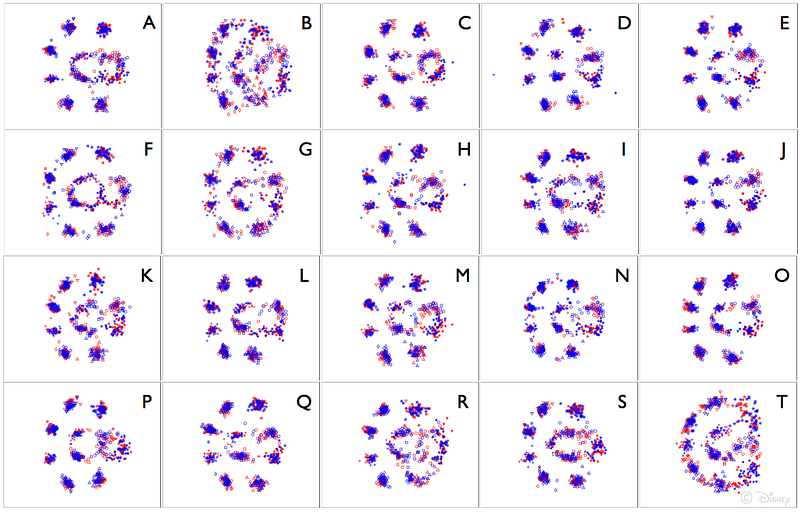
By disentangling player positions and generating dynamic roles, the authors obtain labels to represent the mean formations for each match and team. The formations of the 20 teams (A-T) are visualized, with red indicating home performances and blue indicating away performances. Most teams tend to play the same formation, with slight variations in certain positions. Only teams B and T show noticeable variations across the season, while others have minor changes in the midfield. The dominant formation observed is 4–4–2, with some teams altering the midfield. One team experiments with a back three consistently in both home and away performances.
Formation Style Analysis
The authors then try to analyze the style of play based on team formations. They investigate how teams play their formations, specifically examining their attacking and defensive behaviors when in possession and when the opponent is in possession. The analysis considers the centroid of each formation and compares the behavior of teams at home and away matches.
The results reveal that most teams adopt a more forward position when playing at home compared to away matches, both in attack and defense. This indicates that teams tend to have more players in advanced positions at home, leading to increased possession in the forward third of the field. Additionally, when defending higher up the pitch, teams are more likely to regain possession in advanced areas. However, this tactical approach leaves space exposed behind the defensive line, making teams susceptible to counter-attacks.
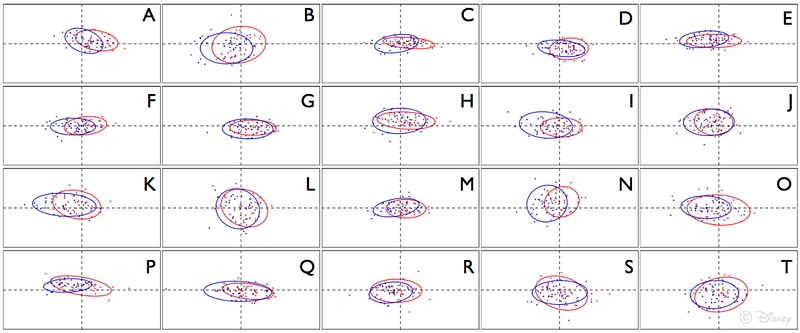
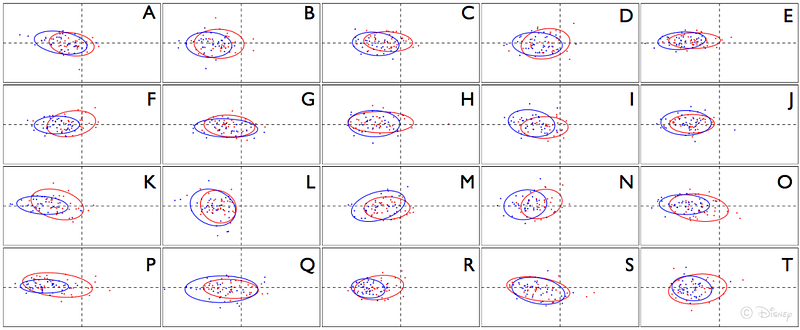
Figure 7. Plots of the mean position of the team when they were in (a) possession, and (b) when the opposition were in possession. The red ellipses refer to their behavior when they were at home and the blue ellipses when they played away.
The advantage of this tactic is that it allows the home team to win the ball in advanced positions, closer to the opponent’s goal, potentially resulting in more shots and goals, considering the shooting accuracy is similar. Furthermore, by conserving energy, home teams can sustain longer and more effective attacks. The implications of this finding are significant, as teams with lower energy expenditure can maintain prolonged periods of offensive pressure.
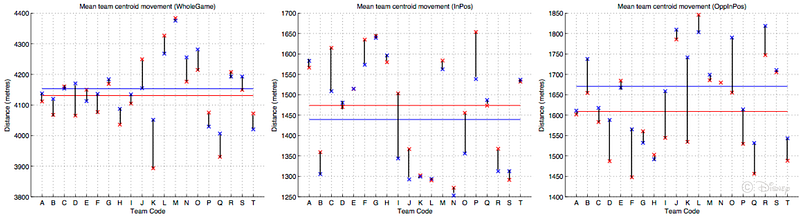
To further illustrate the differences between home and away matches, the authors examine the distance covered by teams. The analysis reveals that home teams generally run shorter distances compared to away teams, indicating a more energy-efficient approach. This supports the notion that conserving energy allows teams to sustain attacks and potentially have a competitive advantage in terms of longer periods of ball possession and goal-scoring opportunities.
Match Summarization via Formation Visualization
The conventional halftime statistics provided during live broadcasts are often limited and fail to provide a comprehensive understanding of how the teams are playing and executing their formations. While possession statistics over the last 5 minutes can indicate which team is dominating, they lack information about the spatial aspects of the game.
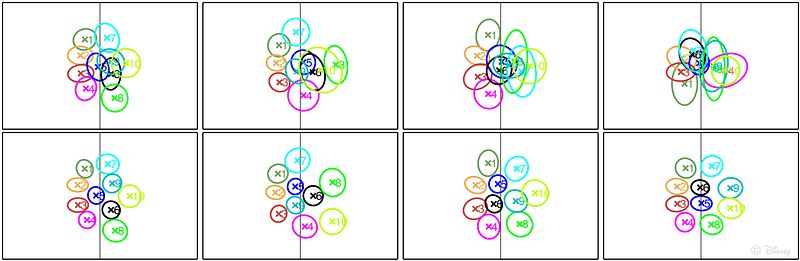
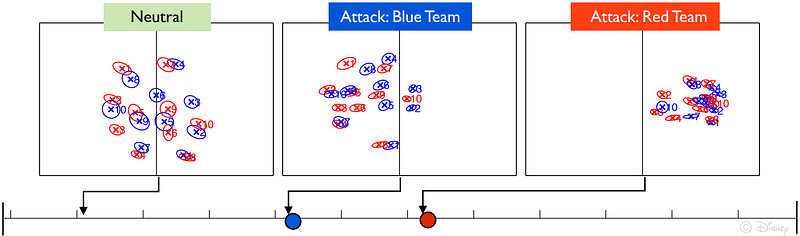
To overcome this limitation, the authors leverage their formation detection approach to dynamically visualize the match’s progression. They use a sliding window of 5 minutes to analyze the formations being played and their spatial relationships relative to the opposing team. The resulting formation visualization provides a filmstrip-like representation of the match, capturing the changes in formations and their positions over time.
By incorporating this approach, broadcasters and viewers can quickly gain insights into how the match is being played and understand the strategic decisions made by the teams. The formation visualization enhances the understanding of gameplay dynamics and provides a more informative summary of the match, going beyond traditional halftime statistics.
Figure 9 in the paper demonstrates the effectiveness of this approach by showcasing a filmstrip of the match’s formation visualization, highlighting the evolving formations and their spatial relationships throughout the match.
Summary and Future Work
In this paper, the authors introduced a novel method for automatically detecting and visualizing formations using soccer player tracking data. They applied this method to analyze an entire season’s worth of data from a top-tier professional league, aiming to investigate whether formations played by teams can explain the home advantage phenomenon.
The analysis revealed that most teams tended to adopt the same formation regardless of whether they were playing at home or away. However, there were significant differences in how they executed the formation. Specifically, teams played with a higher line and more advanced positions when at home, while adopting a more conservative and deeper defensive approach when playing away. This finding supports the belief that teams strive to win their home games and secure draws in away games.
Additionally, the authors demonstrated that their formation visualization method can effectively summarize a game, providing insights into dominance and tactics employed by the teams. By visually representing the formations and their dynamics, this approach enhances the analysis of team behavior and contributes to a deeper understanding of gameplay.
The automatic formation detection method developed in this research is groundbreaking, as it is the first of its kind. In future work, the authors aim to leverage the formation information as contextual features to enhance short-term prediction tasks, such as predicting the next pass. They also plan to explore the utilization of formations for discovering unique patterns used by teams in offensive and defensive situations, potentially uncovering discriminative strategies employed by successful teams.
Overall, this research provides valuable insights into the relationship between formations, team performance, and the home advantage phenomenon. The automatic formation detection method opens up avenues for further analysis and prediction tasks, contributing to advancements in soccer analytics and understanding team behavior on the field.
References
- Bialkowski, A., Lucey, P., Carr, P., Yue, Y., & Matthews, I. (2014, February). Win at home and draw away: Automatic formation analysis highlighting the differences in home and away team behaviors. In Proceedings of 8th annual MIT sloan sports analytics conference (pp. 1–7). https://citeseerx.ist.psu.edu/document?repid=rep1&type=pdf&doi=c932441f8ecc9348e2dd54ec749984c8f4abf224


