

Here’s A Little Guide To Picking Stocks That Make Real Money
The following article is from my Substack newsletter. I will be glad if you check it out.
Hey there!
This is the guide that I use to pick the best stocks to invest in.
All of the advice is backed by personal actions and years of continuous learning.
For starters, I hold most of my savings in the form of stocks and cryptocurrencies.
Believe me, you don’t want to be taking advice from someone who holds 1 penny-worth of ‘Starbucks’ stock or has made $10 dollars, day-trading LUNA. There are plenty of them on the internet!
Why Do I Invest So Much In Stocks?
The answer to this question is simple:
Ownership of assets is the only way to financial freedom.
No one has ever done it by exchanging their time for money.
Before I tell you my top 5 factors that I look at when picking stocks, let’s understand a fundamental concept that is the basis of my stock-picking strategy.
This is — Economic Moat.
Economic Moat
Have you ever seen old castles and noticed that most of the majestic ones are surrounded by a water body?
Ever wondered why?

This water body is called a Moat.
As per the Wikipedia definition, a moat is a deep, broad ditch, either dry or filled with water, that is dug and surrounds a castle to provide it with a preliminary line of defense.
Similar to the moats surrounding castles, companies/ businesses have economic moats surrounding them.
Identifying these can be your biggest unfair advantage when investing.
Think about the Economic moat as a company’s competitive advantages that let it thrive in the turbulent market.
Characteristics of Moat
Let’s consider planning an attack on a castle.
One would have to cross the castle’s moat to attack it.
What did historical architects do to guard against these? They built them wide and deep.
Width
The width of an economic moat is the extent of a company’s competitive advantage.
A wide moat implies that a company has a significant edge over its competitors, making it difficult for them to enter or compete in the market.
Depth
The depth of an economic moat is the durability/ sustainability of a company’s competitive advantage.
A deep moat tells how long the company’s competitive advantage is likely to persist.
A one-liner:
As an investor, your goal should be to identify companies with a wider and deep economic moat.
This is how companies build strong economic moats:
- Sell Products With Perceived Higher Value (LVMH, Ferrari, Hermes)
- Sell Products That Customers Can’t Switch Around Easily (Apple, Microsoft, Amazon, Stryker)
- Strong Network Effects (Facebook, eBay, Alibaba, Amazon)
- Hold Numerous Intangible Assets such as patents (Pfizer, AstraZeneca)
- Economies of Scale (Walmart, Apple, P&G, Coca-Cola)
If you want to learn about Economic Moats in more detail, check out this article here:
Now that we are familiar with this concept, let’s learn the 5 factors that signal strong economic moats.

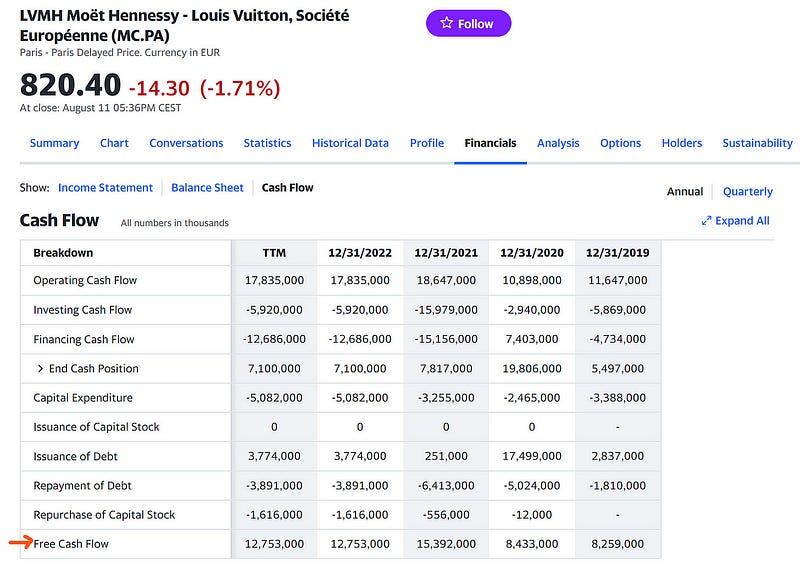
1. Free Cash Flow
This metric can be found on the Cash flow statement of a company.
This is the money a company has left over after paying its:
- Operating expenses: Expenses that a business incurs through its normal business operations
- Capital expenditures: Money invested by a company to acquire or upgrade fixed, physical or non-consumable assets + intangible assets
In easy words, it is all the sales money left with a company after it has paid for its business expenses.
A company with high free cash flow can:
- Expand its business
- Buyback its own stocks
- Invest in assets with high rates of returns
- Pay dividends to its shareholders
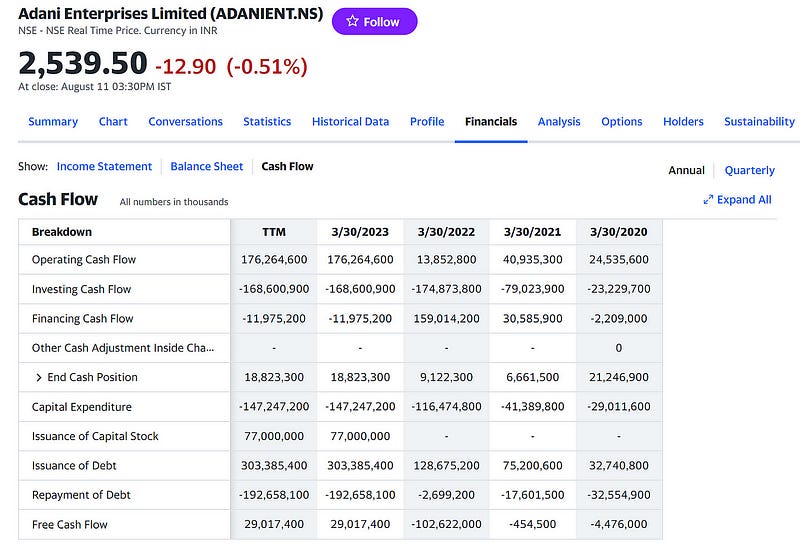
A company with consistently high and rising free cash flow has a strong economic moat.
Here is a comparison of LVMH’s Free Cash Flow with Adani Enterprises Limited.
2. Return on Assets (ROA) & Return on Equity (ROE)
Return on assets (ROA) is a metric that indicates how profitable a company is in relation to its total assets.
ROA = Net Income/ Total Assets
Return on Equity (ROE) is a metric that indicates how profitable a company is in relation to its shareholders’ equity.
ROE = Net Income/ Total Equity
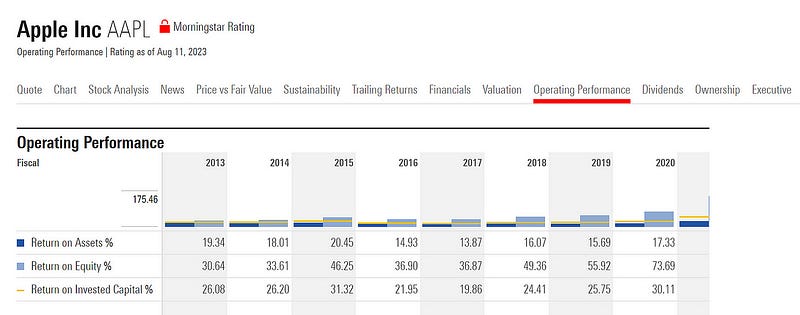
A consistently rising ROA & ROE (preferably >10%) means that a company is very efficient in generating income from its assets and shareholders’ money.
3. Net Income Growth
Net income is the amount a company makes after deducting costs, allowances and taxes.
Net Income = Total Revenue — Total Expenses
This metric reflects how effectively a company is able to hold a big portion of all the revenue that it obtains.
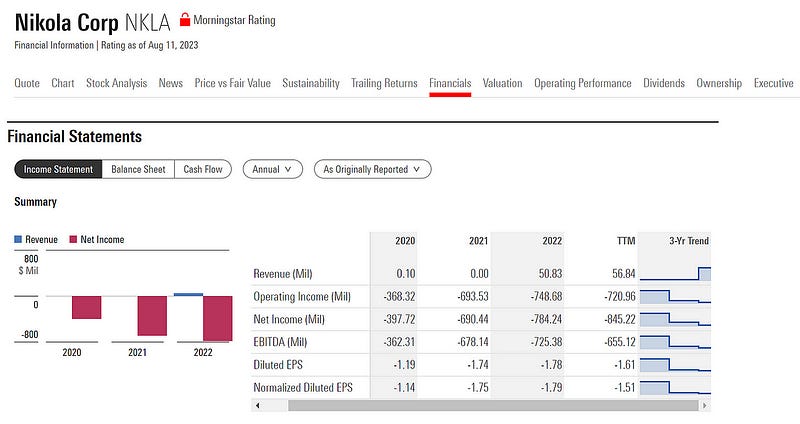
Consistently rising Net Profits point towards an economic moat (check 3 years, 5 years and 10 years average).
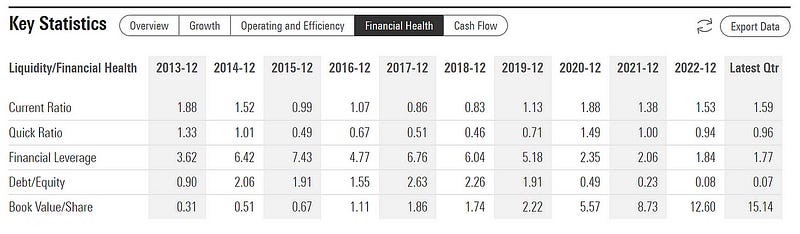
4. Debt/ Equity Ratio
The debt-to-equity ratio (D/E ratio) shows how much debt a company has compared to its assets.
D/E Ratio = Total debt/ Total shareholders’ equity
A higher D/E ratio means the company is having a harder time covering its liabilities and has a lot of owed money.
A debt-to-equity ratio below 1 is preferable.
Filter out companies that have rising debt-to-equity ratios over the long term.
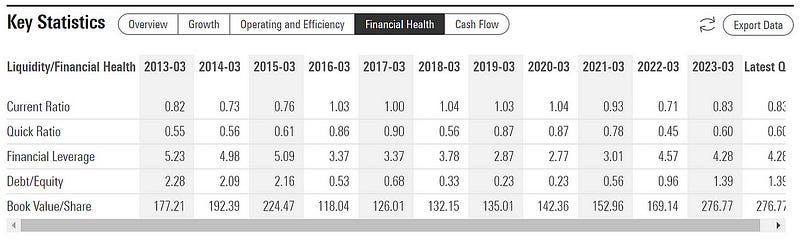
Companies with this ratio going down over the long term are great picks.
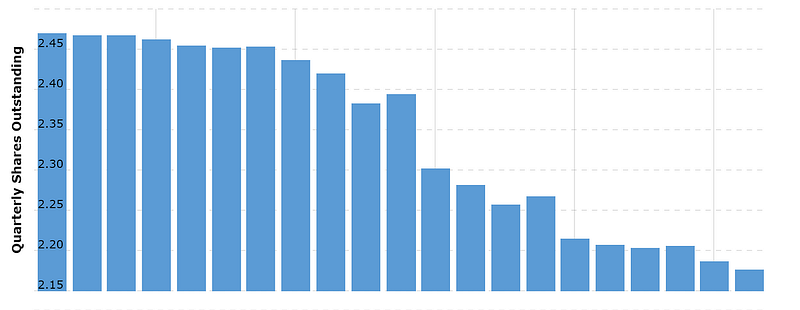
5. Number of Shares Outstanding
Outstanding shares refer to a company’s stock currently held by all its shareholders.
Outstanding Shares = Company’s market capitalization / Current share price
If this number is increasing, the company is either:
- issuing new shares to buy other companies (acquisitions are largely not profitable for a company)
- splitting stocks
- granting numerous Options to employees and executives
If this number is decreasing, the company is buying back its own shares. This increases shareholders’ stake in the company and the amount they derive from future dividends.
Consistently increasing Outstanding shares at >2% per year is a big red flag.
P.S. This lesson does not recommend investing in the above stocks and is purely for educational purposes. Copying investing strategies is a disastrous investing mistake as personal circumstances vary.