
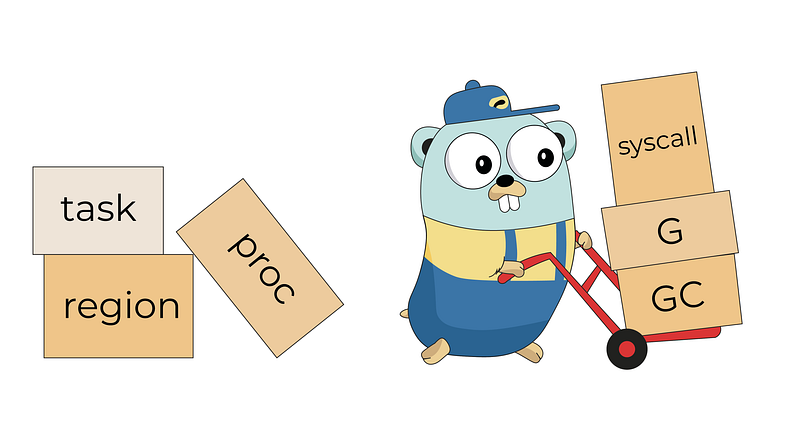
Go: Discovery of the Trace Package
ℹ️ This article is based on Go 1.13.
Go provides us a tool to enable tracing during the runtime and get a detailed view of the execution of our program. This tool can be enabled by flag -trace with the tests, frompprof to get live tracing, or anywhere in our code thanks to the trace package. This tool can be even more powerful since you can enhance it with your own traces. Let’s review how it works.
Flow
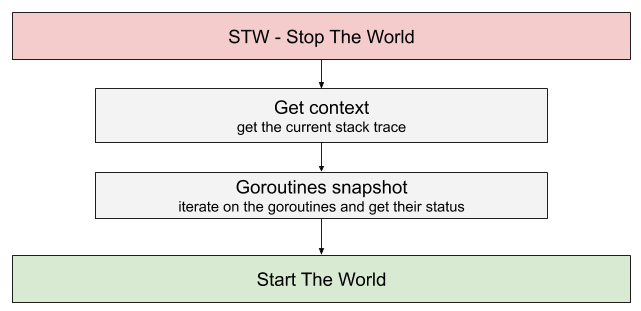
The flow of the tool is quite straightforward. Each event, such as memory allocation; all the phases of garbage collector; goroutines when they run, pause, etc. is statically recorded by the Go standard library and formatted to be displayed later. However, before the recording starts, Go first “stops the world” and takes a snapshot of the current goroutines and their states.
You can find more details about this phase in my article “Go: How Does Go Stop the World?”
This will later allow Go to construct the cycle of life of each goroutine properly. Here is the flow:
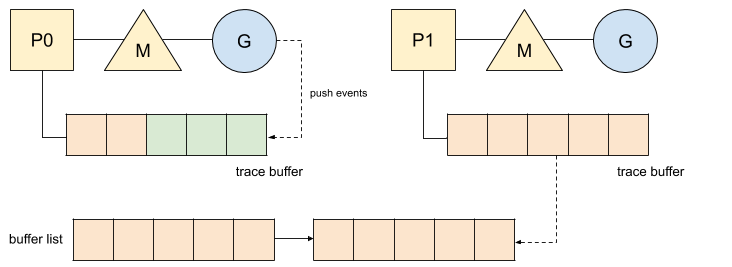
Then, collected events are pushed to a buffer that is later flushed to a list of full buffers when the max capacity is reached. Here is a diagram of this flow:
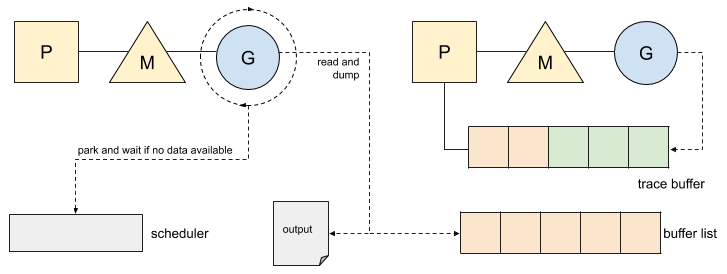
The tracer now needs a way to dump those traces to the output. For that, Go spawns a goroutine dedicated to that when the tracing starts. This goroutine will dump data when available and will park the goroutine until the next ones. Here is a representation of it:
The flow is now pretty clear, so let’s review the recorded traces.
Traces
Once the tracing is generated, the visualization can be done with running the command go tool trace my-output.out. Let’s take some traces as example:
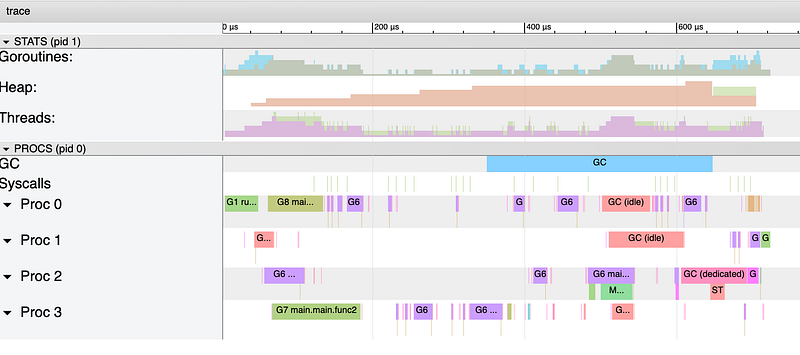
Most of them are quite straightforward. The traces related to the garbage collector stand under the blue trace GC:
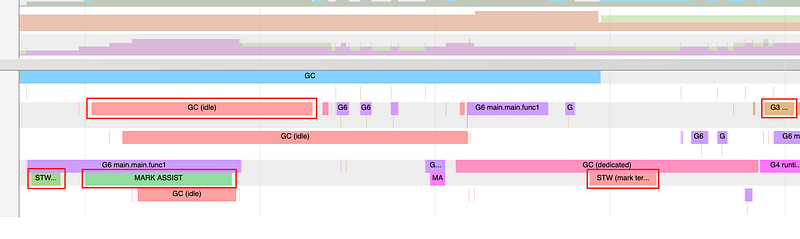
Here is a quick review:
STWare the two “Stop the World” phases in the garbage collector. During these two phases the goroutines are stopped.GC (idle)are the goroutines that mark the memory when they do not have work to do.MARK ASSISTre the goroutines that help mark the memory during allocations.GXX runtime.bgsweepis the memory sweep phase once the garbage collector is done.GXX runtime.gcBgMarkWorkerare the dedicated background goroutines that help mark the memory.
You can find more information about those traces in my article “Go: How Does the Garbage Collector Watch Your Application?”
However, some traces are not easy to understand. Let’s review them to get a better understanding:
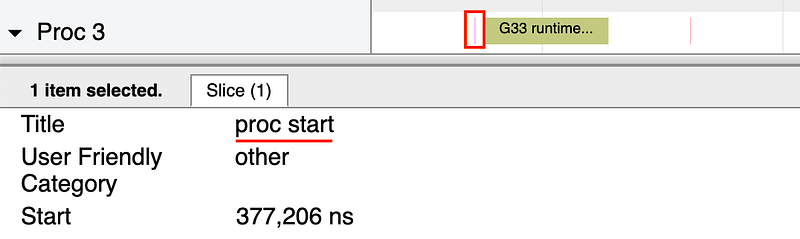
proc startis called when a processor is associated with a thread. It happens when a new thread is started or when we resume from a syscall.
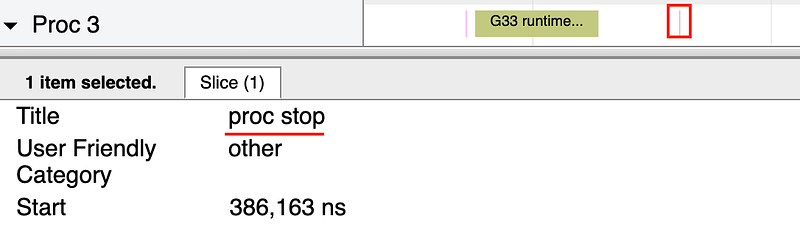
proc stopis called when a thread is disassociated from the current processor. It happens when the thread is blocked in a syscall or when a thread exits.
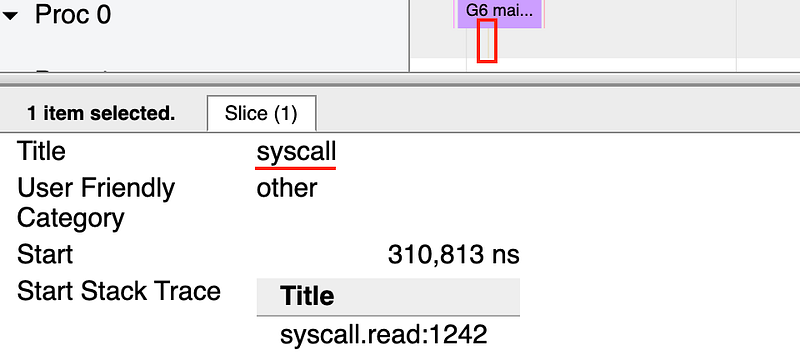
syscallis called when a goroutine is making a system call:
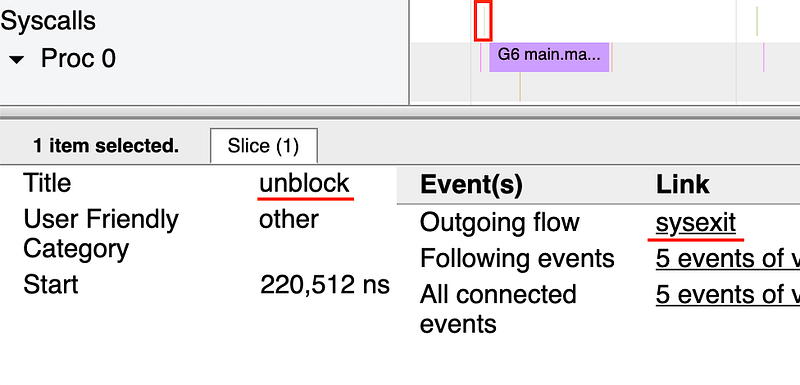
unblockis called when a goroutine is unblocked from a syscall — the label(sysexit)would be displayed in that case, from a blocked channel, etc:
The traces can be enhanced since Go allows you to define and visualize your own trace along with the ones from the standard library.
User traces
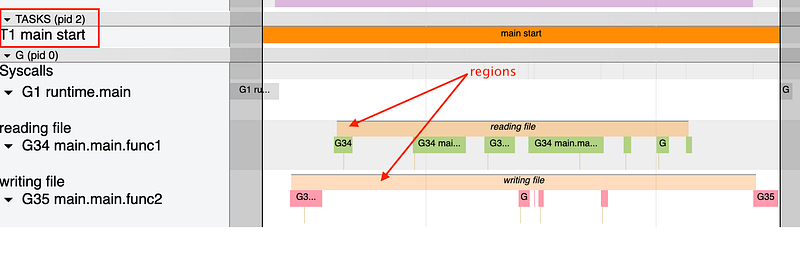
The traces we can define have two hierarchical levels:
- at the top level with the task, with a start and an end.
- at a sub level with the region.
Here is a simple example of them:
Those new traces can be visualized directly from the tool via the menu User-defined tasks:
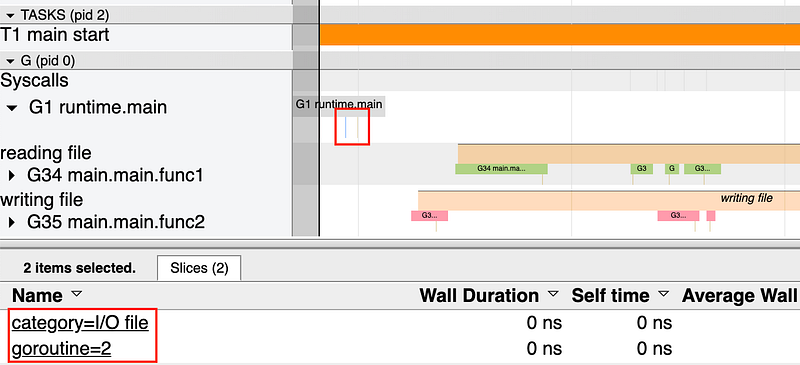
It’s also possible to record some arbitrary log to the task:
ctx, task := trace.NewTask(context.Background(), "main start")
trace.Log(ctx, "category", "I/O file")
trace.Log(ctx, "goroutine", "2")
Those logs will be found under the goroutine that sets up the task:
The tasks can also be embedded in other tasks by deriving the context of the parent task and so on.
However, tracing all those events live from production — thanks to pprof — could slightly deteriorate the performance while you are collecting them.
Performance impact
A simple benchmark could help to understand the impact of the tracing. One will run with the flag -trace and another one without. Here are the results with a benchmark of the function ioutil.ReadFile() that generates quite a lot of events:
name         time/op
ReadFiles-8  48.1µs ± 0%
name time/op
ReadFiles-8 63.5µs ± 0% // with tracingIn this case, the impact is about ~35% and could vary depending on the application. However, some tools such as StackDriver allows having continuous profiling on production while keeping a light overhead on our application.


