
Go: How Does the Garbage Collector Watch Your Application?

ℹ️ This article is based on Go 1.13.
The Go garbage collector helps developers by automatically freeing the memory of their programs when it is not needed anymore. However, keeping track of the memory and cleaning it could impact the performances of our programs. The Go garbage collector has been designed to achieve those goals, and focus on:
- reducing as much as possible in the two phases when the program is stopped, also called “stop the world.”
- a cycle of the garbage collector that takes less than 10ms.
- the garbage collection cycle should not take more than 25% of the CPU.
These are ambitious objectives, and the garbage collector will be able to achieve them if it learns enough from our programs.
Heap Threshold Reached
The first metric the garbage collector will watch is the growth of the heap. By default, it will run when the heap doubles its size. Here is a simple program that allocates memory in a loop:
The traces show us when the garbage collector is triggered:
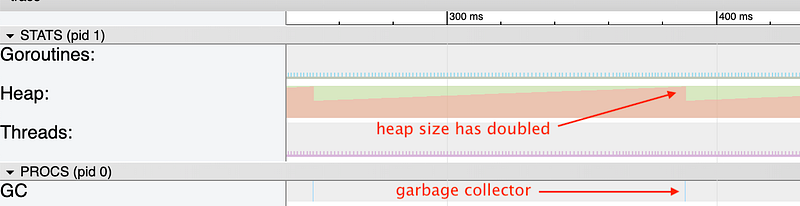
As soon as the heap doubles its size, the memory allocator will trigger the garbage collector. This can be confirmed with the GODEBUG=gctrace=1that prints information about the cycles:
gc 8 @0.251s 0%: 0.004+0.11+0.003 ms clock, 0.036+0/0.10/0.15+0.028 ms cpu, 16->16->8 MB, 17 MB goal, 8 Pgc 9 @0.389s 0%: 0.005+0.11+0.007 ms clock, 0.041+0/0.090/0.11+0.062 ms cpu, 16->16->8 MB, 17 MB goal, 8 Pgc 10 @0.526s 0%: 0.046+0.24+0.014 ms clock, 0.37+0/0.14/0.23+0.11 ms cpu, 16->16->8 MB, 17 MB goal, 8 PThe cycle 9 is the one we have seen previously that runs at 389ms. The interesting part is 16->16->8 MB that shows how much memory was in use before the garbage collector and how much will be live after the garbage collector. We clearly see that the cycle 9 has been triggered at 16MB when the cycle 8 reduced the heap to 8MB.
The ratio of this threshold is defined by the environment variable GOGC that is set to 100% by default — it means the garbage collector starts when the heap size increased by 100%. For performance reason, and in order to avoid constantly starting a cycle, the garbage collector will not be triggered if the heap size is lower than 4MB * GOGC — when GOGC is set to 100%, it will not trigger under 4MB.
Time Threshold Reached
The second metric the garbage collector is watching is the delay between two garbage collectors. If it has not been triggered for more than two minutes, one cycle will be forced.
The traces given by GODEBUG shows that a cycle is forced after two minutes:
GC forced
gc 15 @121.340s 0%: 0.058+1.2+0.015 ms clock, 0.46+0/2.0/4.1+0.12 ms cpu, 1->1->1 MB, 4 MB goal, 8 P
Required Assistance
The garbage collector is composed of two main phases:
- marking the memory that is still in-use
- swapping the memory that has not been marked as in-use
During the marking phase, Go has to be sure it will mark the memory faster than it will make new allocations. Indeed, if the collector is marking 4Mb of memory while, for the same period of time, the program is allocating the same amount of memory, the garbage collector would have to trigger as soon as it is finished.
In order to address this issue, Go tracks the new allocations while marking the memory and watch when the garbage collector is in debt. The first step starts when the garbage collector is triggered. It will first prepare one goroutine per processor that will sleep, waiting for the marking phase:
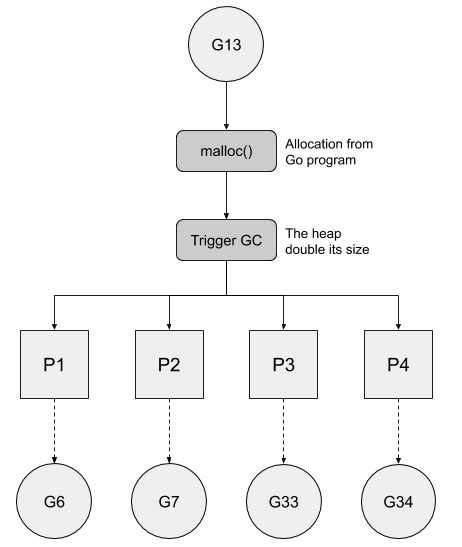
The trace can show those goroutines:
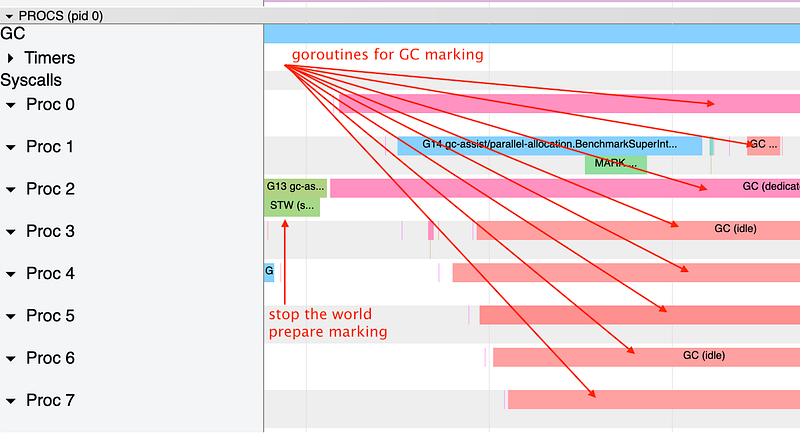
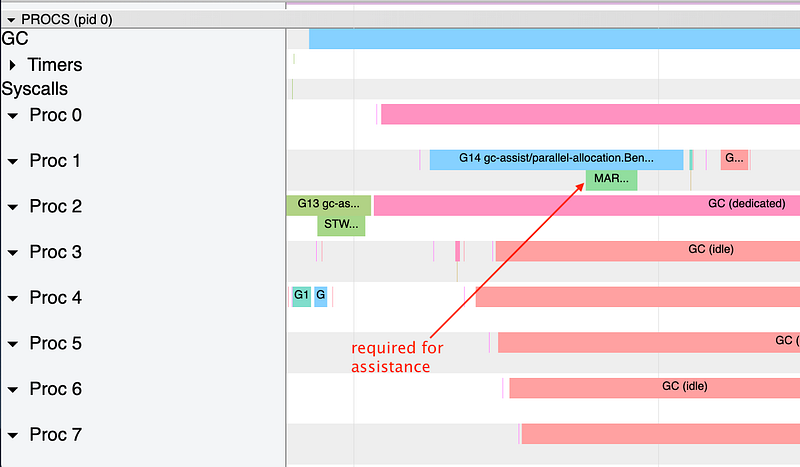
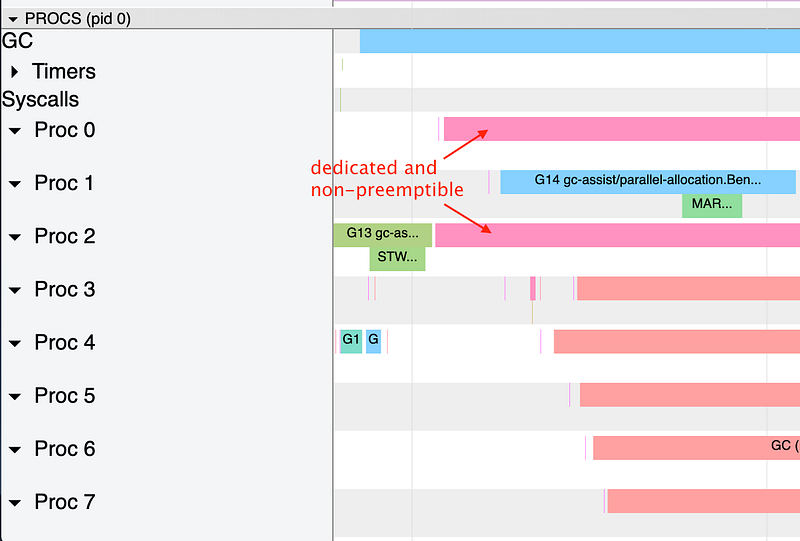
Once those goroutines spawned, the garbage collector will start the marking phase that will check which variable should be collected and swept. The goroutines marked GC dedicated will run marks without preemption while the ones marked as GC idle are working since they do not have anything else. Those ones can be preempted.
The garbage collector is now ready to mark the variable not in-use anymore. For each variable scanned, it will increase a counter in order to keep track of the current work and be able to get the picture of the remaining work as well. When a goroutine is scheduled for work during the garbage collection, Go will compare the required allocation to scanning done already in order to compare the pace of the scanning and the requirement in allocation. If the comparison is positive for the scanning, the current goroutine does not need to help. On the other hand, if the scanning is in debt compared to allocation, Go will use the goroutine for assistance. Here is a diagram that reflects this logic:
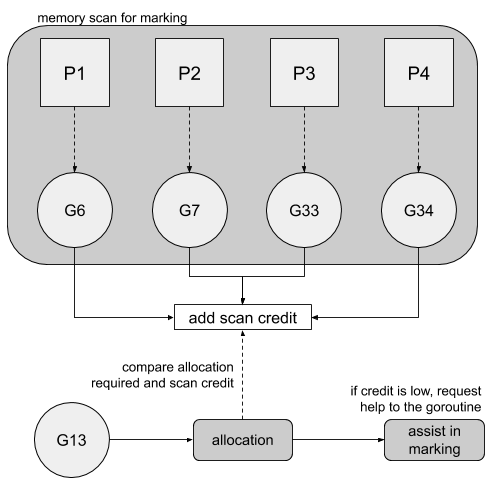
In our example, the goroutine 14 has been requested for work since the balance scanning / allocation was negative:
CPU limitation
One of the goals of the Go garbage collector is to not take more than 25% of the CPU. This means that Go should not allocate more than one processor out of four during the marking phase. It is actually exactly what we have seen in the previous example with only two goroutines, out of eight processors, fully dedicated to the garbage collection:
As we have seen, the other goroutines will work for the marking phase only if they have nothing else to do. However, with the assist requests from the garbage collector, Go programs could end up with more than 25% of the CPU dedicated to the garbage collector for a peak time, as we can see with the goroutine 14:
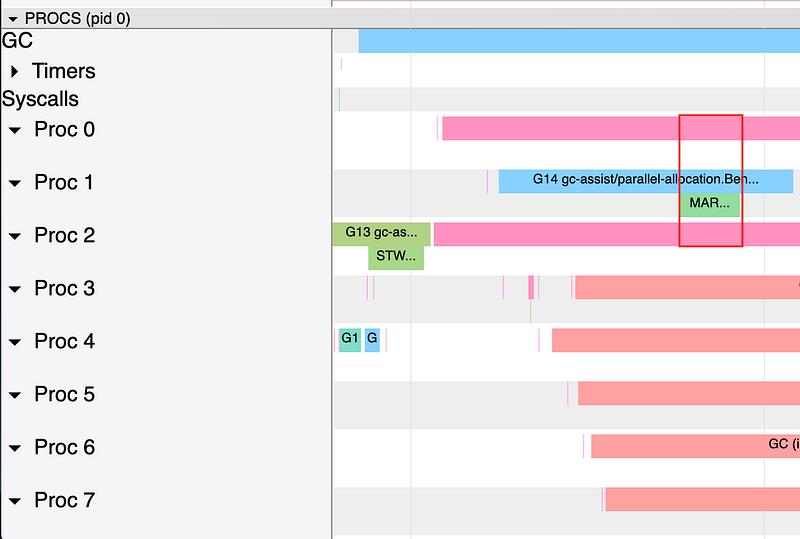
In our example, during a short period of time 37.5% of our processors (three out of eight) are allocated for the marking phase. This might be rare and would happen only in the case of high allocations.


