
WEEKLY BUSINESS ROUNDUP
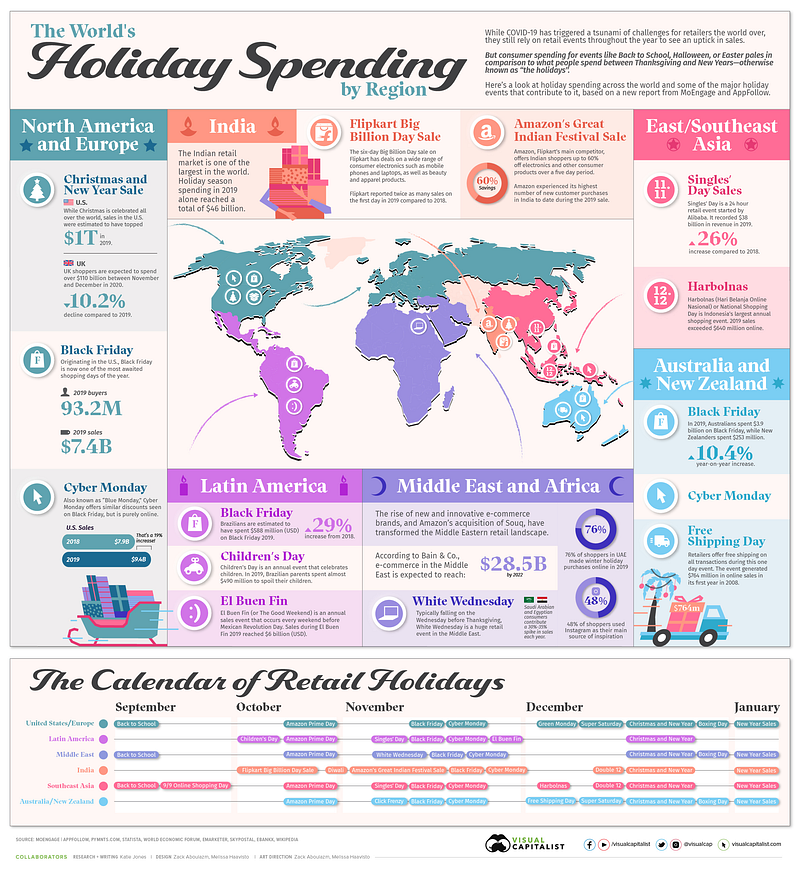
Global Business Week: World’s Holiday Spending by Region
The state of Financial markets & Economies, Weekly Charts, Business Trends & Statistics
Despite headwinds from COVID-19, all three of the major U.S. equity market indices finished the month higher and returned double-digit percentages for the year. The S&P 500 was up 27% for the year. The Dow was over 18% higher for the year, and the Nasdaq was up 21%. The S&P 500 Index set 70 all-time highs during the year, which is the most in a single year since the 77 that was carved out in 1954. In the bond market, the 10-year Treasury yield ended a shortened session flat at 1.51%, just below the 50-day moving average of 1.52%.
However, the U.S stocks closed out the last trading day of 2021 lower, as concerns about the omicron variant of COVID-19 dogged markets. Gains weren’t widely shared in the S&P 500 as just five of the biggest stocks — Microsoft, NVIDIA, Apple, Alphabet, and Tesla accounted for more than half of the index’s gain since April. Heading into the new year, some investors could be looking forward to the “January Effect.” Since 1928, January has historically been a strong month for stocks.
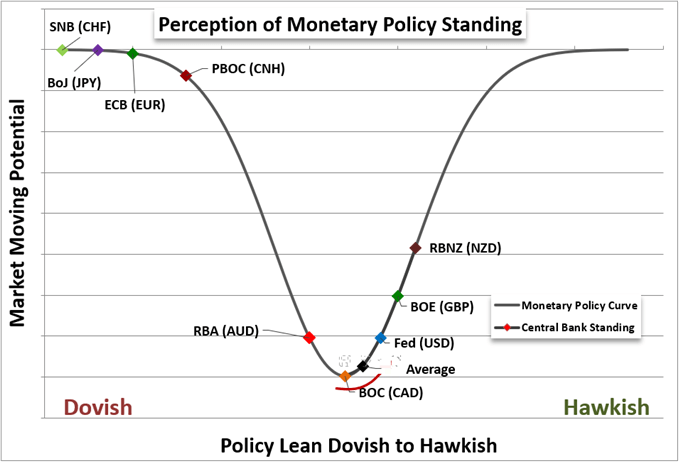
As many of the major central banks, led by the Federal Reserve have pivoted towards tapering off the stimulus provided in the wake of the pandemic, the U.S dollar has gained from the hawkish stance. The benchmark dollar index (DXY) closed the year @ 95.67 — just below the high of 96.90 reached about two weeks ago. This shift in monetary policy tempo in the second half of 2022 has been necessitated by persistent inflation. As a carry currency, the Dollar has a lot of ground to lose after the Dollar’s charge through the second half of this past year. However, if we slide into a broad-based risk aversion period, the Greenback may revert to its more rudimentary role of s safe haven.
Although it has been a good year for the digital assets with many aspects of the blockchain movement maturing while others emerged — cryptocurrencies fizzled out towards the end of the year. The leader of the crypto pack, Bitcoin, posted an all-time high (ATH) of around $69k in early November before closing out the year just below $46k. Ethereum, on the other hand, traded at an ATH of over $4850 before receding to less than $3,700 at the year-end. NFTs, DeFi, Stablecoins & other scalable and innovative solutions continued to make the headlines during the year. 2022 will most certainly advance this agenda forward.
Today’s featured infographic above explores holiday spending across the world, as well as some of the major events that contribute to it, based on MoEngage and AppFollow’s Holiday Marketing Guide.
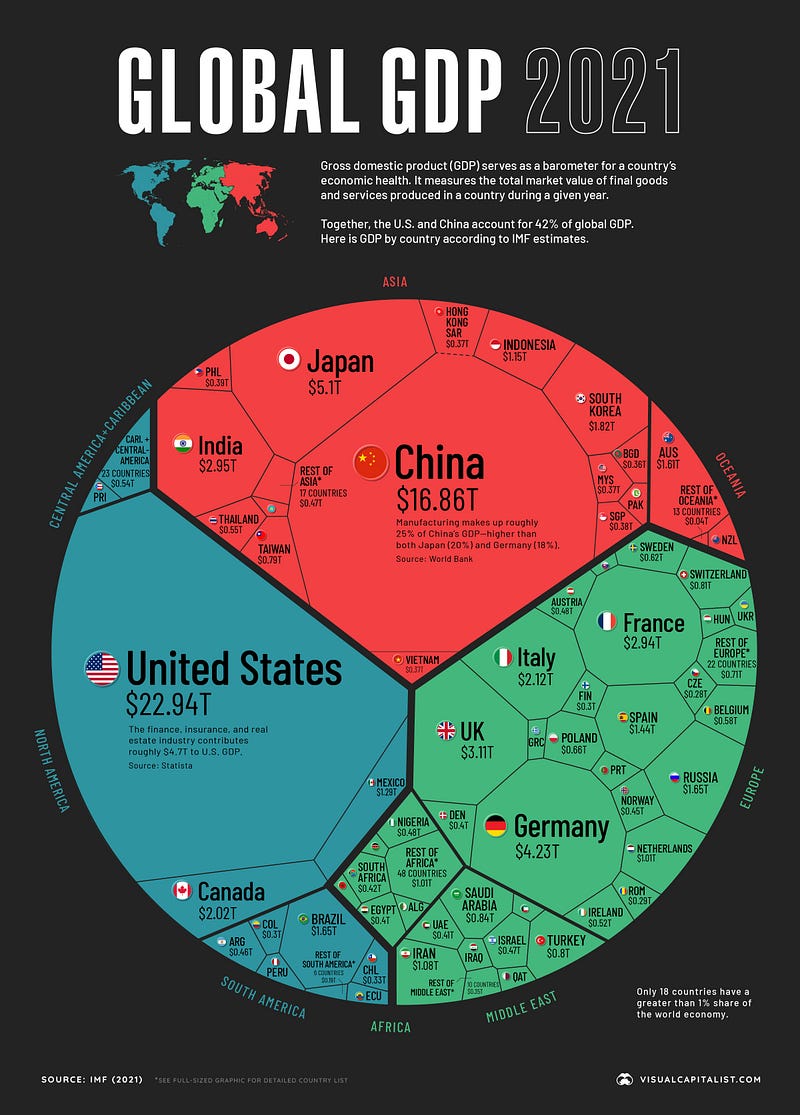
Global GDP 2021
Just four countries — the U.S., China, Japan, and Germany, make up over half of the world’s economic output by gross domestic product (GDP) in nominal terms. In fact, the GDP of the U.S. alone is greater than the combined GDP of 170 countries. How do the different economies of the world compare? In the visualization below (Figure 1) we look at GDP by country in 2021, using data and estimates from the International Monetary Fund (IMF).
GDP serves as a broad indicator for a country’s economic output. It measures the total market value of final goods and services produced in a country in a specific timeframe, such as a quarter or year. In addition, GDP also takes into consideration the output of services provided by the government, such as money spent on defense, healthcare, or education.
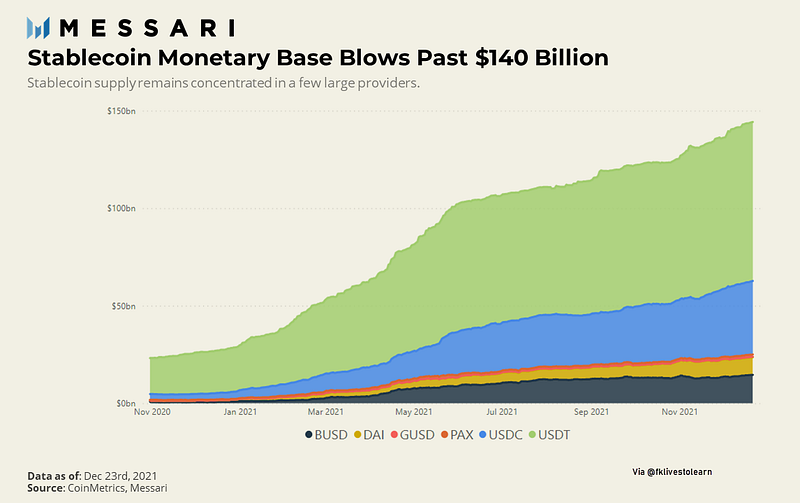
Stablecoin Space continues to Grow
We have recently seen the total stablecoin supply top $140 billion (Figure 2), and Curve’s role as an automated market maker (AMM) is instrumental to these stablecoin users. Curve’s AMM pools use a specialized price curve to concentrate liquidity for pegged asset swaps, making it a choice destination for those looking to swap DAI → USDC, or USDC → USDT for example. Aside from just stablecoins, Curve’s model also allows efficient pegged asset swaps for assets that are designed to be stable relative to one another.
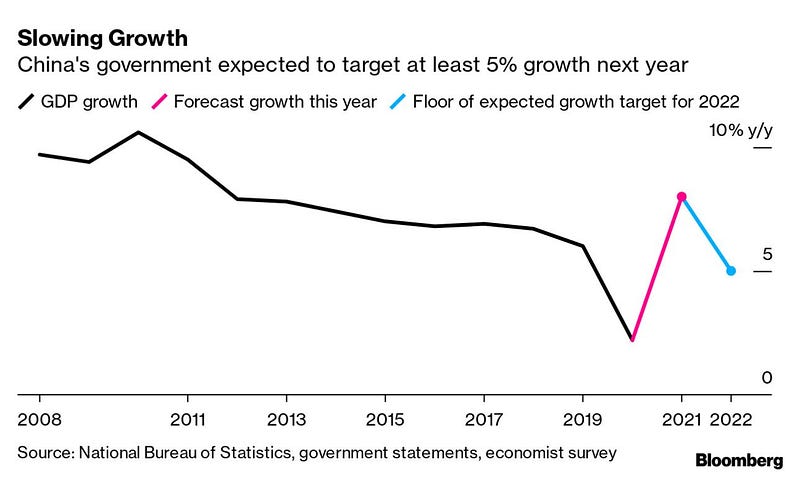
Chinese Growth
Chinese officials are promising to add stimulus to stabilize the nation’s growth next year, with various ministries vowing more proactive measures to reverse the slowdown caused by a worsening property slump, weak consumption and the coronavirus (Figure 3).
Market Humor: Happy New Year

Previous Edition of GBW
Read more stories like this and others by Faisal Khan on Medium.
Stay informed with the content that matters — Join my weekly Newsletter