
WEEKLY BUSINESS ROUNDUP
Global Business Week: Visualizing the Semiconductor Supply Chain
The state of Financial markets & Economies, Weekly Charts, Business Trends & Statistics
U.S equities closed ahead of the Christmas break with a bang, with the S&P 500 carving out a new high. Investors remained optimistic on the latest economic data and some anxiety over the impact of the Omicron COVID variant on global economies was tamped down. Recent approvals by the U.S. Food and Drug Administration for Pfizer & Merck’s antiviral pill bode well for the investors’ confidence. Brent crude futures snapped a three-day rally on Friday on light trading but ended the week higher. At the end of the four-session week, the S&P closed at an all-time high of 4,725.72, while the Dow ended just a bit short of 36K. For the year, the S&P 500 has posted 35 new 52-week highs and the Nasdaq Composite has recorded 62 new highs.
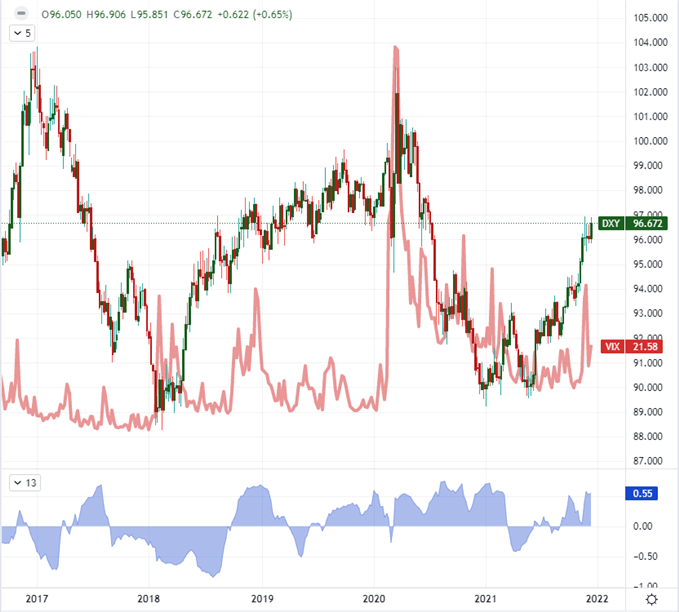
Stingy inflation has caused a shift in the monetary policy tempo through the second half of 2022. This has generally meant gains for the benchmark dollar index (DXY). This has especially been evident in periods of extreme risk aversion where the Greenback shifts into the more rudimentary role of acting as a safe-haven currency. For now, the index has been unable to overtake the resistance at 96.95. As a carry currency, the Dollar has a lot of ground to lose after the Dollar’s charge through the second half of this past year.
Cryptos, which have been generally sliding since the beginning of November, finally saw decent gains on the eve of Christmas — it remains to be seen whether it will be sustainable or just a rebound from the technical lows. Bitcoin has jumped from $45.6k (recent low) to above $50.7k at the time of writing. Ethereum, on the other hand, is trading above $4,060 after charting an earlier low of around $3,640. It has generally been a good year for the digital assets.
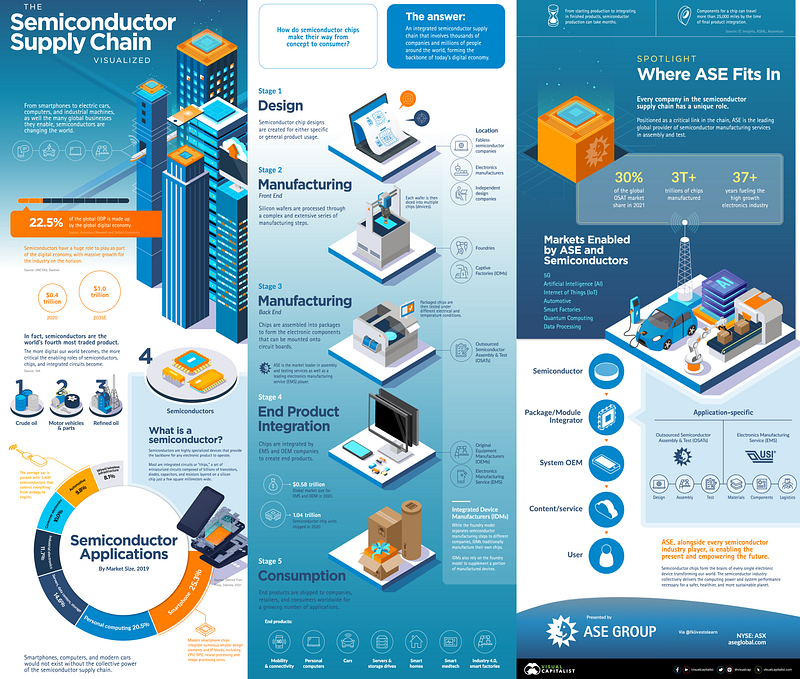
The millions of digital devices we use, from smartphones to electric cars, computers, robotics, and the businesses they enable, only function thanks to the intricate chips built on semiconductors. By some estimates, up to 22.5% of global GDP is made up by the global digital economy. The infographic (above) from ASE Global highlights the complex and global semiconductor supply chain that powers our modern world.
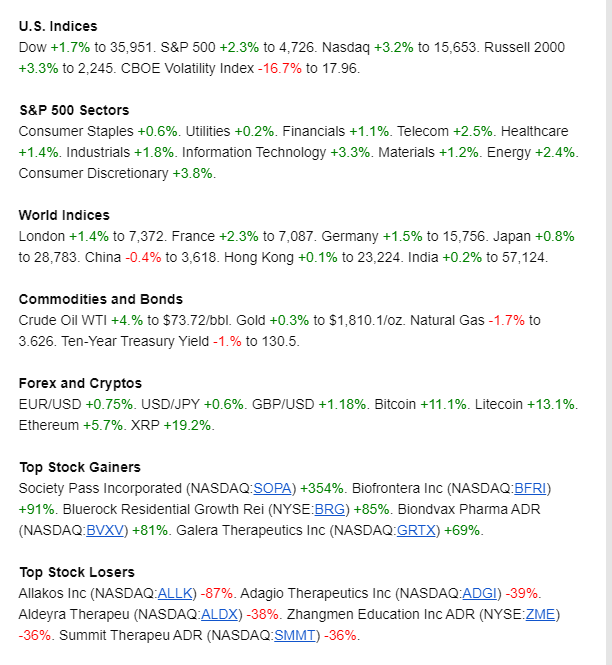
And finally, before moving on to some other statistics, here are the weekly & YTD numbers from various markets and different assets (Figure 1).
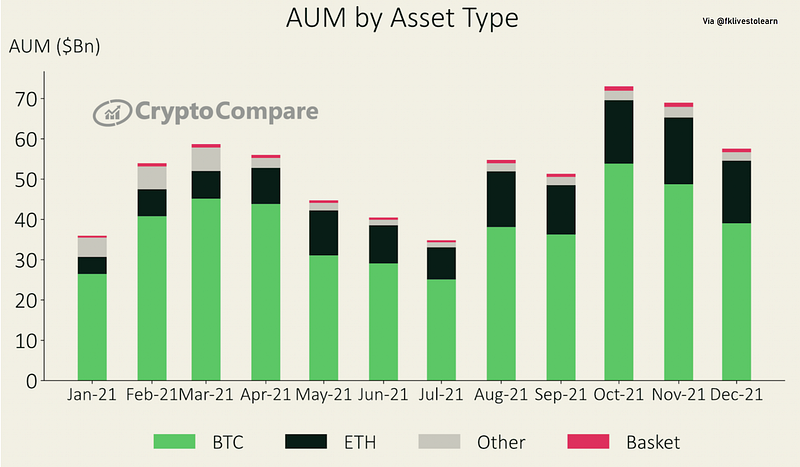
Bitcoin AUM Share Falls
In December, Bitcoin’s Assets Under Management (AUM) fell 19.9% to $39.0 billion (Figure 2). As a result, it lost market share from November (now 67.8% of total AUM vs. 70.6% last month). Ethereum’s AUM also fell 6.3% to $15.6 billion while Other and Baskets’ AUM were $2.1 billion (down 19.9%) and $887 million (down 15.7%), respectively.
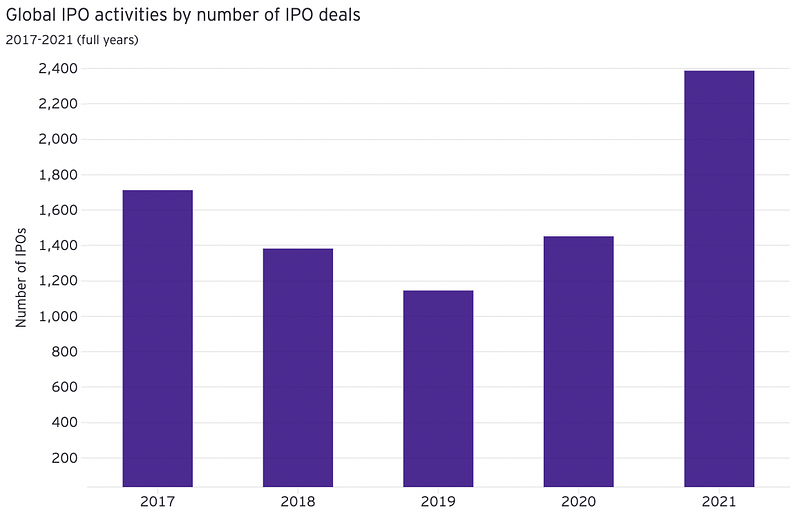
Global IPO Records
2021 was a record-breaking year for initial public offerings (IPOs), according to a report from EY, as global IPO volumes soared 64%, with proceeds jumping by 67%. Overall, there were 2,388 deals globally in 2021, raising a total of more than $450 billion (Figure 3). EY says the fourth quarter of this year was also the most active fourth quarter by global deal numbers since 2007. By region, exchanges in Europe, the Middle East, India, and Africa (EMEIA) experienced the greatest growth in new offerings, with a 158% increase in the number of deals, and a 214% increase in proceeds.
There were 724 IPOs in the region, raising a total of $109 billion. EY says the IPOs in the Americas were hot as well, with 528 IPOs raising a total of $174 billion — an 87% increase for deals, and a 78% increase for money raised. Globally, the technology sector posted the highest number of IPOs, with 611 deals, raising a total of $147 billion. That marks the sixth consecutive quarter that the technology sector led deals. The health care sector was next by volume and proceeds.
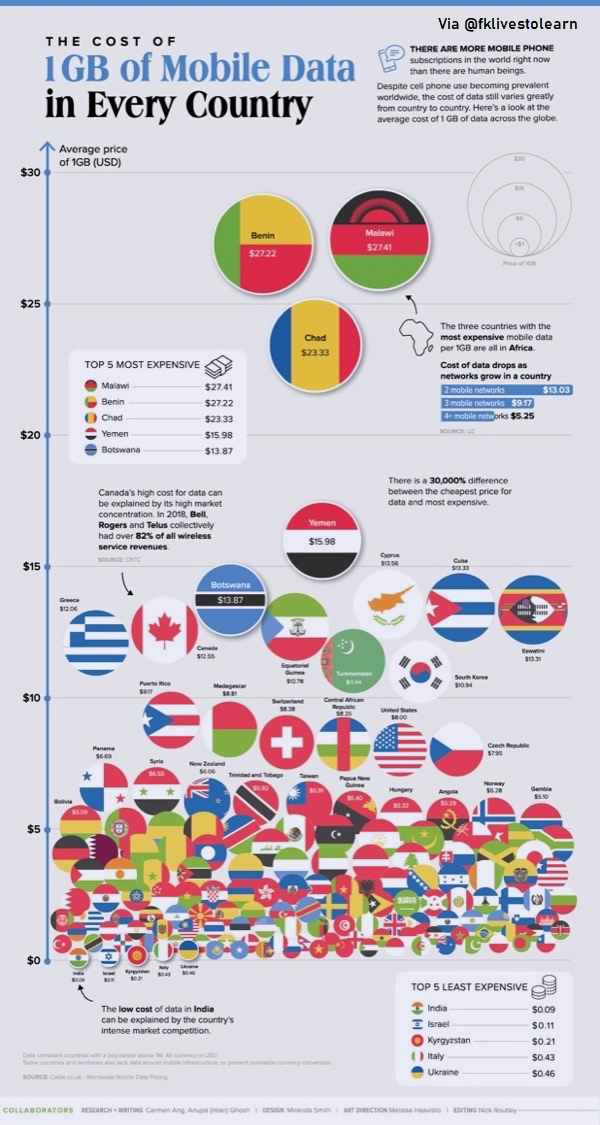
Cost of Mobile Data
The latest infographic created by Toronto-based Jim Harris (Figure 4), details the average cost of 1GB of mobile data in every country worldwide. The average cost of 1GB of mobile data is shown as $12.55 in Canada, while the cheapest is India at $0.09. The most expensive average cost for 1GB of mobile data is in Malawi at $27.41. For customers of Telus-owned Koodo, data overages are billed at $130/1GB, while Bell-owned Virgin Plus charges $137/1GB for data overages. These charges apply if you agree to pay for more data when your plan’s amount is consumed.
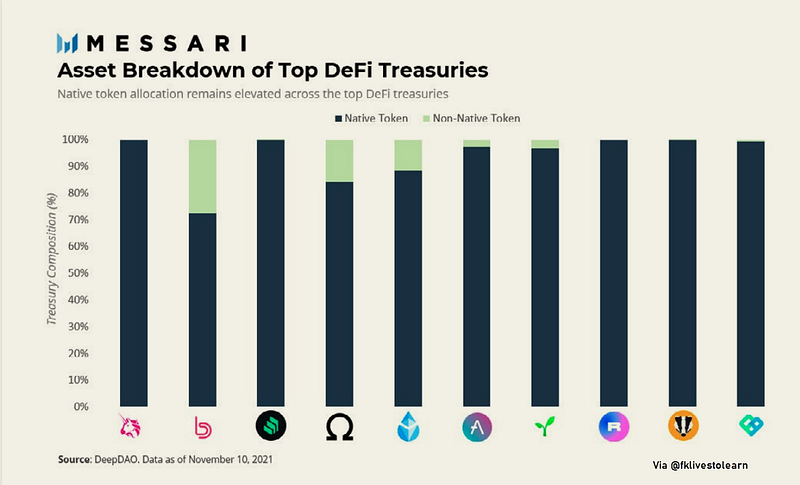
Top DeFi Treasuries
DeFi’s current bull market is one of the top wealth-generating events in crypto’s short history. Any institution or individual with reasonable exposure to the sector watched as their net worth/balance sheet spiked 15–50 fold or more in the past 18 months. Some of the top DeFi protocols themselves are now sitting on hundreds of millions, and sometimes billions, of dollars in value, mostly in their native tokens. Two of the most active DAOs, Uniswap ($4B) and Compound ($1B) sit on particularly large reserves (Figure 5).
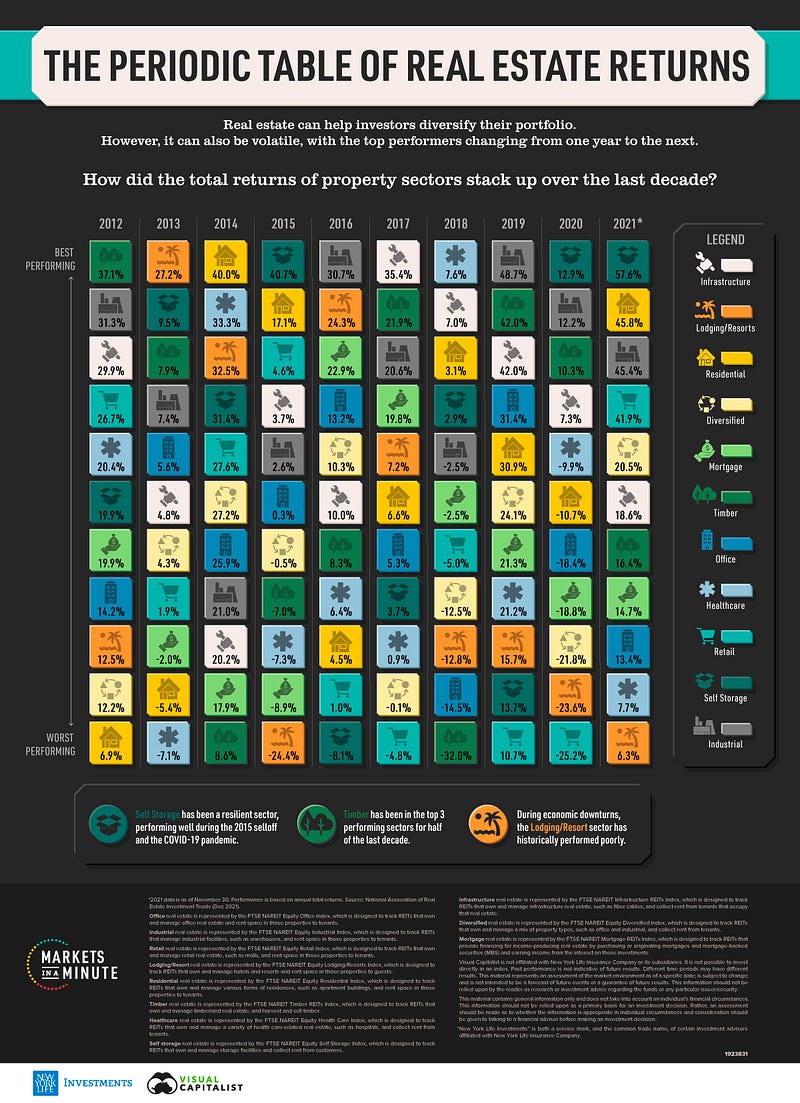
For the ninth year in a row, Americans say real estate is the best long-term investment. However, what might be less clear to the average investor are the different types of investments available within the real estate sector, and how they compare. Real estate return on investment within property sectors has historically been uneven, and 2021 was no exception. While residential property soared, office real estate has performed relatively poorly. This Markets in a Minute chart from New York Life Investments (Figure 6) ranks real estate return on investment by sector over the last decade.
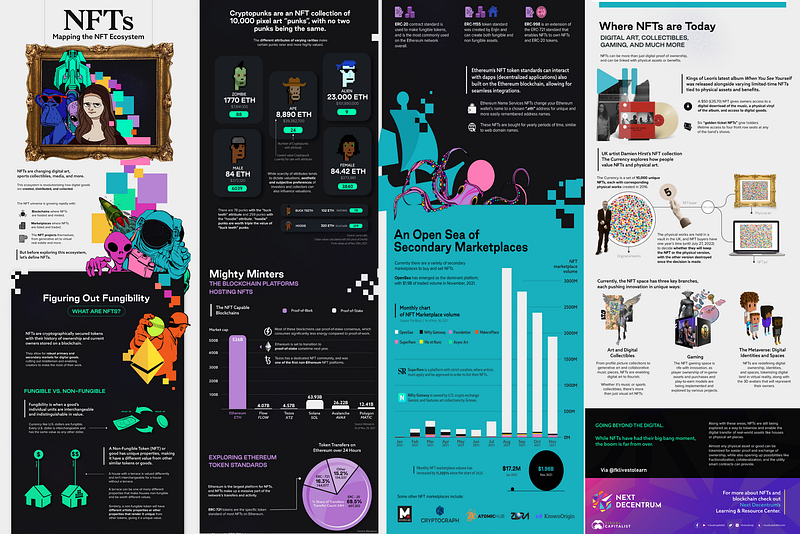
Mapping the NFT Ecosystem
NFTs, or ‘non-fungible tokens’, which can be applied to a broad range of products and services, and but are most notably being linked to digital art, and in particular, digital profile pictures on social networks (PFPs). The NFT movement has now become a key growth aspect of the broader social media space, and while there are many skeptics, and many questions about the long-term viability, and value, of these digital artworks, the growth of NFTs is undeniable, with Twitter, Instagram, and Facebook all exploring new ways to directly integrate NFT art and ownership into their apps. If you are still struggling to get your head around the NFT space, this infographic is for you (Figure 7).
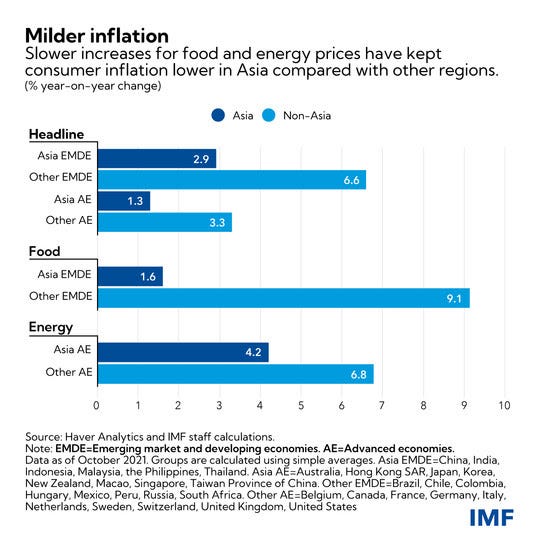
Comparing Inflation Globally
The chart below (Figure 8) shows how Asia’s inflation has been more moderate versus other regions, affording central banks room to keep interest rates low and support economic recovery. However, Asia’s tepid price gains may see greater momentum next year. The outlook remains uncertain, and central banks should be ready to tighten policy if inflation pressures and expectations mount.
Several factors explain Asia’s lower inflation. Among Asia’s emerging economies, a delayed recovery has kept core inflation, which strips out volatile food and energy costs — running at half the rate of peers in other regions. And the cost of food, which makes up about one-third of the consumer price index baskets — grew 1.6% over the past year, versus 9.1% in other regions. This reflects unique factors such as a solid harvest in India, a hog population rebounding from a recent swine flu epidemic in China, and contained increases in rice prices. By contrast, lower inflation in Asia’s advanced economies reflects a different set of factors. The region has enjoyed more muted energy inflation than Europe and the United States.
Market Humor: Season’s Greetings and Best Wishes for 2022


Previous Edition of GBW
Read more stories like this and others by Faisal Khan on Medium.
Stay informed with the content that matters — Join my weekly Newsletter