

WEEKLY BUSINESS ROUNDUP
Global Business Week: Women’s Economic Rights Around the World
The state of Financial markets & Economies, Weekly Charts, Business Trends & Statistics
Falling consumer sentiment and an all-time high in job “quits” didn’t deter investors from their bullish ways on Friday as U.S. equity markets bounced back from a mid-week sell-off. Nevertheless, that selling put an end to the recent record-setting streak, as the major averages ended the week lower, after five straight weeks of gains. Shares of semiconductor companies were among the best-performing stocks in the S&P 500 on Friday.
The major averages ended the week with modest losses of less than 1%, but all remain within striking distance of their all-time highs. Oil prices fell 1% and natural gas was down 7% to its lowest level in two months. Gold continued its run higher. Treasury prices tumbled, driving the benchmark yield on the 10-year note up 13 basis points on the week to 1.58%
The US Dollar Index (DXY) pulls back from a fresh yearly high of 95.27 as the U. of Michigan Confidence survey tumbles to 66.8 from 71.7 in October to mark the lowest reading since 2011. Having said that, indications of stronger economic activity may keep the Greenback afloat as it puts pressure on the Federal Reserve to implement higher interest rates sooner rather than later — signs of sticky inflation along with evidence of stronger activity may push the FOMC to forecast a steeper path for US interest rates.
Cryptocurrencies have ended the week lower as the digital assets continued to slide. Bitcoin is down around 7% from recent highs just above $69k. While further correction can’t be ruled out for the premier digital currency, stronger support has emerged around $58.5k. Ethereum, on the other hand, still remains in a strong daily bullish channel — trading close to $4,500 at the time of writing. Overall, the total crypto market cap is $2.80 trillion with a BTC market dominance of 43.1%.
Today’s featured infographic (above) uses data from the Women, Business and Law 2021 report by the World Bank, to visualize women’s economic rights around the world.
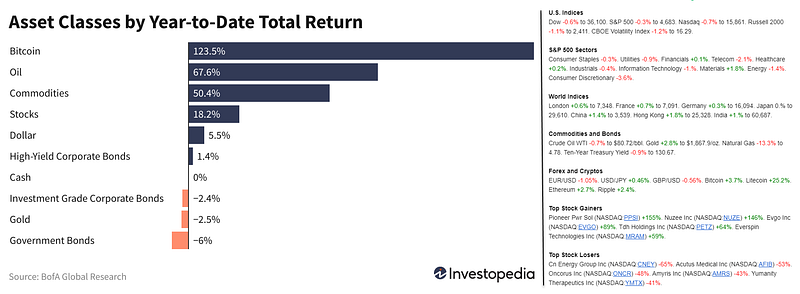
And finally, before moving on to some other statistics, here are the weekly & YTD numbers from various markets and different assets (Figure 1).
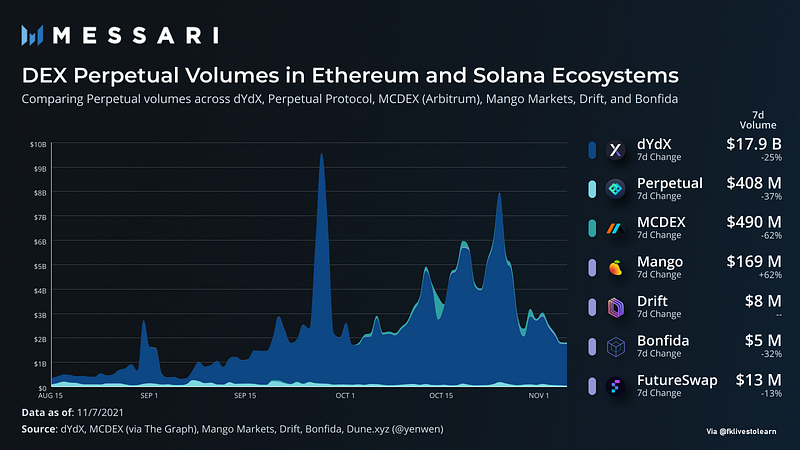
DEX Perpetual Volumes in Ethereum & Solana
Solana has received sizable investor attention over the last quarter. SOL is up 50% over the last 30 days and nearly 500% over the last 90 days vs USD (24% and 249% vs ETH, respectively). While Solana has certainly had many growth catalysts develop recently, how has the ecosystem executed on narratives from earlier this year? One, in particular, was Solana’s potential as a network that could support high-volume trading activity. Perhaps influenced by the specialties of some of the largest investors in the ecosystem including Alameda and Jump Capital to name a few. Solana now has a relatively higher concentration of derivative-focused protocols compared to other ecosystems.
For some background, perpetuals are a futures derivative product that doesn’t require rolling of contracts — just the single product provides ongoing future exposure to a particular market. It’s a simple way for traders to get leveraged futures exposure to an asset without the inefficiencies of having to actually acquire the underlying asset. As such it is by far the most heavily traded product in crypto. Centralized exchanges (CEXs) did $2.7T in perpetual notional volume in October in just the BTC and ETH markets alone while all of the CEX spot markets did $1.25T in volume (Figure 2).
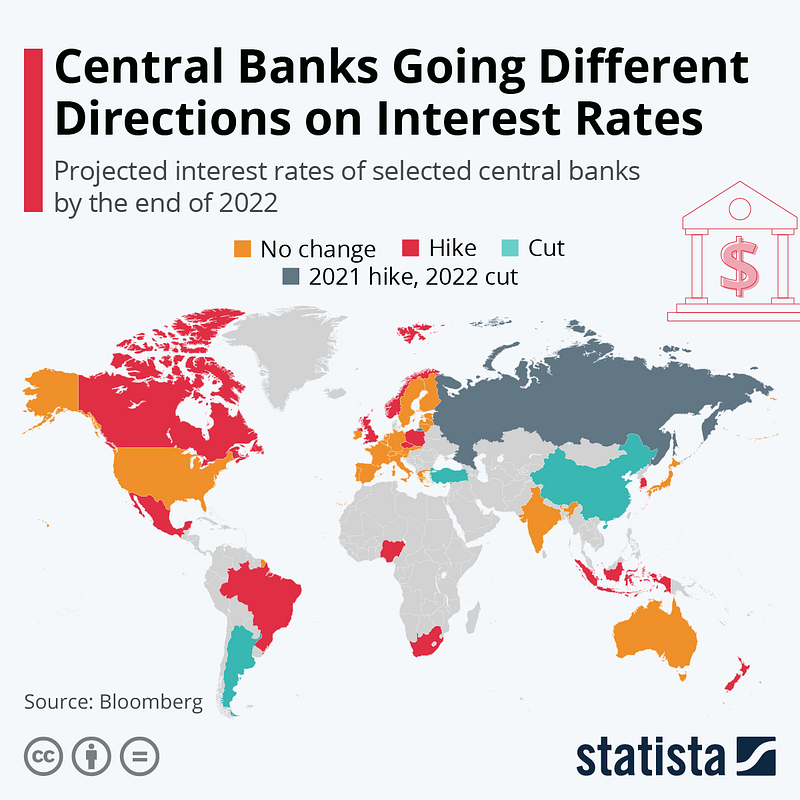
Central Banks on Interest Rates
In many countries, consumer prices are rising significantly. Central banks would have the ability to counteract this via monetary policy means — by raising interest rates, thereby restricting access to credit and slowing down value creation. But as seen in Bloomberg’s latest forecast of central bank rates, not all central banks are of the opinion that timely countermeasures are necessary.
The European Central Bank as well as the United States’ Fed are likely to maintain their low-interest rates until the end of next year, despite the aim of their monetary policy being to keep the inflation rate constant and around the two percent mark. According to a Bloomberg forecast, interest rates are also expected to remain stable in Australia, India, Japan & Switzerland. Yet, other central banks could end the era of cheap credit more quickly. This includes, for example, Great Britain. Bloomberg analysts expect the central bank rate in the country to rise from 0.1% to 0.25% by the end of 2022 (Figure 3).
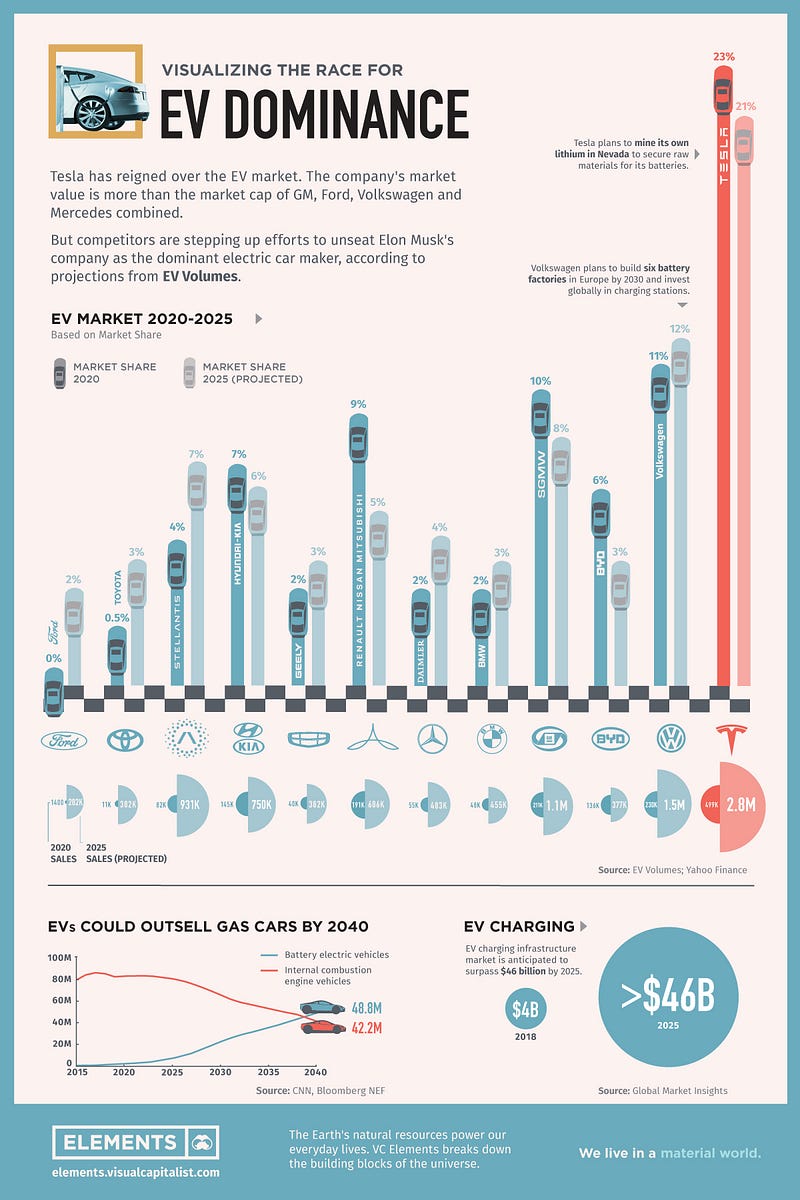
Global EV Dominance
Tesla has reigned supreme among electric car companies, ever since it first released the Roadster back in 2008. The California-based company headed by Elon Musk ended 2020 with 23% of the EV market and recently became the first automaker to hit a $1 trillion market capitalization. However, competitors like Volkswagen hope to accelerate their own EV efforts to unseat Musk’s company as the dominant manufacturer. This graphic based on data from EV Volumes (Figure 4) compares Tesla and other top carmakers’ positions today from an all-electric perspective and gives market share projections for 2025.
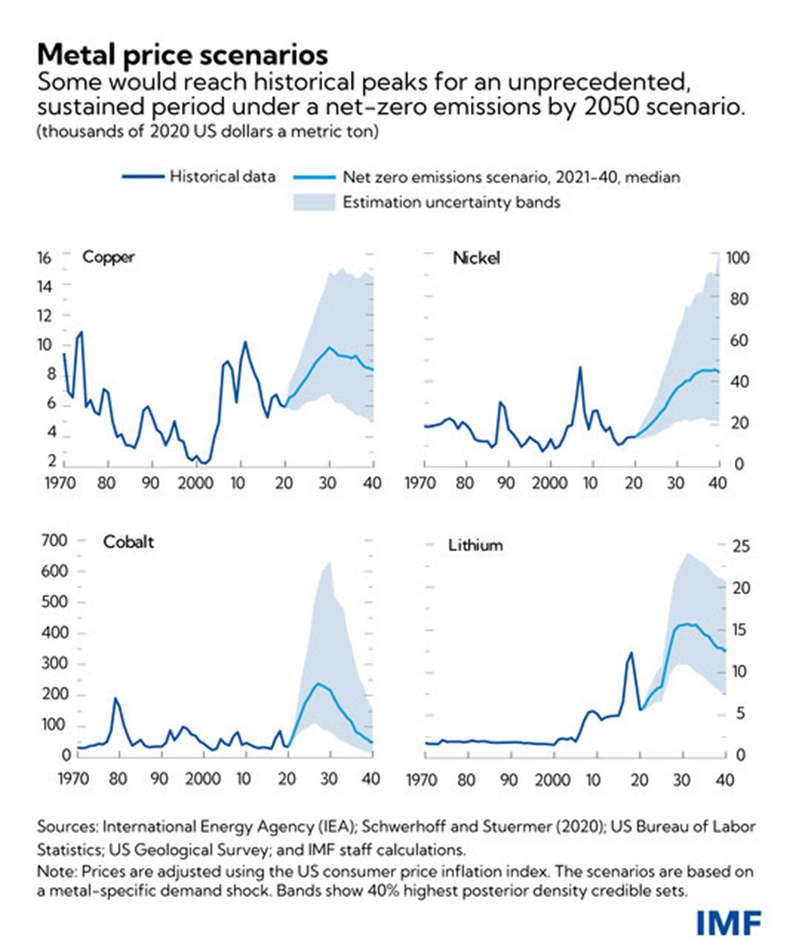
Metal Prices Soar
While metals demand could soar, supply typically reacts slowly to pricing signals, partly depending on production. Copper, nickel, and cobalt come from mines, which require intensive investment and take on average more than a decade from discovery to production according to the IEA. In contrast, lithium often is extracted from mineral springs and brine via salty water pumped from below ground. That shortens lead times for new production to average roughly five years. Supply trends also are influenced by extraction technology innovation, market concentration, and environmental regulations.
The combination of soaring demand and slower supply changes can spur prices to climb. In fact, if mining had to satisfy consumption under the IEA’s net-zero scenario, recent IMF analysis (Figure 5) shows prices could reach historical peaks for an unprecedented length of time — and those higher costs could even delay the energy transition itself. Specifically, cobalt, lithium, and nickel prices would rise several hundred percent from 2020 levels and peak around 2030. However, copper is less of a bottleneck as its demand increases are not as steep. IMF estimates prices would peak as in 2011, though be elevated for longer.
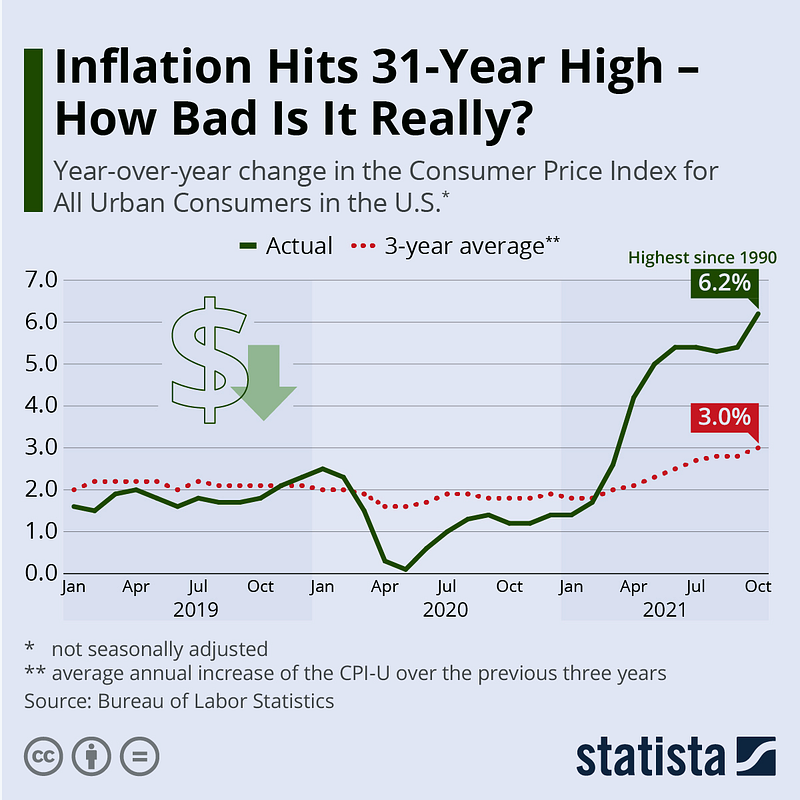
U.S 31-Year Inflation High
Consumer prices in the United States continued to rise in October, as inflation hit a 31-year high. The Consumer Price Index for All Urban Consumers (CPI-U) was up 6.2% compared to a year ago (Figure 6), while the core index excluding more volatile food and energy prices surged by 4.6% from October 2020 levels. Those were the highest readings since November 1990 and August 1991, respectively, fueling inflation fears that had long been downplayed. When inflation spiked in the spring/early summer of this year, it was largely due to the so-called base effect, caused by the pandemic’s cooling effect on consumer prices a year earlier.
At the onset of the pandemic, prices had taken a dive due to a sudden drop in consumer spending and fuel demand before slowly climbing back to their pre-pandemic trajectory over the summer and fall. Due to that initial dip in consumer prices, year-over-year comparisons were always going to be exaggerated this year, as last year’s prices were unnaturally low. So are inflation fears justified or is it still too early to ring the alarm bells? Back in April, the Federal Open Market Committee said that it was going to aim for “inflation moderately above 2% for some time” before raising interest rates to achieve a long-term average of 2% inflation. And while it’s unclear how the committee defines “moderately above” and “for some time”, its long-term goal of 2% inflation is clear.
Market Humor:
Previous Edition of GBW
