
WEEKLY BUSINESS ROUNDUP
Global Business Week: Surging costs of Energy transition casts shows over COP26
The state of Financial markets & Economies, Weekly Charts, Business Trends & Statistics
A stronger-than-expected U.S jobs report for October propelled the stocks to new highs, which showed 531,000 jobs added in October and a revised gain of 312,000 in September. All three major market indexes closed at new all-time highs, even after a late drop in tech stocks weighed on the final Nasdaq number. It was the sixth day in a row that the S&P 500 closed at a record. For the week the Dow was up 1.4%, the S&P 500 gained 2%, and the Nasdaq jumped 3%.
Pfizer said interim data showed its COVID-19 pill reduced the risk of hospitalization or death by 89%, which boosted classic reopening plays such as airlines and cruise ships. Enthusiasm generated by the employment data sent money into stocks and out of bonds. The yield on the 10-year Treasury note dropped to 1.45%, its lowest level since late September. Oil rose 3% on optimism that the job gains mean the economic recovery is gaining strength.
The US Dollar index (DXY) strengthened with a hawkish Federal Reserve monetary signaling the start of stimulus taper. In addition to that, the benchmark was buoyed by a bumper NFP report — charting a high of 94.62, before receding to close at 94.21. With a new high in place and the Fed begins the process of monetary policy normalization, DXY is expected to make further gains going towards the end of the year.
Cryptos led by Bitcoin spent most of the week in a tight range consolidating below the recent highs — at the time of writing Bitcoin was trading around $61.4k while Ethereum was just above $4,510. Talking about ETH, the pioneer smart contract platform has been taking the lead recently, after charting success new All-time highs, the most recent one being around $4,660. The euphoria in the meme coin Shib Inu has subsided for now, but it’s still holding on to more of its gains recently.
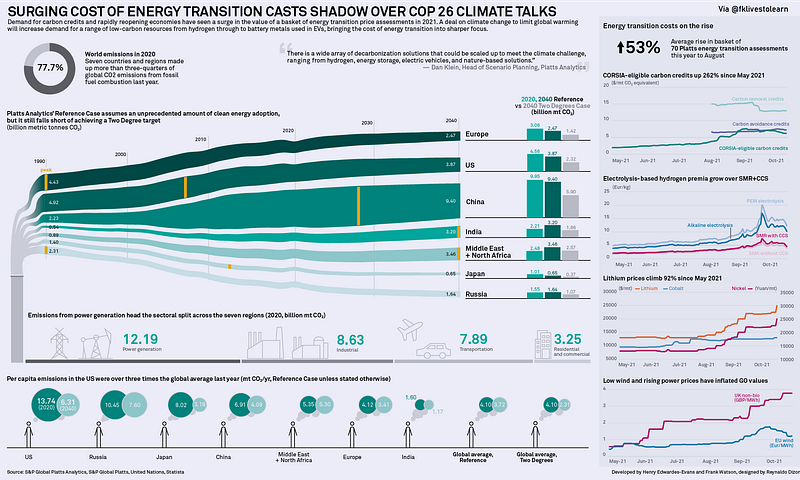
Today’s featured infographic (above) Platts Analytics’ Reference Case assumes an unprecedented amount of clean energy adoption, but it still falls short of achieving a Two Degree target, illustrating how difficult the challenge of preventing climate change is — in the face of surging energy transition costs.
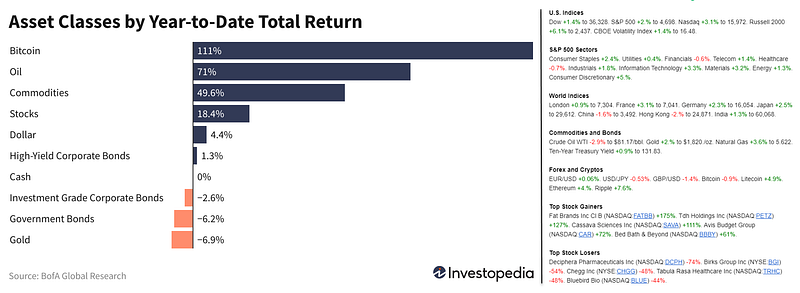
And finally, before moving on to some other statistics, here are the weekly & YTD numbers from various markets and different assets (Figure 1).
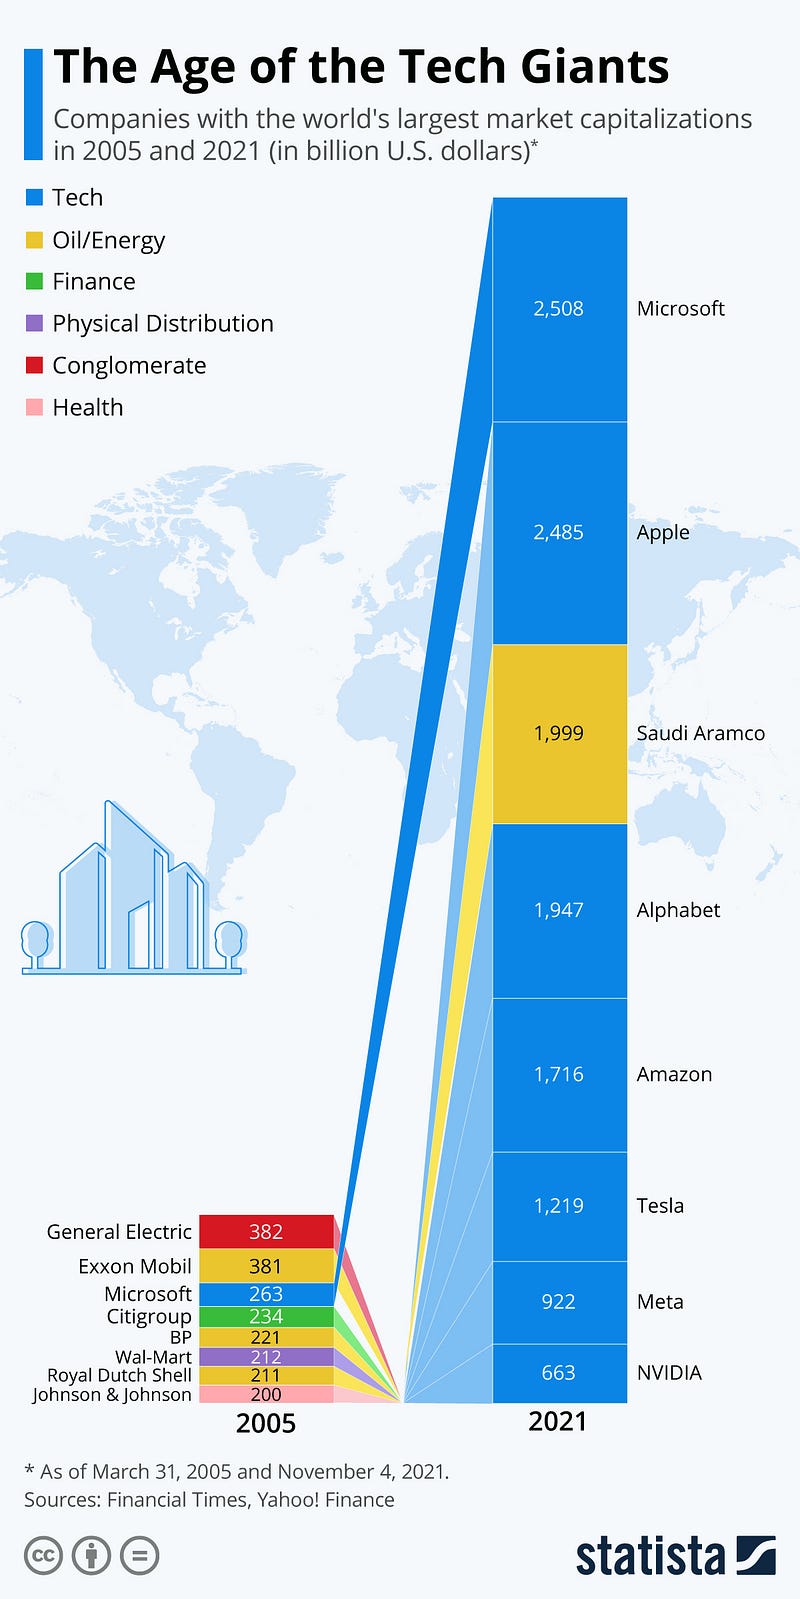
The Age of Tech Giants
Sixteen years ago, everyday life was very different: smartphones as we know them today had not yet been invented, Facebook had only just been founded, and ExxonMobil was worth ten times as much as Apple. More than a decade later, the rise of America’s digital giants has radically changed this landscape (Figure 2). As the infographic below shows, in 2005, the list of the world’s most valuable listed companies was rather diverse, with a few large oil companies, but also multinational conglomerates, distribution companies, as well as those in finance and healthcare. But today, with the exception of Saudi Aramco, it is the American tech giants that dominate the rankings (although Tesla could also be put in the automotive category).
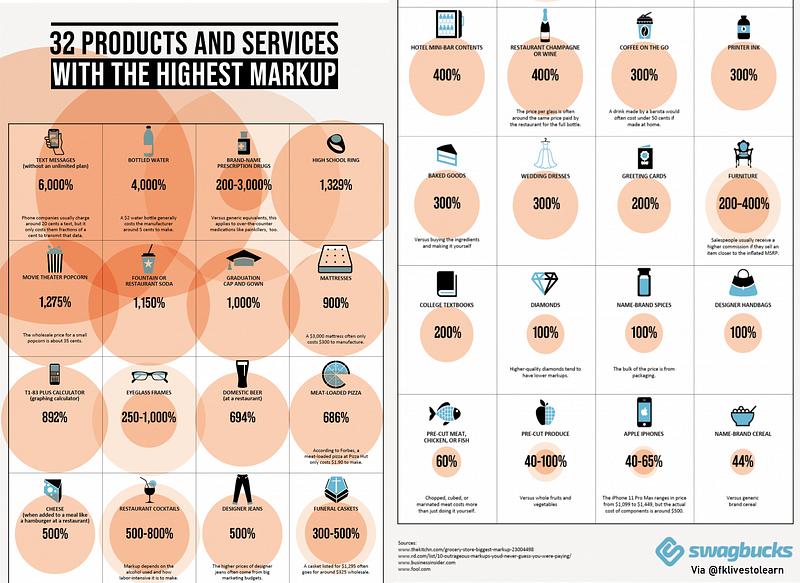
Products & Services with the Highest Markup
Markup is the amount a producer adds to a product’s sale price above and beyond the manufacturing costs. So when you finally buy a product at the market retail cost, it always includes the markup. In most cases, markup is to ensure profit and cover overheads, but markup can become excessive. While it is obvious that companies get their profits by selling you products and services, it may shock you to realize that some of the products you buy cost ten or more times their production costs! That’s right, your favorite designer jeans that went for $400 may cost $30 to produce. This infographic (Figure 3) and article will explain the highest markup products and just how much above the production cost you can expect to pay. Use this information to assuage your curiosity or to save money on your next purchase!
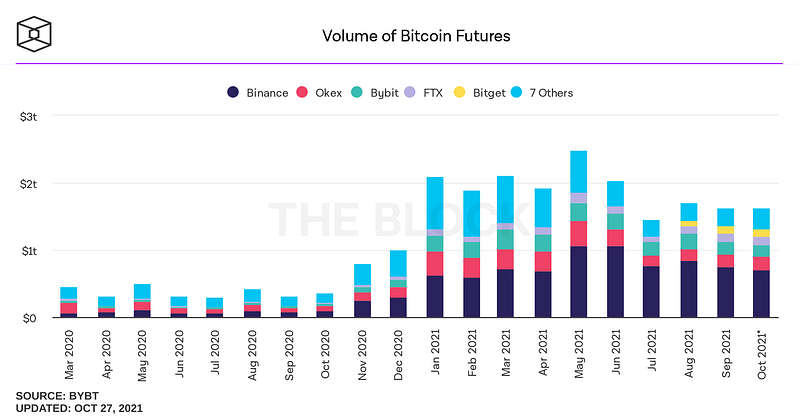
Overview of Crypto Derivatives Market
According to CryptoCompare, the crypto derivatives market reached its peak with a total trading volume of $5.5 trillion in May 2021. Since then, volumes have stabilized around the $3.0 trillion level (Figure 4). Compared with traditional markets, there is still a significant amount of upside for crypto derivatives. To tap into this market, centralized exchanges (CEXes) such as Binance and OKEx began offering crypto derivatives at scale after the initial success of BitMEX. Following their lead, Coinbase, the biggest U.S. cryptocurrency exchange, filed an application with the National Futures Association for derivatives trading on September 16, 2021.
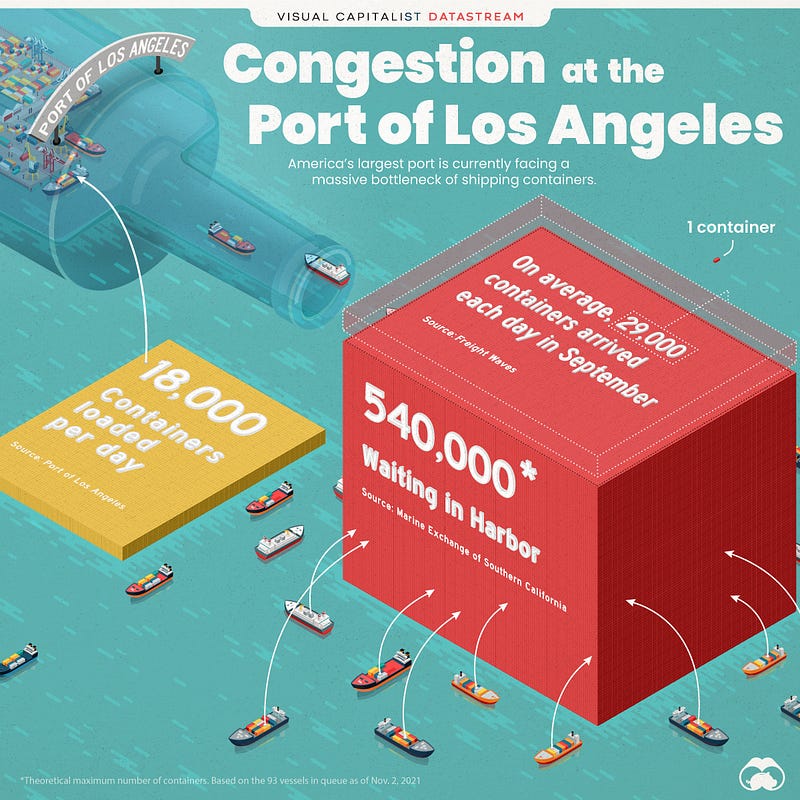
Supply Chain Issues Visualized
To help you understand the scale of supply chain problems that we find ourselves currently in, the infographic below (Figure 5) visualizes the number of containers waiting at sea in relation to the Port of Los Angeles’ daily processing capacity. As of November 2, 2021, the Port of Los Angeles reported that it had 93 vessels waiting in the queue. Altogether, these ships have a maximum carrying capacity of roughly 540,000 containers (commonly measured in twenty-foot equivalent units or TEUs). On the other side of the equation, the port processed 468,059 import containers in September (the most recent data at the time of writing). That capacity seems unlikely to reduce the congestion. Over a two-week timeframe in September, 407,695 containers arrived at the Port of Los Angeles, which averages to around 29,000 containers arriving each day.5
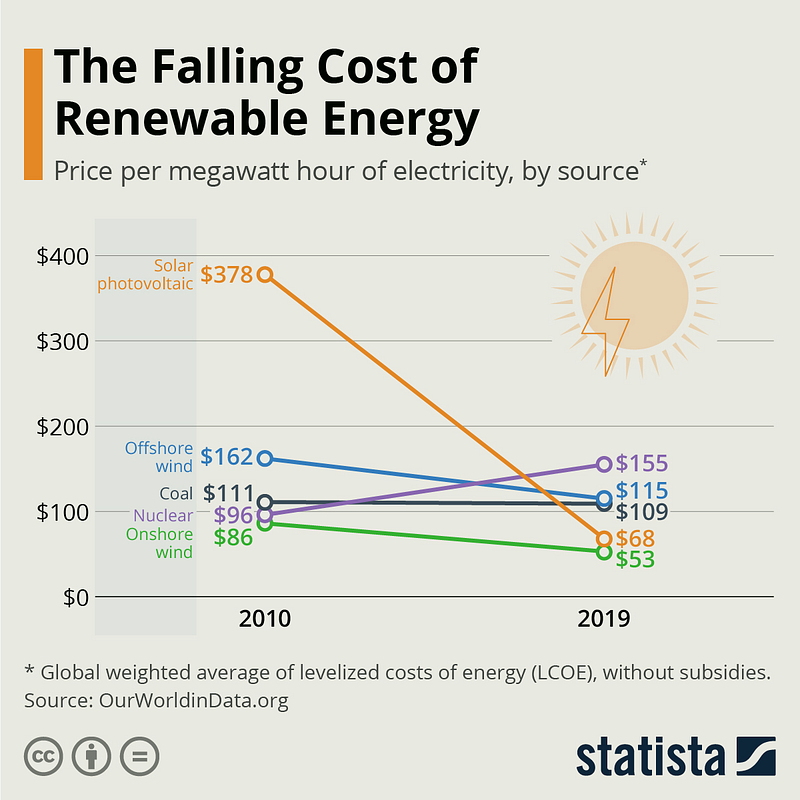
Falling Cost of Renewable Energy
The world is still a long way from producing all of its required electricity via renewable sources, but figures covered by Our World in Data reveal that at least when it comes to cost, things are certainly moving in the right direction. Back in 2010, a megawatt-hour of electricity gleaned from solar photovoltaic cost a global average of $378 to generate. That’s without the effect of any subsidies which may have been applicable in some areas. By 2019, that cost had tumbled down to just $68 — cheaper than nuclear and coal and only a little behind the most economically efficient option looked at in this chart (Figure 6). Wind energy, both onshore and offshore, has also seen decreases in costs since 2010, while the more established methods of nuclear and coal have either increased in price or seen only a slight drop.
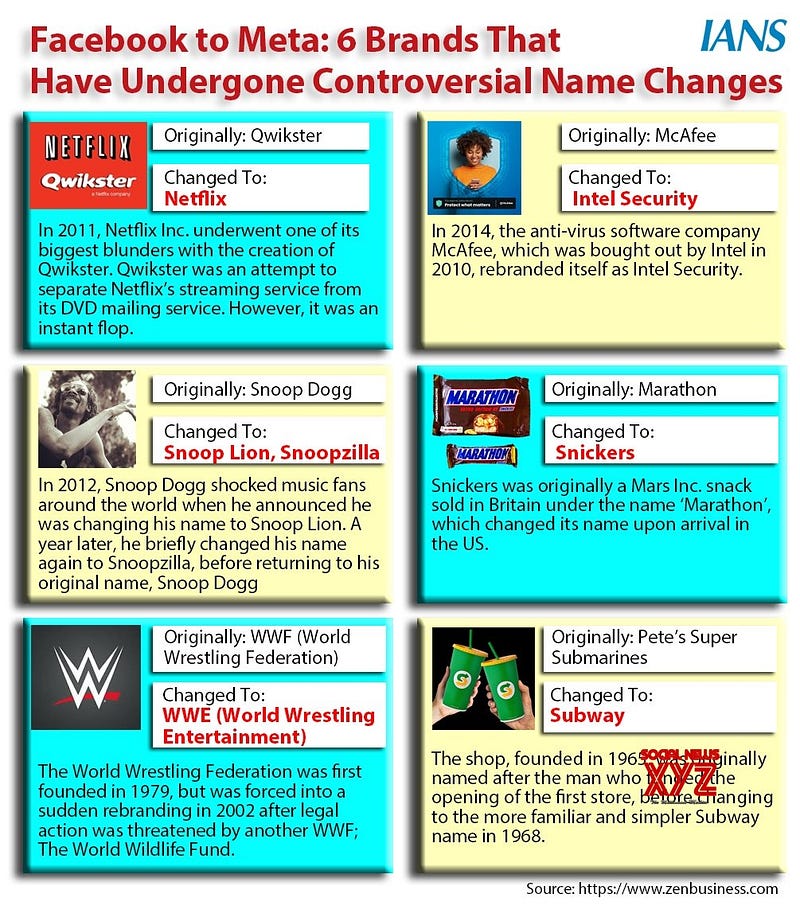
Rebranding Companies
Rebranding occurs when companies decide to change a significant element of the brand. The most significant one that we saw recently was Facebook, which has changed its name to Meta — as it dives to create a more inclusive virtual reality environment for billions of its users. But I doubt this rebranding is going clear the privacy and other regulatory stigmas that the social media giant finds itself in currently. The infographic below (Figure 7) outlines some of the controversial rebrandings that we have seen over the years.
Market Humor: Fed Starts To Taper As Inflation Fears Grow. Is Powell Too Late?

Previous Edition of GBW
