
WEEKLY BUSINESS ROUNDUP
Global Business Week: Why ETFs are critical tools in navigating volatility
The state of Financial markets & Economies, Weekly Charts, Business Trends & Statistics
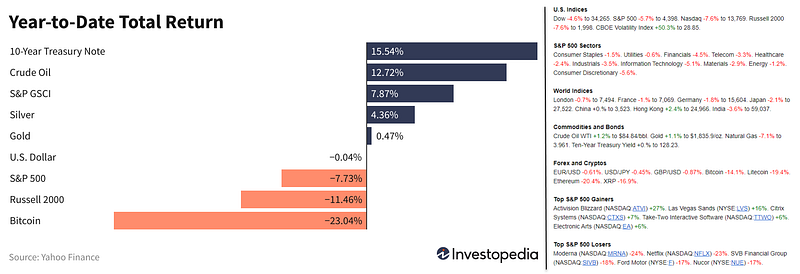
Stocks capped their worst week in almost two years as the benchmark U.S indices tumbled, led by the tech-heavy Nasdaq, which fell 7% for the week — its worst weekly decline since October 2020. Both the S&P and Dow closed out their third straight week of losses, down 5.7% and 4.6% respectively, while the Nasdaq Composite plunged 2.7% Friday and 7.6% for the week. S&P 500 tumbled below its 200-day moving average, a level of support that had held up since May 2020. The major losses in growth names have pushed the Nasdaq further in correction territory, down more than 14% since its November high, as rising interest rates pressure technology stocks by making their lofty valuations look less attractive.
Netflix shares plunged 21% after the company said subscriber growth was slowing. Shares of rival streaming services, including Walt Disney and ViacomCBS, sank as well. Investors pulled money out of stocks and bought bonds. The yield on the 10-year Treasury sank to 1.74%, the lowest it’s been in a week. Crude oil futures dropped for a second consecutive day, falling below $85 a barrel. Still, oil is up 13% so far this year.
The dollar index spent most of the last week in bullish consolidation — closing the week @ 95.63. The US central bank announced a significant shift in its monetary policy stance to end 2021, but the ultimate impact of the more hawkish bearing seemed to barely register for the Dollar and risk assets in general. If we were to take the lack of direction of this systemically important shift at face value, it would be easy to interpret that some other fundamental consideration is directing the Greenback. Divergent monetary policy matters, economic narratives & yield differences may dictate the moves in the reserve currency going forward. For now, the waters look muddied.
Cryptocurrencies saw a broad-based sell-off, replicating the moves in U.S stocks — especially the Nasdaq. We are seeing the increasing correlation between stocks and Bitcoin play out, that I talked about earlier. Last week was also a good example of heightened volatility that is so well-known in the crypto space. Along with Bitcoin, many of the top digital assets have plunged by double digits. In fact, all of the Top 10 (except the stable coins) have fallen by over 25% in the last 7 days. At the time of writing, Bitcoin is trading close to $34.5k — with the medium-term support of $30k fast approaching. Ether, on the other hand, is closing in on $2300.
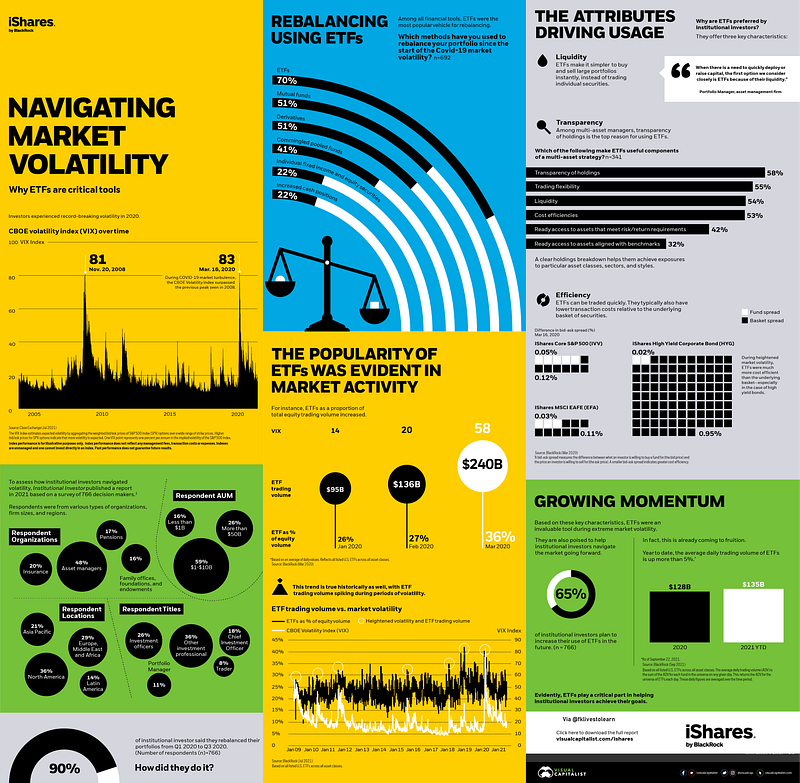
Investors experienced record-breaking volatility in 2020. During COVID-19 market turbulence, the CBOE Volatility index surpassed the previous peak seen in 2008. Today’s featured infographic from iShares explores how ETFs rose in popularity during this time — and the characteristics that make them particularly useful during market volatility.
And finally, before moving on to some other statistics, here are the weekly & YTD numbers from various markets and different assets (Figure 1).
Global Trust in Business
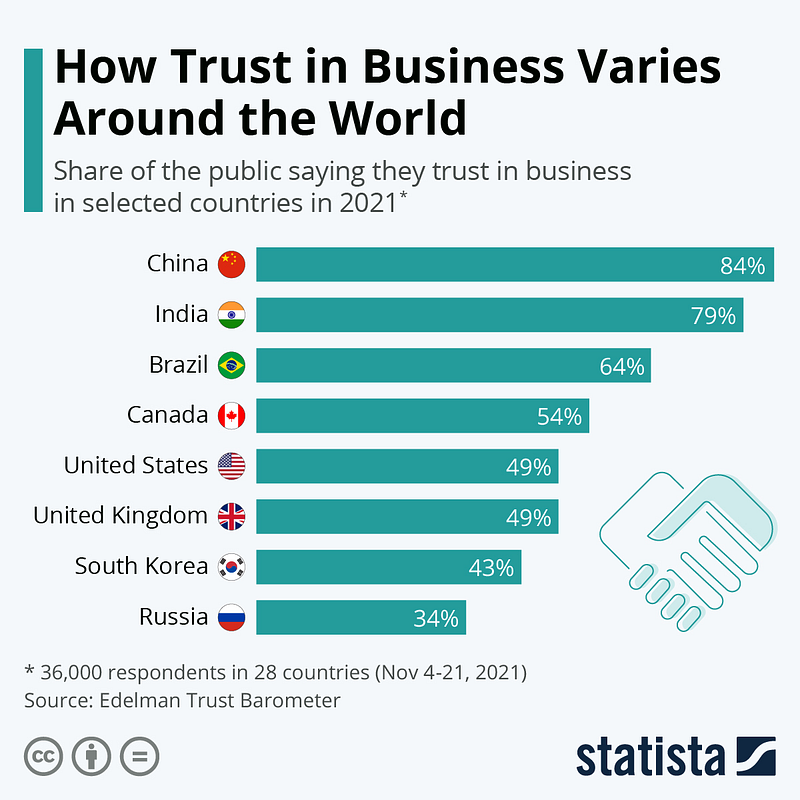
A strong level of trust with customers is going to prove hugely important for recovering businesses when the pandemic finally comes to an end (or at least progress to a stage closer to normality). A survey by Edelman Research polled 36,000 respondents in 28 countries about their trust in business to “do the right thing” in November 2021 (Figure 2). The research found that people in China, Indonesia, and India have the highest trust at 84%, 81%, and 79%, respectively. The figure was far lower in the United States at 49% while it was lower still in Russia at just 34%. In all, eleven countries saw an increase in trust in business, while eleven recorded a decrease. Interestingly, business is trusted more than government in 23 out of the 28 countries surveyed. Average trust in business globally was 61%, compared to 52% in government.
Space Investments
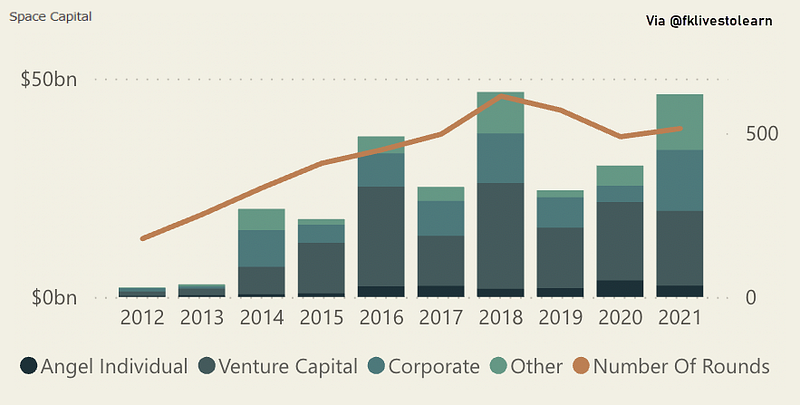
Investments in space-related companies set a record in 2021, with $17.1 billion pumped into 328 businesses, according to research by space venture capital (VC) firm Space Capital. Space Capital explained that total beat the previous record of $9.1 billion set the year before (Figure 3). In addition, it said space investments accounted for 3% of total VC flows in 2021. The study noted in the fourth quarter, 134 companies received $14.7 billion in capital, and over the past 10 years, $252.9 billion has been invested across 1,694 unique companies in the space industry. Space Capital indicated low-interest rates in the U.S. were a major reason for last year’s spending increase.
Record Year for VC Funding
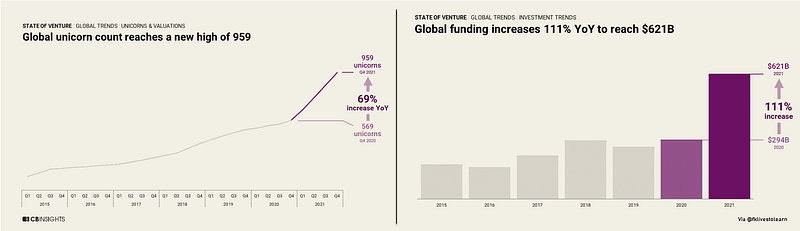
It was a record year for global & US venture funding, exits, unicorns, and more. Global venture deals and dollars reached record highs in 2021. Funding more than doubled year-over-year as startup investment soared across sectors and geographies. In the CB Insights State Of Venture 2021 Report, they dig into global investment trends to spotlight takeaways like a record unicorn count, unicorn birth trends, and the highest-valued unicorns to close out the year. The data behind the biggest year in global funding was also up 111% year-over-year (Figure 4).
Tokenized Market Growth
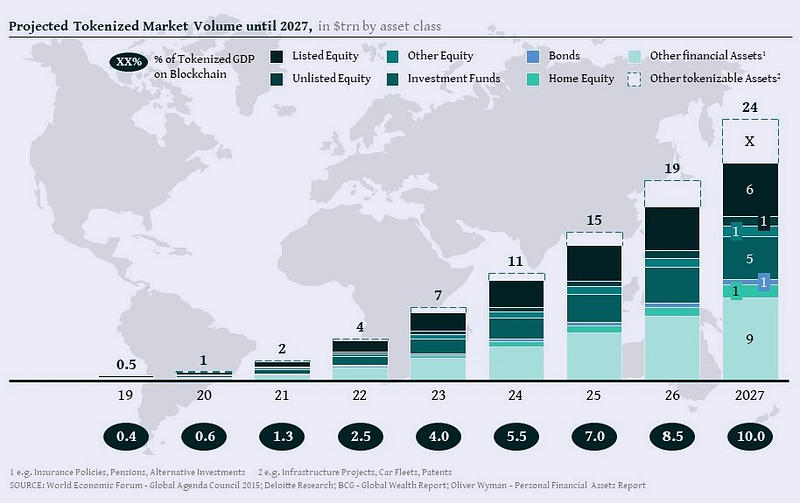
Based on certain factors such as past performance as well as future growth expectations per asset class, Finoa projected the market size of the individual assets from a bottom-up perspective. In a second step, they applied different assumptions of the individual rate of tokenization per asset class and finally matched our bottom-up results with the top-down research from the WEF. Following this methodology, they project a tokenized asset market of ~ $24 trillion of financial assets only in 2027 (Figure 5). This does not include currently not measured (or not existing) asset classes or unidentified tokenization use cases of intangible assets (e.g. patents, usage rights), where we expect significant innovation and growth.
CBDCs Push
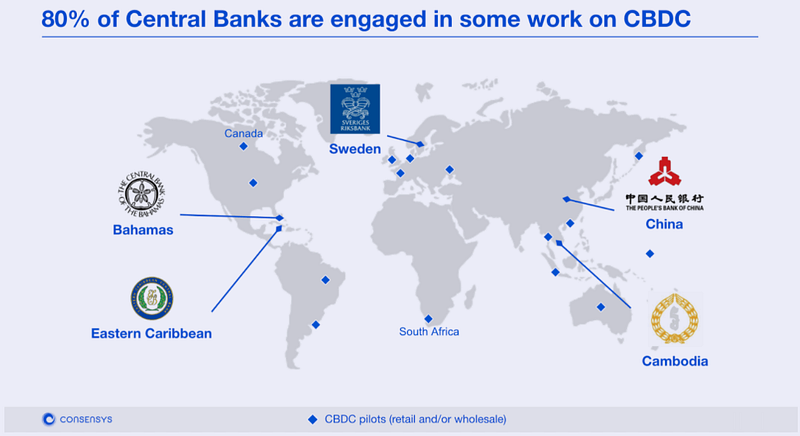
Visa and ConsenSys are teaming up to build software for and around the concept of central bank digital currencies (CBDCs). The main goal of the partnership is to develop an infrastructure that enables financial institutions to build services on top of CBDC networks (Figure 6). In turn, users could get expanded access to blockchain-based finance, while governments can experiment with on-chain disbursements and other modern functionality. This also opens up the possibility of a CBDC-linked Visa card or digital wallet. There is meaningful progress with China’s digital yuan as well as a number of Carribbean countries, though much of the Western world is taking a more skeptical, step-wise approach. There is significant, and perhaps insurmountable, work to be done to bridge the gap between existing systems and blockchain-based financial architecture. The gap is as much philosophical as it is technical and financial.
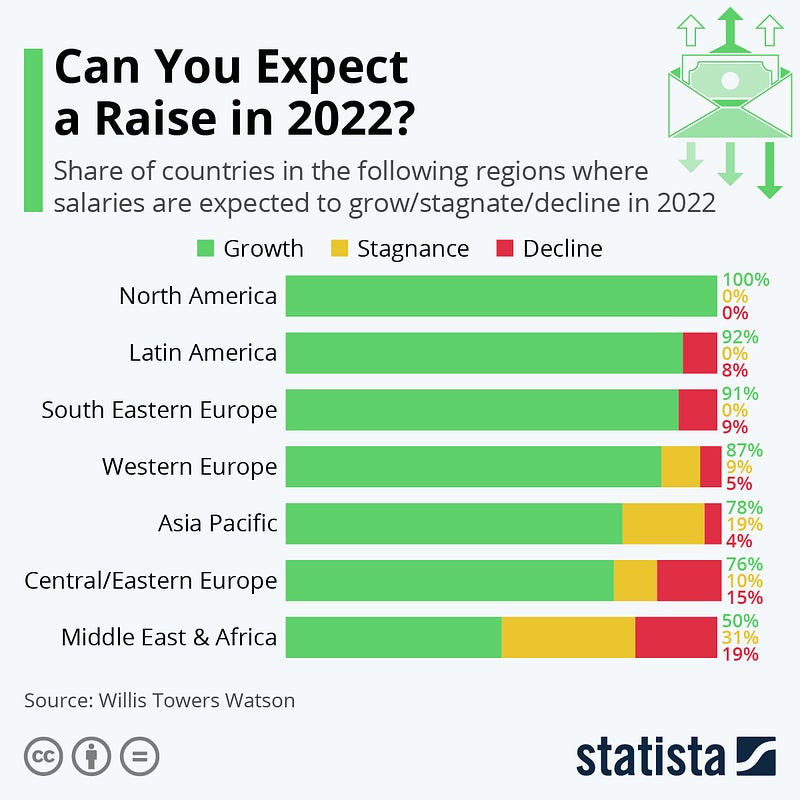
Can you expect a raise in salary this year? According to the latest forecasts by Willis Towers Watson (WTW), that very much depends on your location in the world. Their outlook for salaried employees looks by far the rosiest for those plying their trade in North America. Here, 100% of countries are expected to see an overall increase in salaries in 2022. In regions such as the Middle East, Africa and Central/Eastern Europe however, employee expectations should be far more pessimistic, as the infographic illustrates (Figure 7). According to their latest report, last year’s forecasts were very close to reality for a large number of countries. Notable exemptions, where actual raises were considerably lower than expected, were Brazil, Russia and South Africa.
Divergent Economic Recovery
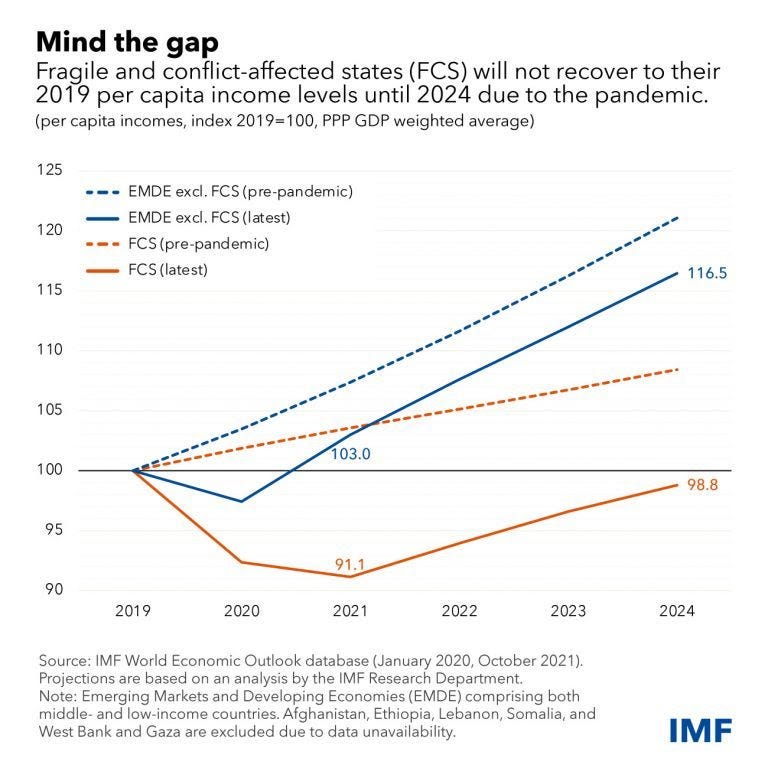
Even before the pandemic, fragile and conflict-affected states (FCS) already confronted some of the greatest challenges among the world’s economies. While not all FCS face active conflict, most are at risk: global levels of violence are at a 30-year high and more than 80 million people had been forcefully displaced prior to the discovery of the coronavirus. Now, the continuing pandemic poses a significant risk that the divergence between these countries and the rest of the world will widen — and persist. The following chart by IMF (Figure 8) illustrates how the pandemic exacerbated income divergence between these economies and the rest of the world.
Per capita incomes in fragile states won’t recover to near their 2019 levels until 2024, IMF projections show — and by then, the gap with pre-crisis per capita income trends is set to remain larger for FCS than for other countries. The IMF classifies more than 40 economies as fragile and conflict-affected. Examples include Libya, Yemen, Chad, the Democratic Republic of Congo, Somalia, Haiti and Papua New Guinea. Fragile states are already home to nearly 1 billion people and are on course to be home to 60 percent of the world’s poor by 2030.
Market Humor: Oil Prices Rally To 2014 Highs. Next Stop $100 And Above!

Previous Edition of GBW
Read more stories like this and others by Faisal Khan on Medium.
Stay informed with the content that matters — Join my weekly Newsletter