
WEEKLY BUSINESS ROUNDUP
Global Business Week: Visualizing the Economic Benefits of a Green Recovery
The state of Financial markets & Economies, Weekly Charts, Business Trends & Statistics
U.S stocks rebounded strongly on Friday to shrug off the fear about the prospect of higher capital gains taxes. All three major indices closed well in excess of 1% gains for the day. As volatility settled, investors returned to risk, driving tech stocks and recovery-related sectors higher. Homebuilding stocks were a tower of strength, as data showed U.S. new-home sales rebounding sharply in March to the highest since 2006. For the week, the S&P, Dow & Nasdaq all closed with small losses
The US Dollar continued to cautiously slide against its major counterparts this past week, extending what has been a pullback since the end of March. Weakness in the Greenback continued to track a combination of falling longer-term Treasury rates and fading December 2022 Federal Reserve rate hike expectations. For the week, the benchmark dollar index closed below 91.00 level — its lowest level since early March.
Cryptocurrencies were in sharp retreat this week with Bitcoin dropping to as low as $48k. The premier digital currency is now in a corrective territory with BTC falling more than 20% off its recent peak. However, at the time of writing, BTC has rebounded back above the psychological level of $50k. Ethereum has done exceedingly well owing to the strong demand in DeFi. ETH against posted an all-time high above $2640, before the correction ensued. The second-largest crypto has been resilient to major falls.
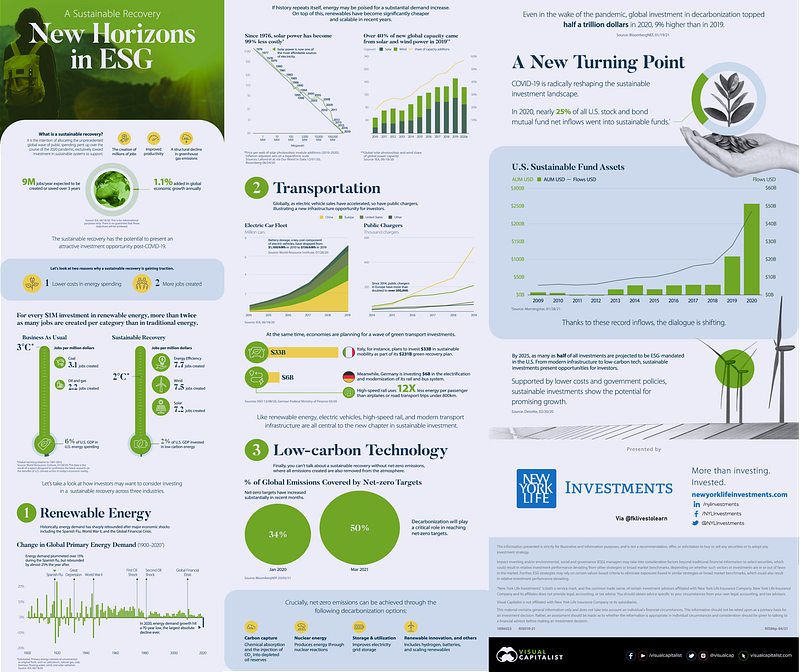
Today’s featured infographic (above) from New York Life Investments unpacks how a green recovery will benefit both the economy and investor portfolios. ESG investing is a new thing and after years of technological advancement, many renewable energy sources are now more efficient than traditional sources of energy. Thanks to their falling prices and scalability, a green recovery, which centers on worldwide funding and policy support for green energy alternatives, is gaining strong momentum.
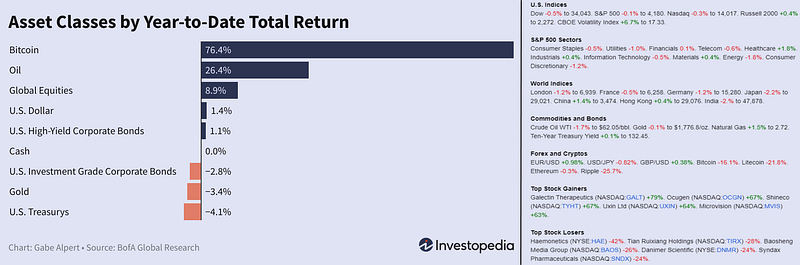
Check out the YTD number from different assets & markets (Figure 1) before moving on to some of the other weekly statistics.
Most Innovative Companies Over Time
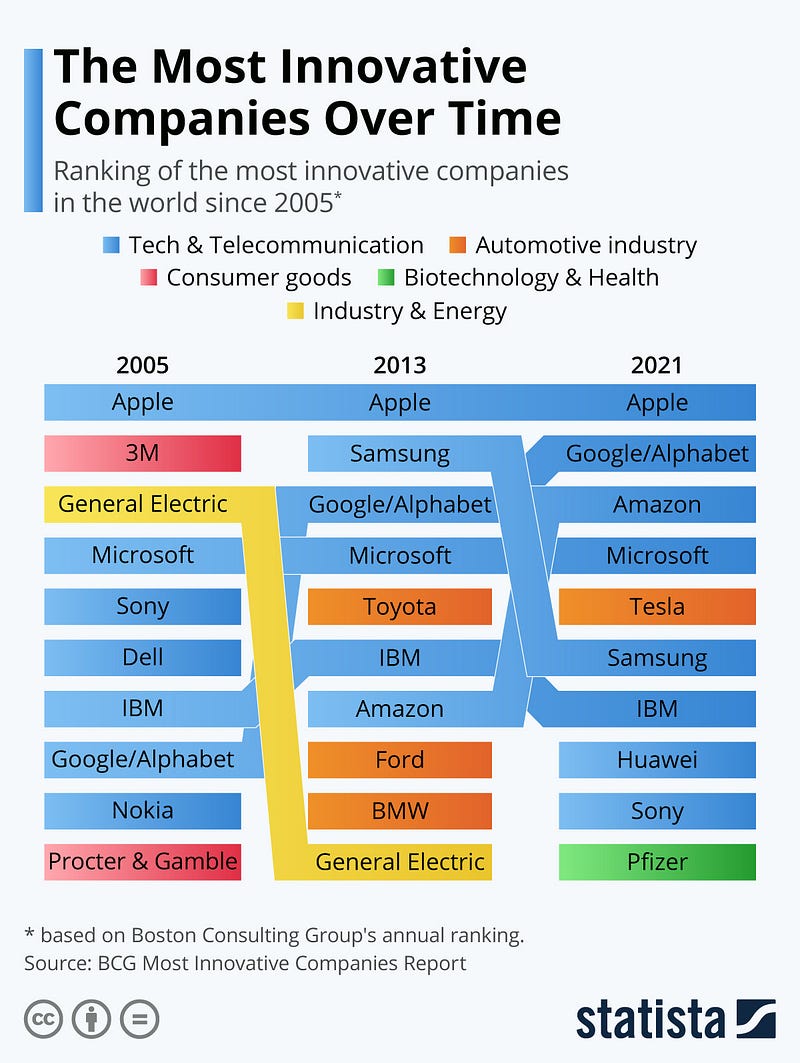
Boston Consulting Group has just unveiled its annual ranking of the 50 most innovative companies in the world. The COVID-19 pandemic has demonstrated the importance of innovation in turbulent times. While U.S. tech giants — Apple, followed by Alphabet, Amazon & Microsoft still monopolize the first couple of ranks with the context of the pandemic, several companies in the pharmaceutical sector are also included in the Top 50 this year. U.S. company Pfizer, which has developed a vaccine together with BioNtech and announced the launch of two drugs against Covid-19, has notably entered the top 10 (Figure 2).
Power Consumption of Bitcoin Mining
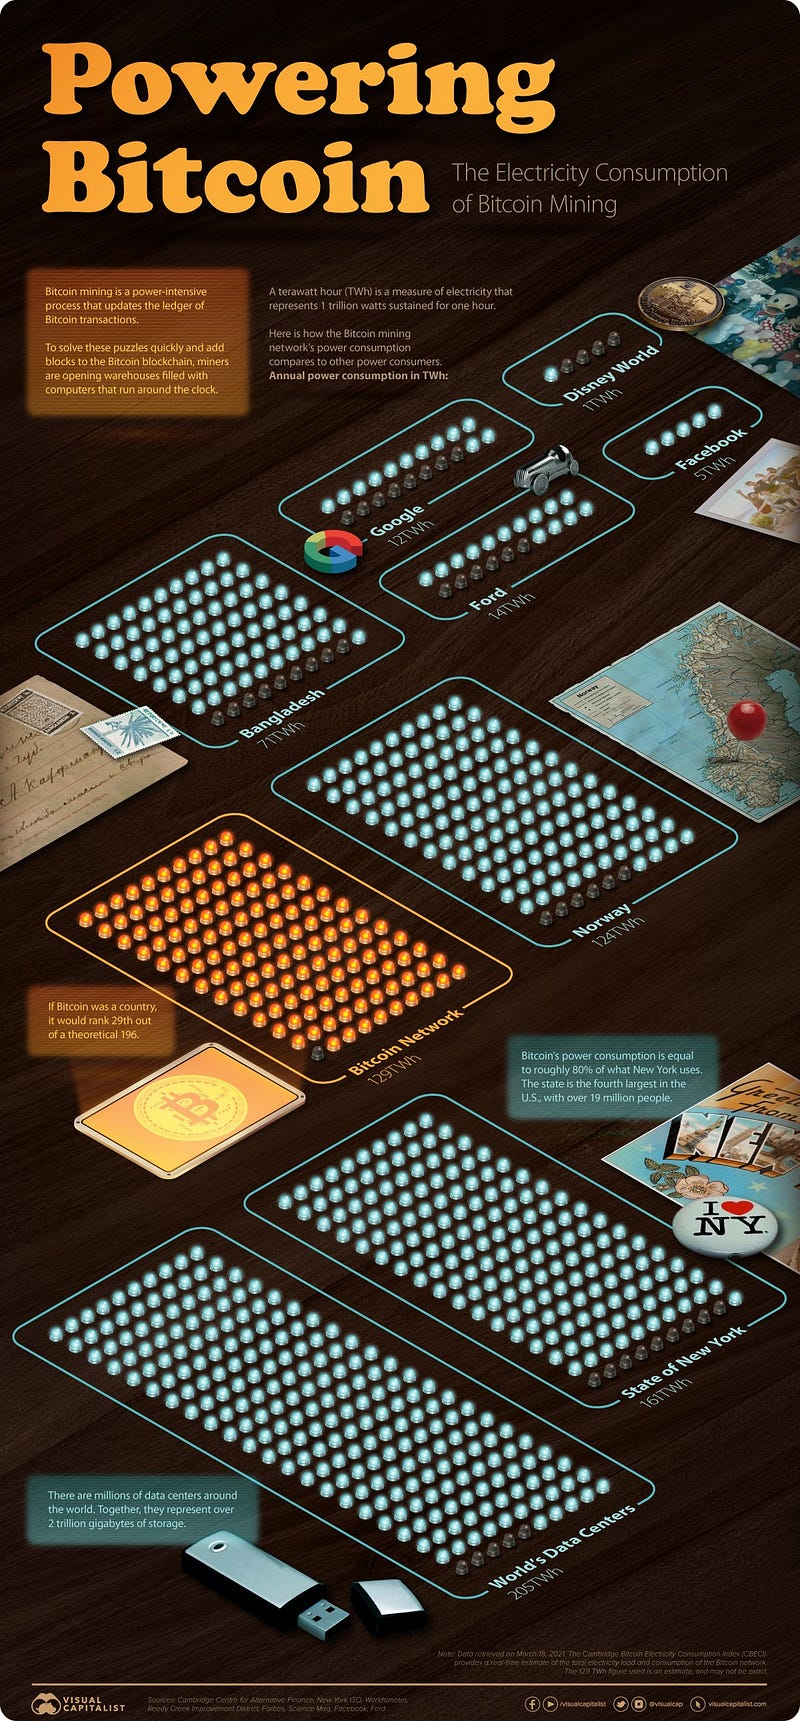
Cryptocurrencies have been some of the most talked-about assets in recent months, with Bitcoin and Ethereum prices reaching record highs. These gains were driven by a flurry of announcements, including increased adoption by businesses and institutions. Lesser known, however, is just how much electricity is required to power the Bitcoin network. To put this into perspective, we’ve used data from the University of Cambridge’s Bitcoin Electricity Consumption Index (CBECI) to compare Bitcoin’s power consumption with a variety of countries and companies (Figure 3).
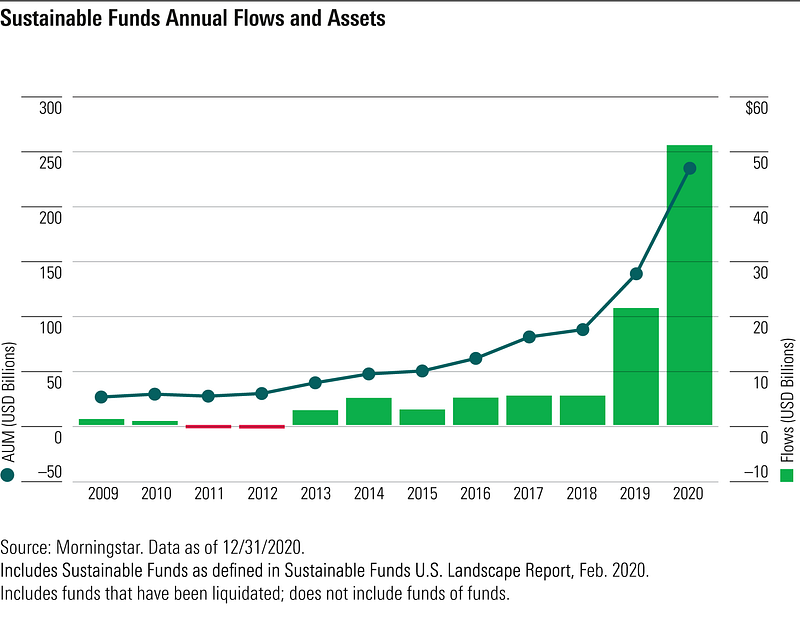
Sustainable Assets Annual Flows
The heavy investor interest in ESG has led to what critics call “green-washing”, by companies and asset managers looking to position themselves in the funnel of the hundreds of billions of dollars chasing that theme. The European Union is proposing making companies report standardized information about their impact on their environment, and social metrics, such as how they treat their employees.
The EU wants those rules to apply to both publicly-traded companies in Europe and large private companies, which total about 50,000. Banking institutions, including those based in the U.S., that have subsidiaries or operations in Europe, would also have to comply. The Commission also rolled out a new classification system to define green investments, which it will apply next year. This is amid strong growth in sustainable asset fund flows that we have seen in 2020 (Figure 4).
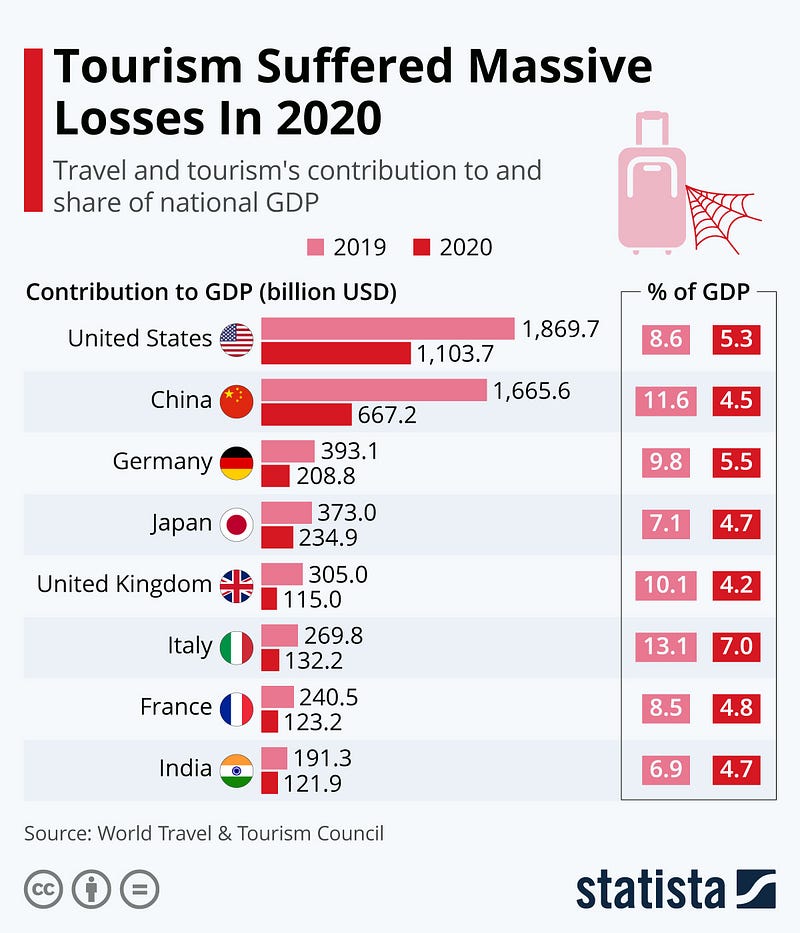
Massive Tourism Losses in 2020
New data released by the World Travel & Tourism Council reveals the crippling impact the pandemic had on global tourism last year. The travel and tourism sector suffered global losses of nearly $4.5 trillion with its contribution to GDP plunging by a staggering 49.1% compared to 2019 (Figure 5). 62 million jobs were lost in the sector last year while domestic visitor spending and international visitor spending fell by 45% and 69.4%, respectively. In the United States alone, losses amounted to some $766 billion with tourism and travel’s contribution to national GDP falling from 8.6% to 5.3%. China also posted a mammoth loss of just under a trillion dollars with the sector’s contribution to GDP dropping from 11.6% to 4.5 %.
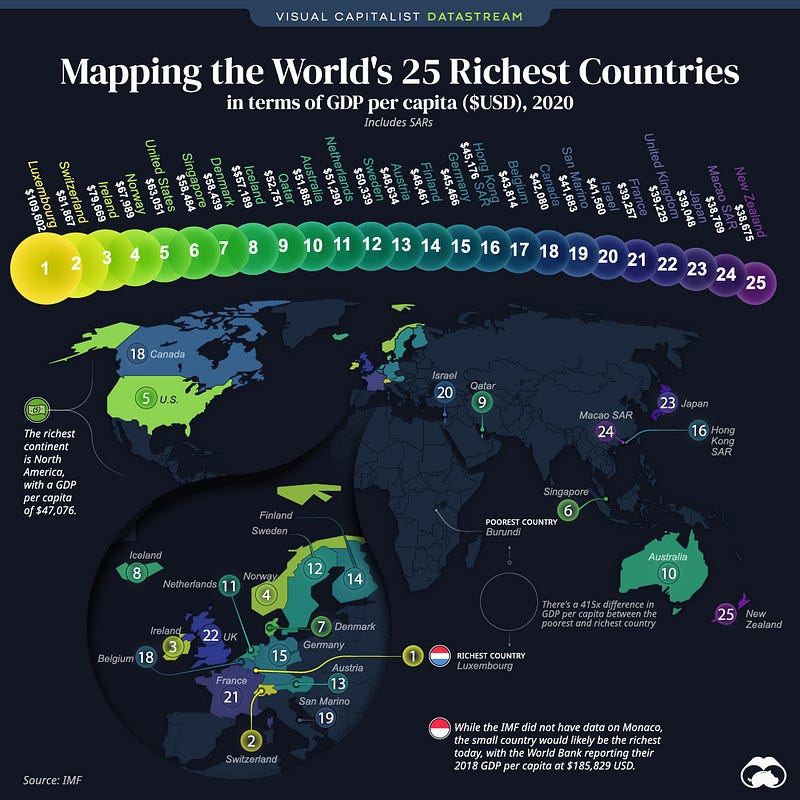
World’s 25 Richest Countries
This infographic below (Figure 6) looks at the top 25 richest countries. They are located across North America, Europe, Asia, and Oceania. Notably, no South American or African countries make the list. Although number one on the global stage in terms of total GDP, the U.S. places fifth with a GDP per capita of $63,051. Interestingly, a number of countries with smaller population sizes have a high GDP per capita. For example, Iceland makes the top 10 at $57,189, but the island’s population is only around 342,000 people. Similarly, Luxembourg’s population is just under 633,000 — but it’s the richest country in the world on a per capita basis.
Market Humor: Global Chip shortage getting worse

Previous Edition of GBW
