
WEEKLY BUSINESS ROUNDUP
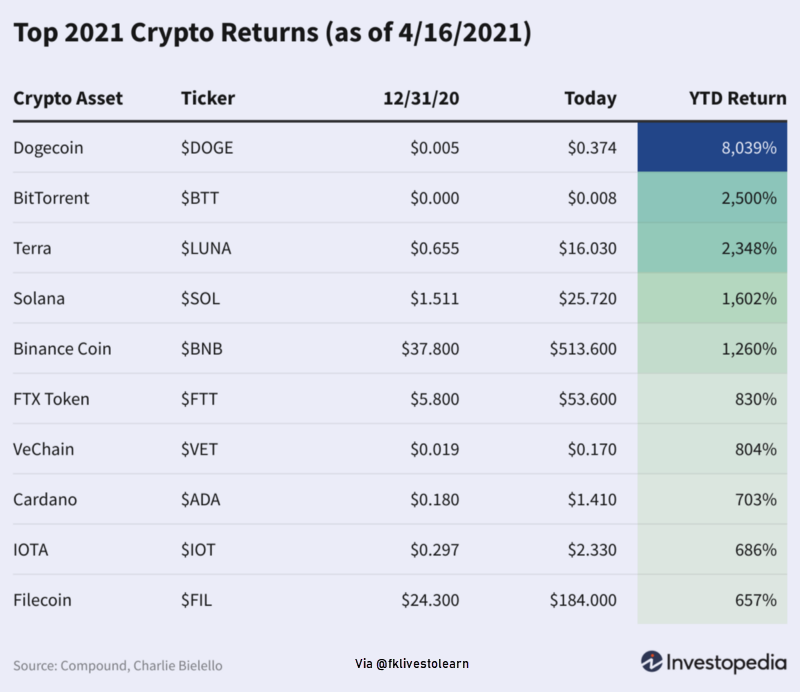
Global Business Week: Top 2021 Crypto returns so far
The state of Financial markets & Economies, Weekly Charts, Business Trends & Statistics
Record gains in the U.S equities continued to pile up as investors took heart from retail sales, housing starts, and jobless claims, that all came in better than the market was anticipating. Money keeps flowing into equities, with $25.6 billion going into stocks, and $47.3 billion coming out of cash — the most weekly outflows in four months. In the past five months, $602 billion has flowed into the global equity market.
For the week, the Nasdaq gained 1.1%, the Dow rose 1.2%, and S&P 500 increased 1.4%, it's sixth weekly gain in the past seven. This week brought us record highs for European markets as well, 180 U.S. stocks hitting all-time highs, the biggest jump in retail sales in eight years & Coinbase going public at a valuation that is larger than Intercontinental Exchange (ICE).
The US Dollar Index (DXY) extended the decline from the start of April. DXY has been stuck under the 200-Day SMA (92.21) as the 10-Year Treasury yield eased off from a fresh monthly low (1.53%), and recent market dynamics may keep the Greenback under pressure as the economic docket remains fairly light ahead of the Federal interest rate decision on April 28.
It proved to be a landmark week for cryptos as well. Trading platform Coinbase (COIN) rose 30% on the first day of its direct listing, before closing the day with a $86 billion valuation. The launch of the first public crypto company has given digital assets another boost as both the top two coins, Bitcoin & Ethereum, hit fresh all-time highs. Although they seem to be easing from the ATHs, the near-term outlook for cryptocurrencies remains strongly bullish.
Staying on the topic of cryptos, today’s featured chart (above) highlights the impressive gains of the digital assets this year (as of 04/16/2021). The chart is topped by Dogecoin — quasi-joke of a crypto token named after the Shiba Inu dog and hyped by Elon Musk, among others, soared 400% this week. It’s up more than 8,000% this year, and you can’t buy anything with it except some souvenirs and snacks at a Dallas Mavericks NBA game. Dogecoin has gone parabolic, but so have more than a handful of Alt. coins this year as investors seem willing to bet on anything.
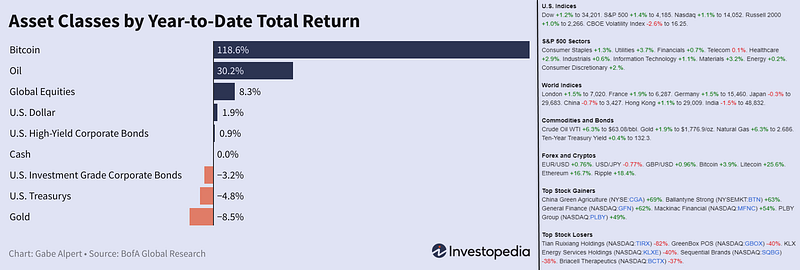
And as usual, before moving on to some of the other statistics for the week, here are some weekly & YTD numbers for various assets & financial markets (Figure 1).
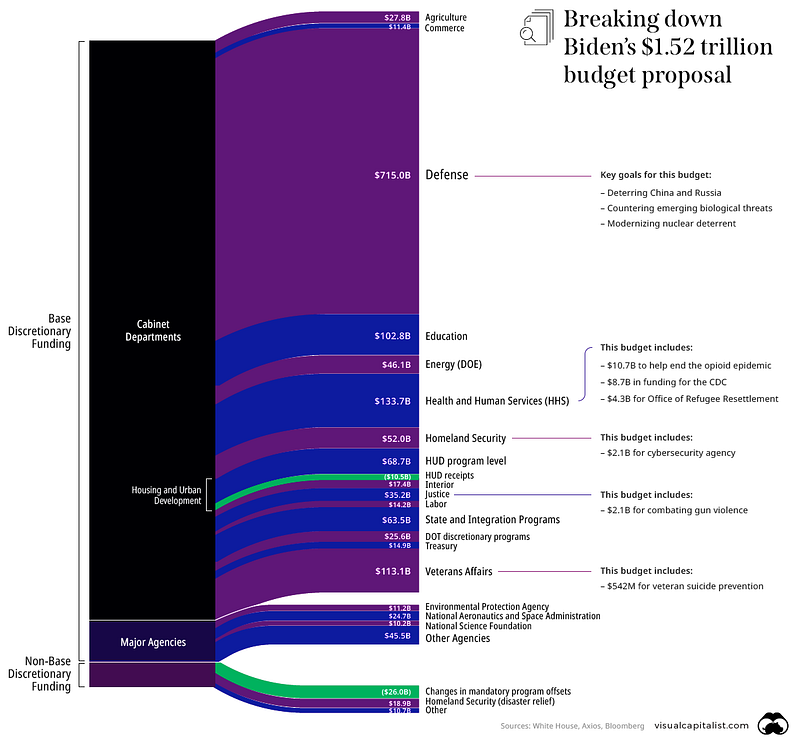
Visualizing U.S’s Budget Proposal for 2022
On April 9th, President Joe Biden released his first budget proposal plan for the 2022 fiscal year. The $1.52 trillion discretionary budget proposes boosts in funding that would help combat climate change, support disease control, and subsidize social programs (Figure 2). This infographic outlines some key takeaways from Biden’s budget proposal plan and highlights how funds could be allocated in the next fiscal year.
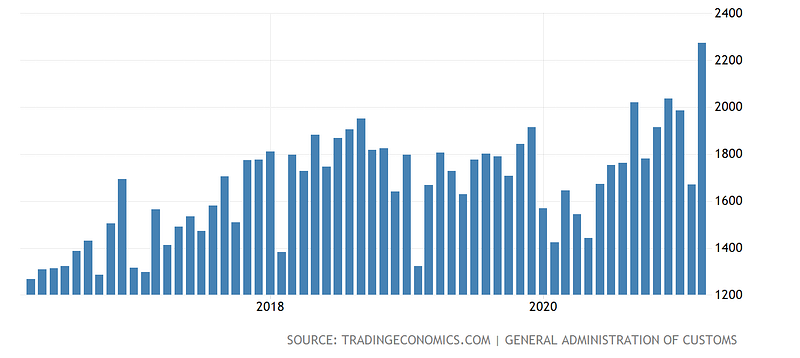
Chinese Imports at a Record-high
$227.34 billion was the new monthly record set for China’s imports in March. Imports were up 38.1% from the same month a year ago, representing the highest growth since February 2017 and smashing analyst expectations of a 23.3% increase (Figure 3). It’s also the sixth consecutive month of growth for imports. The surge in Chinese imports also caused the country’s trade surplus to narrow to $13.8 billion from $20 billion a year ago and $37.88 billion in February. This is the smallest it has been since the COVID-19 outbreak
Bitcoin is the Fastest Asset to Reach $1 Trillion
Historically, it’s taken multiple decades for companies to be worth $1 trillion. But the emerging class of crypto assets has broken all records when it comes to exponential gains and lofty valuations. For Bitcoin, it took just 12 short years to reach such a milestone. To help put things into perspective, here’s a look at how long it took America’s biggest tech companies to reach the $1 trillion market cap (Figure 4).

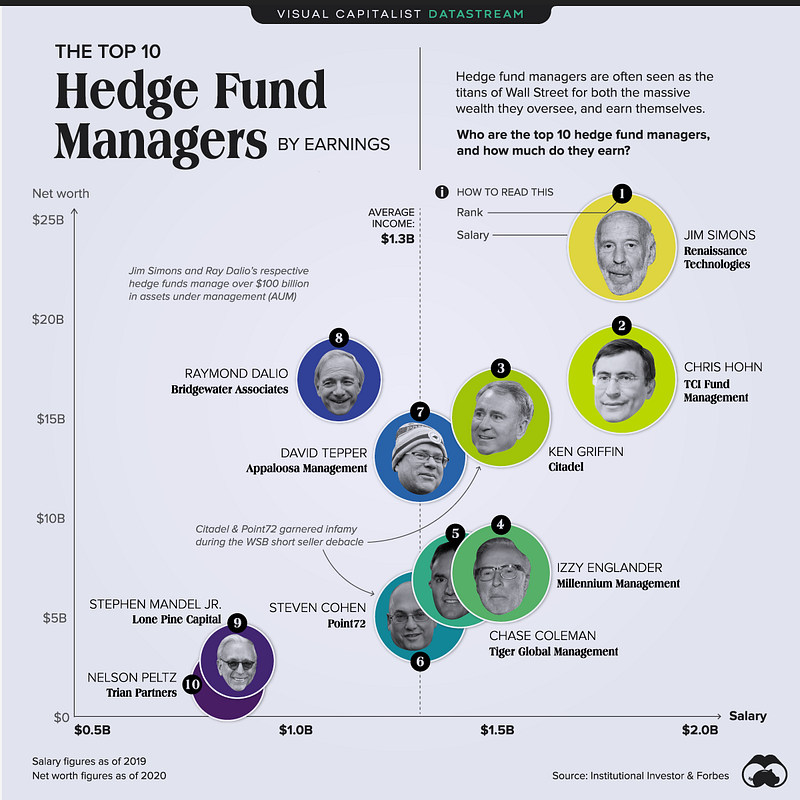
The Top 10 Hedge Fund Managers by Earnings
The world of hedge funds has recently garnered notoriety during the GameStop/WSB debacle, in which an us-versus-them mentality began to brew for smaller investors. In markets, hedge fund managers are considered the big fish in the pond. Not only do they oversee billions of dollars in capital, they often earn some billions as well. Here’s a look at the earnings of the top 10 managers, where yearly earnings range between a high of $1.8 billion and a low of $835 million (Figure 5).
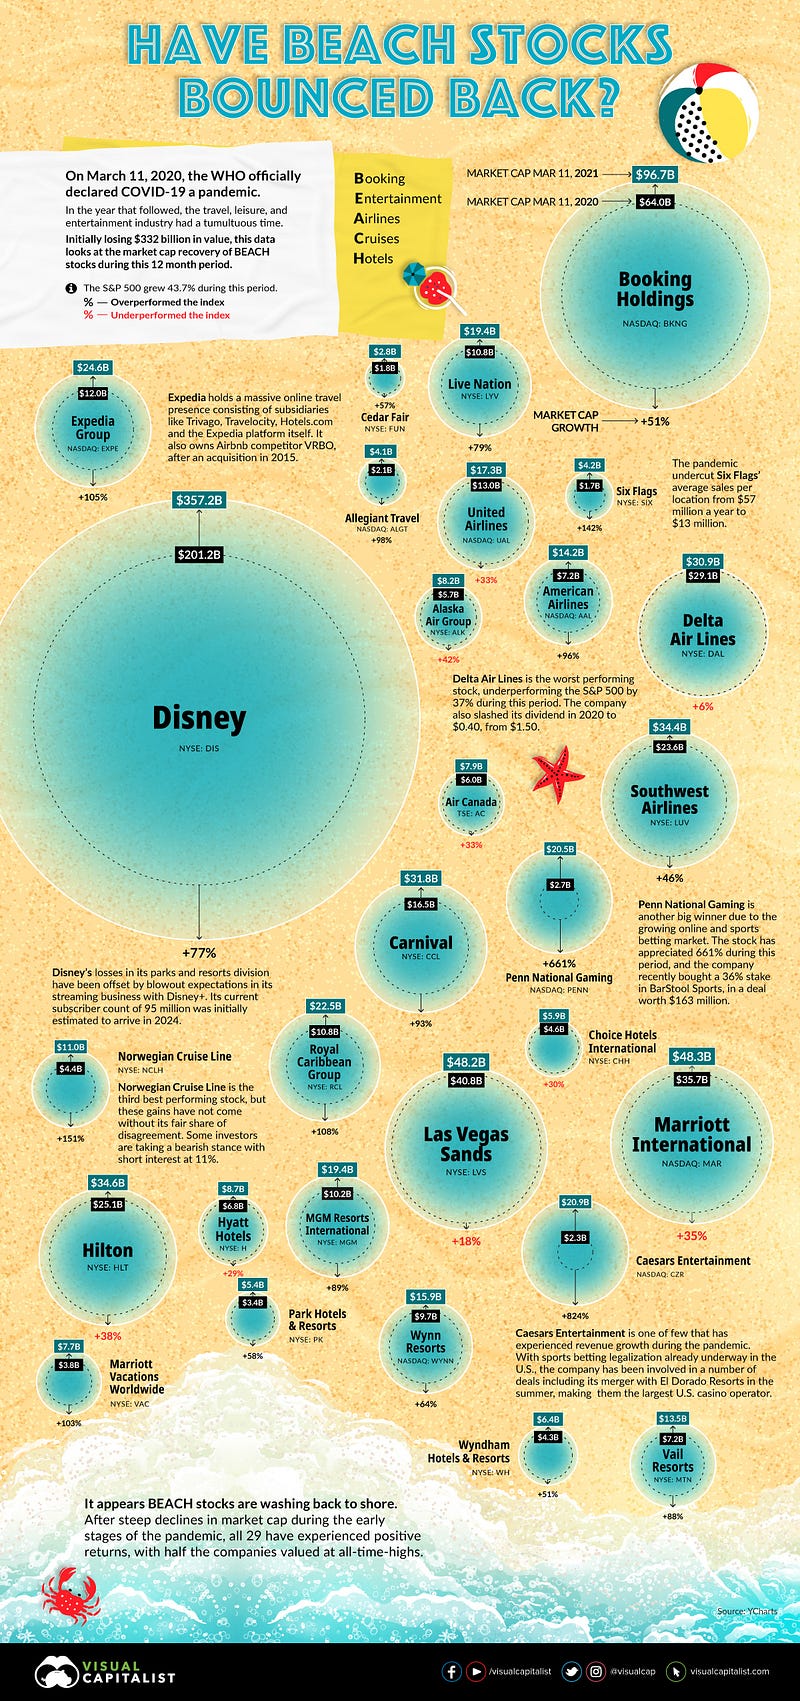
‘BEACH’ Stocks Bounce Back
The travel and entertainment industries have had the hardest year with the pandemic. During the initial stages, when panic and uncertainty ran rife, BEACH stocks–booking, entertainment, airlines, cruises, and hotels — were left scrambling. Collectively, $332 billion in market cap washed away. Now, it appears the tide might be turning for these companies, buoyed by vaccine breakthroughs and glimmers of hope for a return to normalcy. The infographic below (Figure 6) looks at the growth in market cap value across BEACH stocks one year from when the WHO officially declared COVID-19 a pandemic.
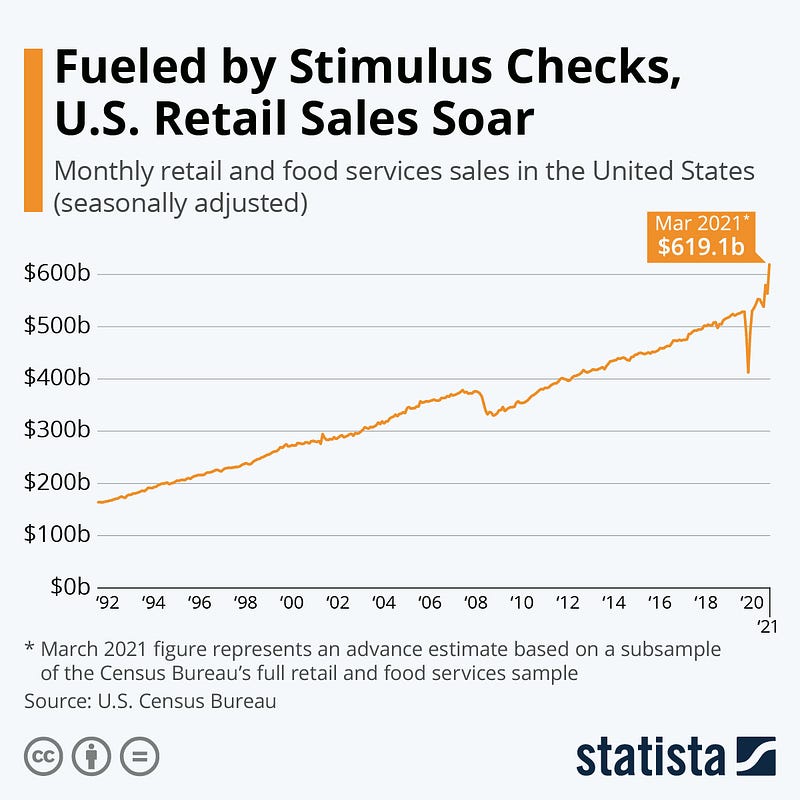
U.S Retail Sector Soars on Additional Stimulus
According to new figures published by the U.S. Census Bureau, retail sales jumped 9.8% on a seasonally adjusted basis last month, as all types of retailers except for restaurants and drinking places saw sales exceed pre-pandemic levels (Figure 7). After a disappointing holiday season, U.S. consumer spending picked up steam in January 2021, when retail sales jumped 7.7% from the December total on a seasonally adjusted basis. Following a brief setback in February, consumer spending picked up again in March, jumping to $619 billion, as consumers flocked to stores to spend their $1,400 stimulus checks.
Market Humor: All Together on Global Taxation?

Previous Edition of GBW
