
WEEKLY BUSINESS ROUNDUP
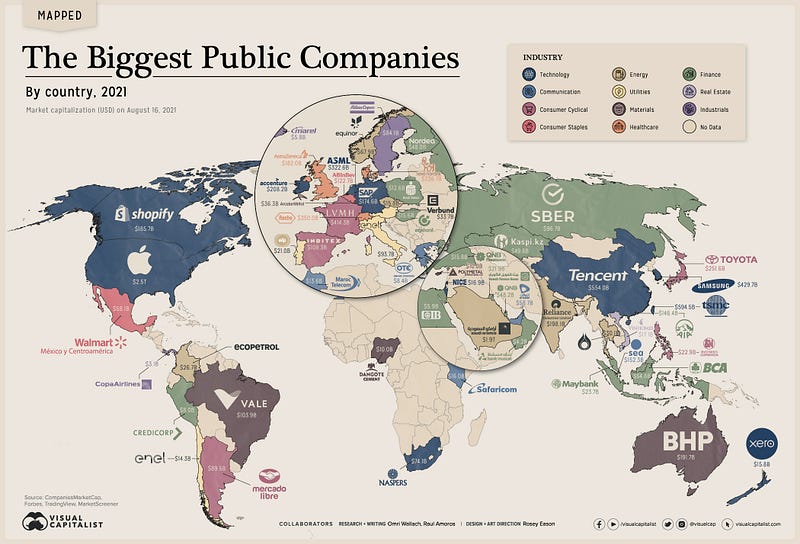
Global Business Week: Visualizing the biggest companies in 60 countries
The state of Financial markets & Economies, Weekly Charts, Business Trends & Statistics
Volatility spiked again in the U.S market rising 11% on Friday as major U.S. stock averages sank on concerns about the American consumer and the economic recovery. Dow lost half a percent, while the S&P 500 and Nasdaq were both down 0.9%. Interestingly, investors showed no enthusiasm for bonds either, with the yield on the 10-year Treasury note reaching 1.37% for only the second time in two months. The woes were compounded further by Friday’s quadruple witching of stock futures and options expiring. Stocks touched their lowest levels in four weeks Friday — the jittery mood was demonstrated by this week’s $45 billion in capital outflows from money market funds, the largest outflow of the year.
For the week, the S&P 500 slipped 0.6%, the Nasdaq Composite closed down 0.5% and the Dow Jones average fell just 0.1%. The weekly drop in the Dow was the third in the row, which has not happened since September of 2020. Buyers were also holding back ahead of next week’s Federal Reserve meeting, which is expected to provide more insights as to when policymakers will begin to taper their $120 billion a month bond-buying stimulus program.
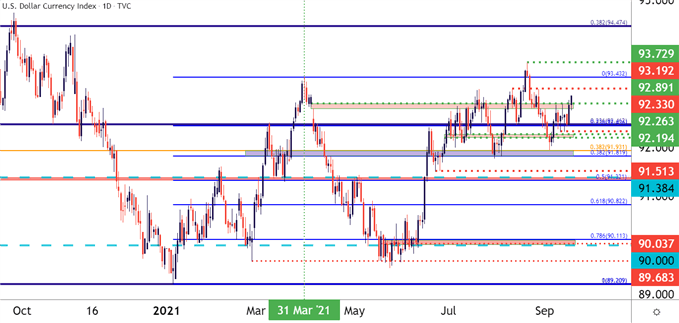
With all the risk-off mood in the equities, the greenback stood to benefit from the moves. The benchmark dollar index (DXY) pushed to a fresh September high after the release of University of Michigan Consumer Sentiment data — closing @ 93.25. DXY seems to be cutting through the familiar range of the past few weeks, as inflation expectations edged up in the consumer sentiment report.
The September FOMC rate decision is being keenly anticipated for details on tapering of asset purchases. On a longer-term basis, the US Dollar remains in a state of mean reversion, as looked at in the Q3 forecast on the currency; and price action is approaching some key watermarks on the chart. A bit higher is a swing-high around 93.20 and a little above that is the Q1 high at 93.43. The next level up is 2021 high, plotted at 93.73.
Consolidation in the cryptos led by Bitcoin has kept the bullish tone, as both Bitcoin and Ethereum have continued to post higher lows — trading at $48.1k and $3,3438 respectively, at the time of writing. The fake news announcement of Litecoin's partnership with Walmart propelled the digital currency before giving up all the gains after the revelation. Network outages in the smart contract platform Solana caused it to fall from the recent high of $216 to $133, however, it has managed to rebound to over $163 currently. But then again, that’s the nature of cryptocurrencies — volatile & unpredictable.
Despite accounting for the largest market caps worldwide — with trillion-dollar companies like Apple and contenders including Tencent and Samsung — tech wealth is largely concentrated in just a handful of countries. Visual Capitalist mapped the largest company by market cap across 60 countries in August 2021 using market data from CompaniesMarketCap, TradingView, and MarketScreener.
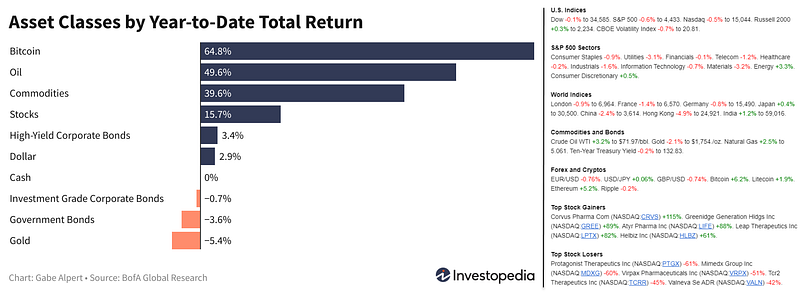
And finally, before moving on to some other statistics, here are the weekly & YTD numbers from various markets and different assets (Figure 1).
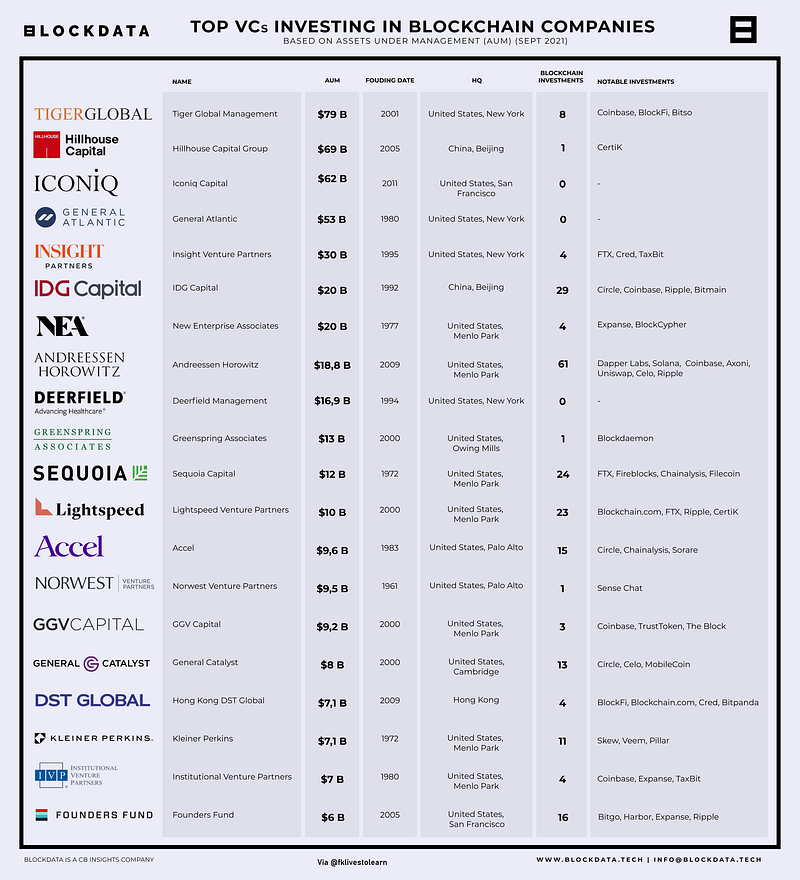
Top VCs Investing in Blockchain Companies
Many of the world’s top venture funds are investing in blockchain and crypto companies. 17 of the 20 largest venture funds in the world (based on Assets under management-AUM) have invested in companies that build blockchain technology (Figure 2). That’s 85% of the world’s largest investors who are committing part of their funds to the blockchain space. The most active funds in terms of the number of investments in blockchain companies are Andreessen Horowitz (61), IDG Capital (29), and Accel (24).
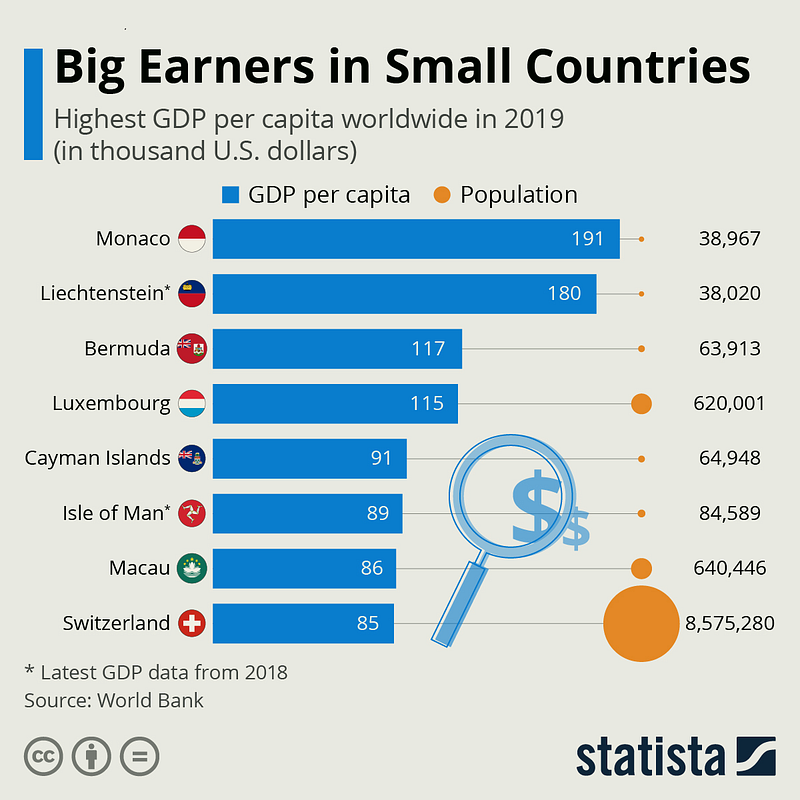
Big Earners in Small Countries
The Chinese special administrative region of Macau is well-known for its gambling tourism. With the government of the People’s Republic potentially tightening regulations following a public consultation concerning the gambling market, stock prices of the biggest casino operators plummeted recently. This move might potentially affect Macau’s ranking in the regions with the highest gross domestic product (GDP) per capita in the future. At the moment, it still easily managed to crack the top eight list in 2019 as the chart indicates (Figure 3). Filling up the rest of the list are some of the more expected countries and regions, especially tax havens like Monaco and Liechtenstein as well as offshore financial and insurance firm hotspots like Bermuda, the Isle of Man & the Cayman Islands.
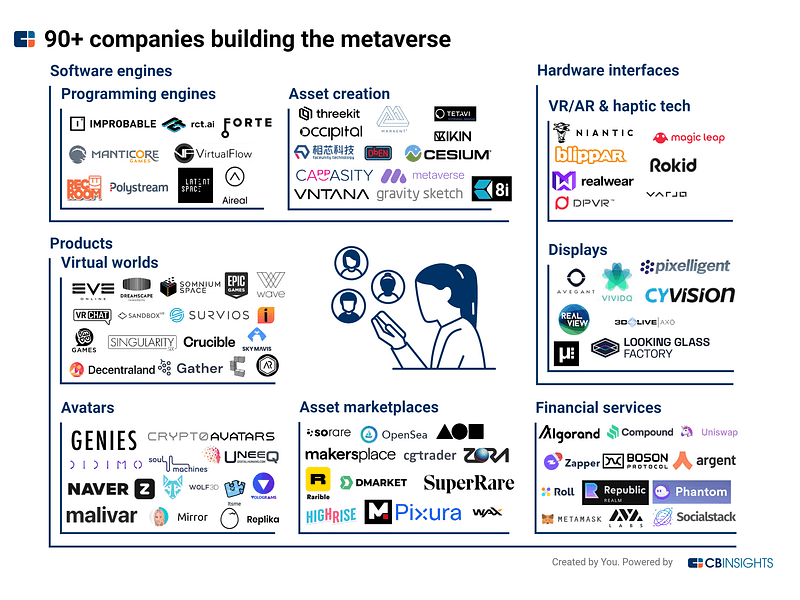
Companies Building the Metaverse
The metaverse is the tech world’s latest obsession — despite originating from a dystopic sci-fi novel. The metaverse refers to the idea of a shared, persistent virtual space, akin to a digital mirror of the real world — but without any of the constraints. Today, brands and retailers are trying to foster new forms of customer engagement in the metaverse to sell more products, fintechs are jumping on the opportunity to capitalize on new financial needs, while a slew of startups are creating new virtual products entirely, from avatars to crypto collectibles. Using CB Insights data (Figure 4), here is a break of 90+ startups building the foundational blocks to the metaverse.
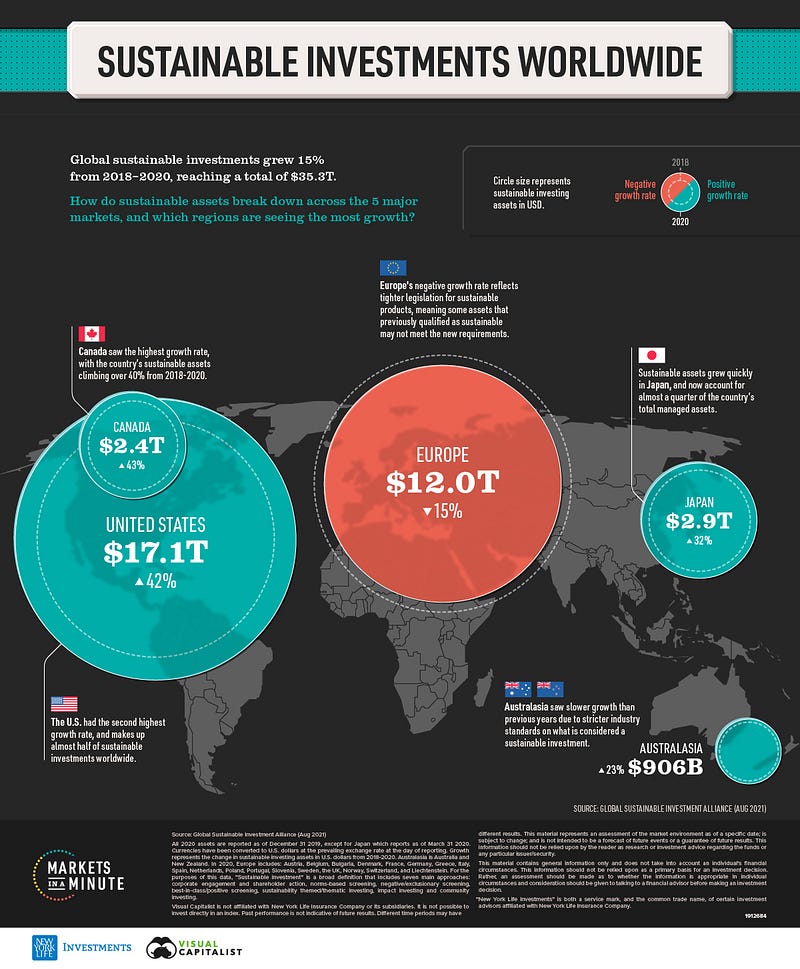
Global Sustainable Investments
Sustainable investing is top-of-mind for many investors, but how fast is it actually growing? Between 2018 and 2020, global sustainable investing assets grew 15% to reach $35.3 trillion (Figure 5). This works out to more than a third of total assets under management. In this Markets in a Minute from New York Life Investments, they explore the value and growth of sustainable investing assets across five major markets.
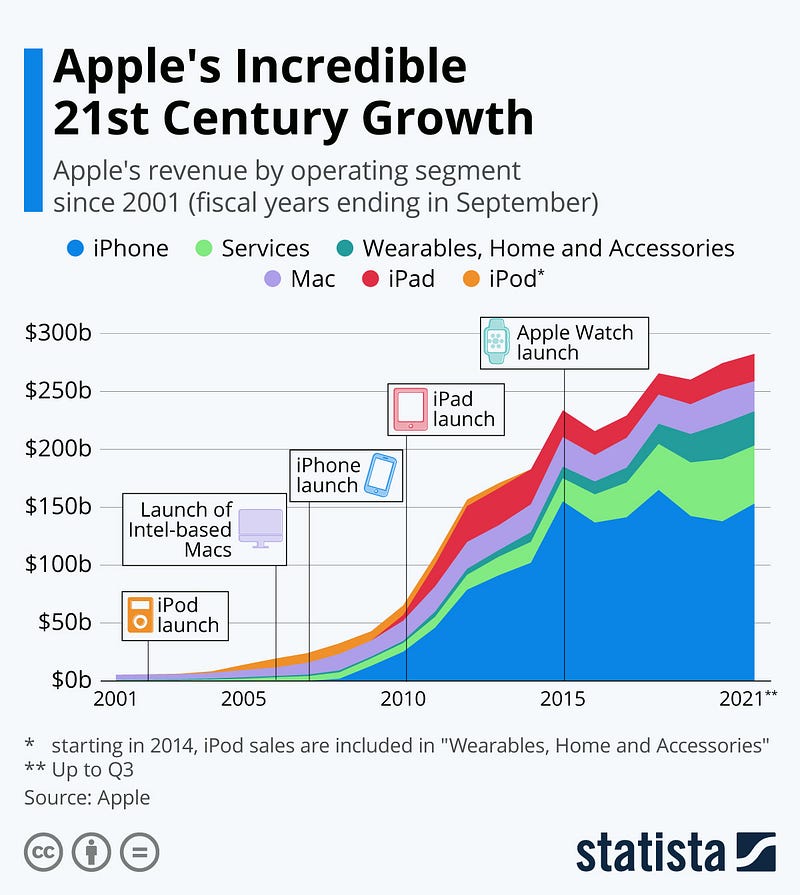
Apple’s Incredible Growth
While a quarterly profit of $10+ billion is something we have come to expect from Apple over the past few years, it’s important to remember just how remarkable the numbers that Apple routinely posts are in the grand scheme of things. According to the latest Fortune 500 list, 25 U.S. companies posted an ANNUAL profit above $10 billion in 2019. Apple did so for 13 consecutive QUARTERS. The following chart (Figure 6) shows the incredible transformation that the company has undergone since the beginning of the 21st century. In 2001, Apple’s total revenue amounted to $5.36 billion but came with a loss of $25 million. For the fiscal year that ended September 26, 2020, Apple posted a net profit of $57.4 billion on revenue of $274.5 billion, meaning the company managed to maintain an average sales growth of 23% over almost two decades.
Global Market Share of E-commerce Firms
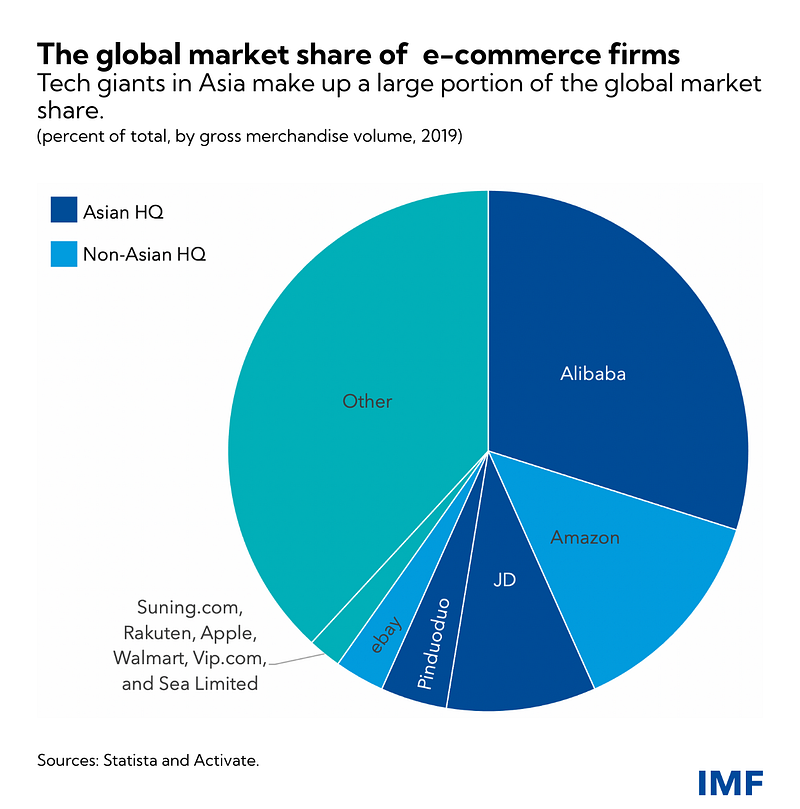
Digitalization — the technology that powers fintech, e-commerce, and online services, enables us to make mobile money transfers, purchase goods & services online, and interact with people across the globe. It has created some of the largest global businesses, such as online platforms and marketplaces connecting producers and consumers across the world. Asia alone has roughly two billion internet users, with considerable room to grow. Asia’s advanced and emerging market economies have several locally headquartered tech giants — including Alibaba, JD.com, Tencent, Rakuten — and host foreign tech giants such as Facebook (Figure 7). A new set of agreed global tax reforms will change where these tech giants and other global giants pay taxes.
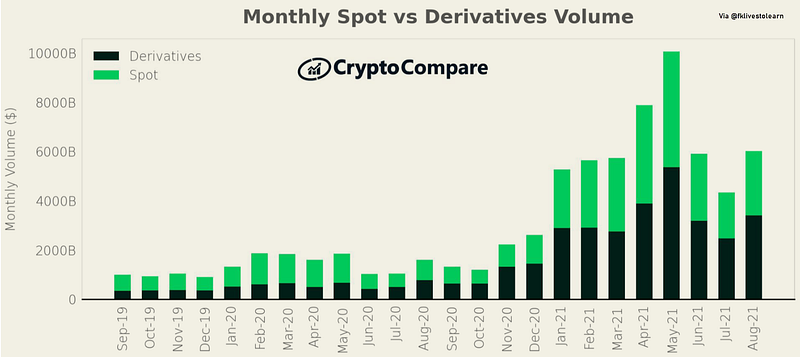
Crypto Derivative Market Rises
The Crypto Derivatives market reached its highest volume in May. Derivatives volumes increased by 37.8% in August to $3.4 trillion (Figure 8). The derivatives market now represents 56.6% of the total crypto market (vs 56.9% in July).
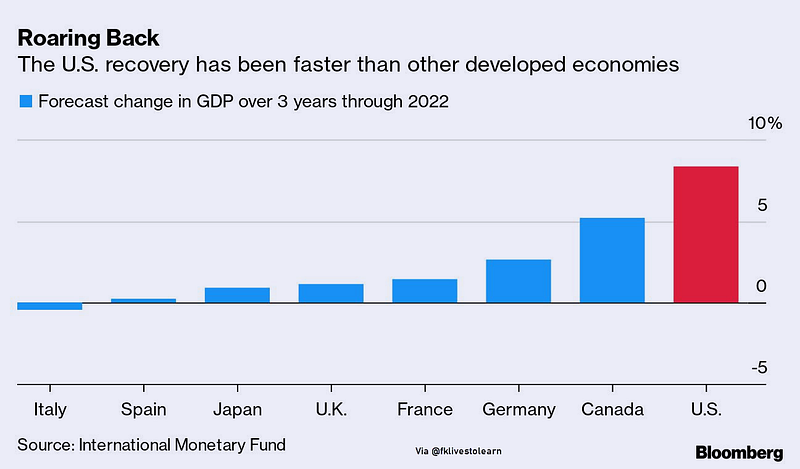
U.S Posts the Fastest Recovery
Covid inflation is everywhere, but among advanced economies the U.S. is looking like an outlier, thanks in part to its massive financial bailout. The American recovery is outpacing others (Figure 9) and the consensus is that high inflation won’t last long. But even so, its current elevated level has the potential to cause some interesting problems.
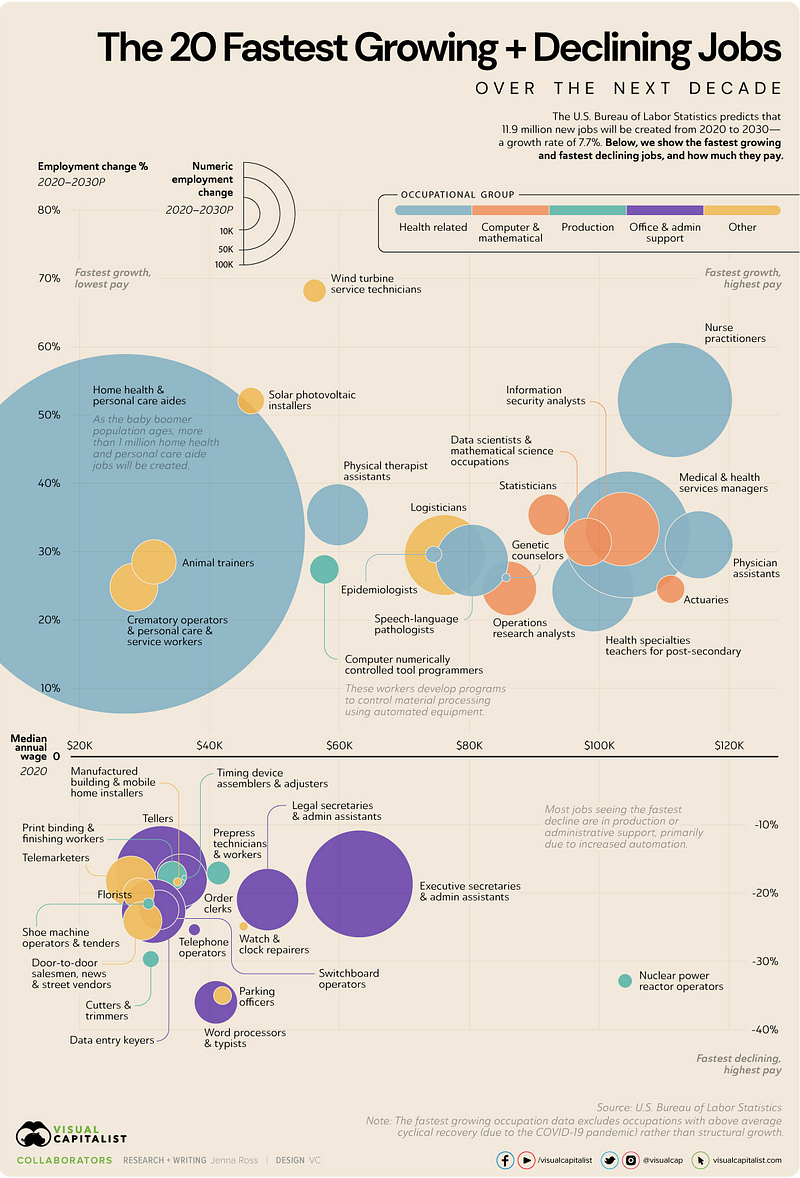
20 Fastest-Growing & Declining Jobs
The employment landscape is constantly shifting. While agricultural jobs played a big role in the 19th century, a large portion of U.S. jobs today are in administration, sales, or transportation. So how can job seekers identify the fastest growing jobs of the future? The U.S. Bureau of Labor Statistics (BLS) projects there will be 11.9 million new jobs created from 2020 to 2030, an overall growth rate of 7.7% (Figure 10). However, some jobs have a growth rate that far exceeds this level. In this infographic, BLS data was used to show the fastest growing jobs & fastest declining jobs — and how much they each pay.
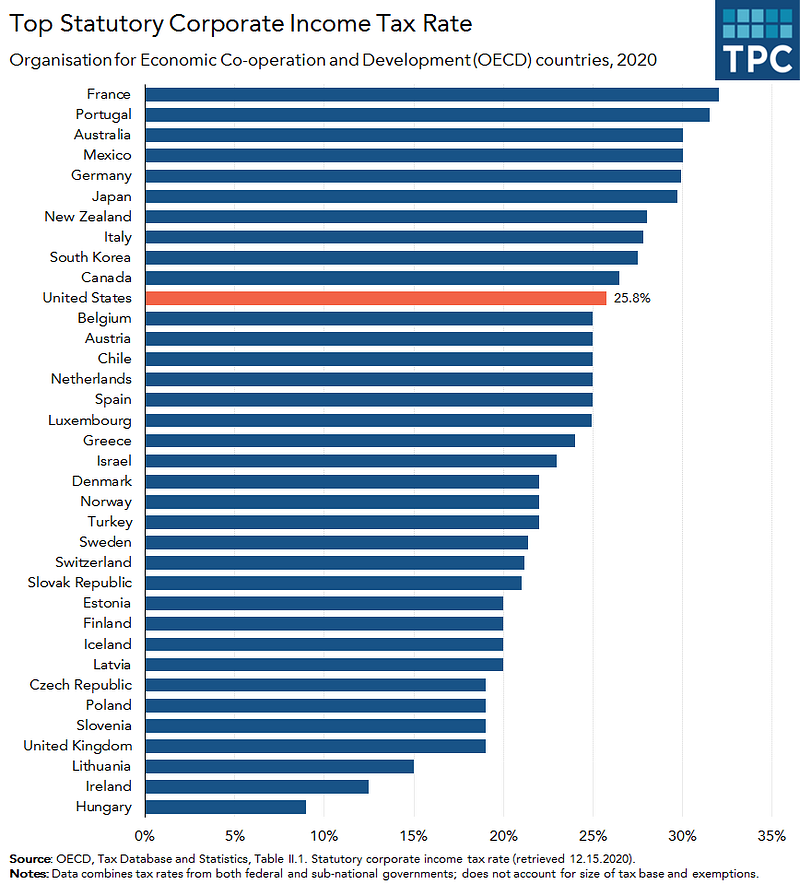
Tax Rates in OECD Countries
Democrats in U.S. House of Representatives are ready to pull back on proposed increases in corporate and capital gains taxes (Figure 11) in an effort to pass President Biden’s multi-trillion dollar social program spending bill. The tax-writing Ways and Means Committee will move to raise corporate taxes from the current 21% to 26.5%, below the president’s planned 28%, according to various reports. However, businesses that earn less than $5 million per year would have their rate stay the same or drop. The capital gains tax would go from 20% to 25%, below Biden’s suggestion of 39.6%. In addition, individuals making more than $5 million a year would face a 3% surtax.
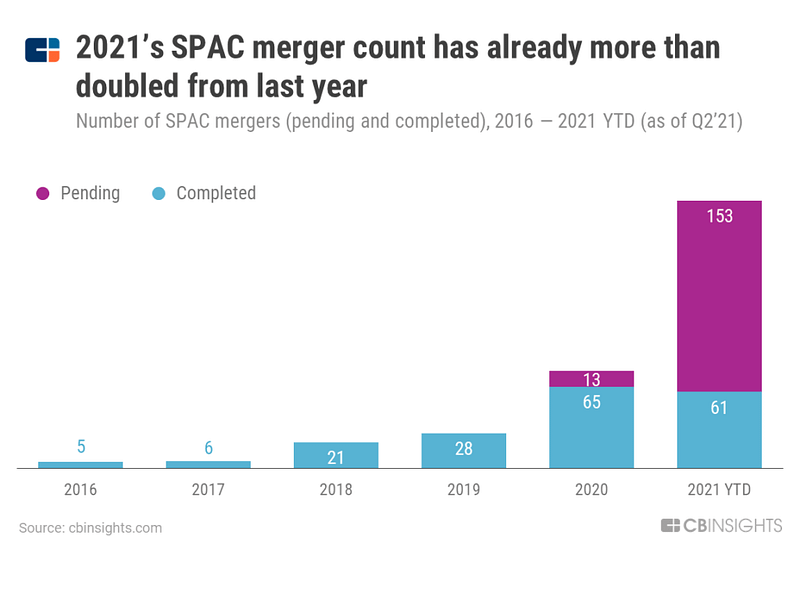
SPAC mania has taken hold of the public markets, but recent regulatory scrutiny suggests the craze might be subsiding. A special purpose acquisition company (SPAC) is a “blank check” shell corporation designed to take companies public without going through the traditional initial public offering process. Instead, they go public as shell companies, then later acquire and merge target companies to bring them public on the stock market. Though SPACs have been around for decades, the financial maneuver has gained traction over the last year, as more private companies eye exit opportunities and as the Covid-19 pandemic continues to inject uncertainty in the IPO market. In fact, the number of SPAC mergers (including both announced and completed acquisitions of target companies) in 2021 has already more than doubled 2020’s full-year totals (Figure 12).
Market Humor: Putin’s Pipe Brings Relief to Europe’s Gas Markets

Previous Edition of GBW
