
WEEKLY BUSINESS ROUNDUP
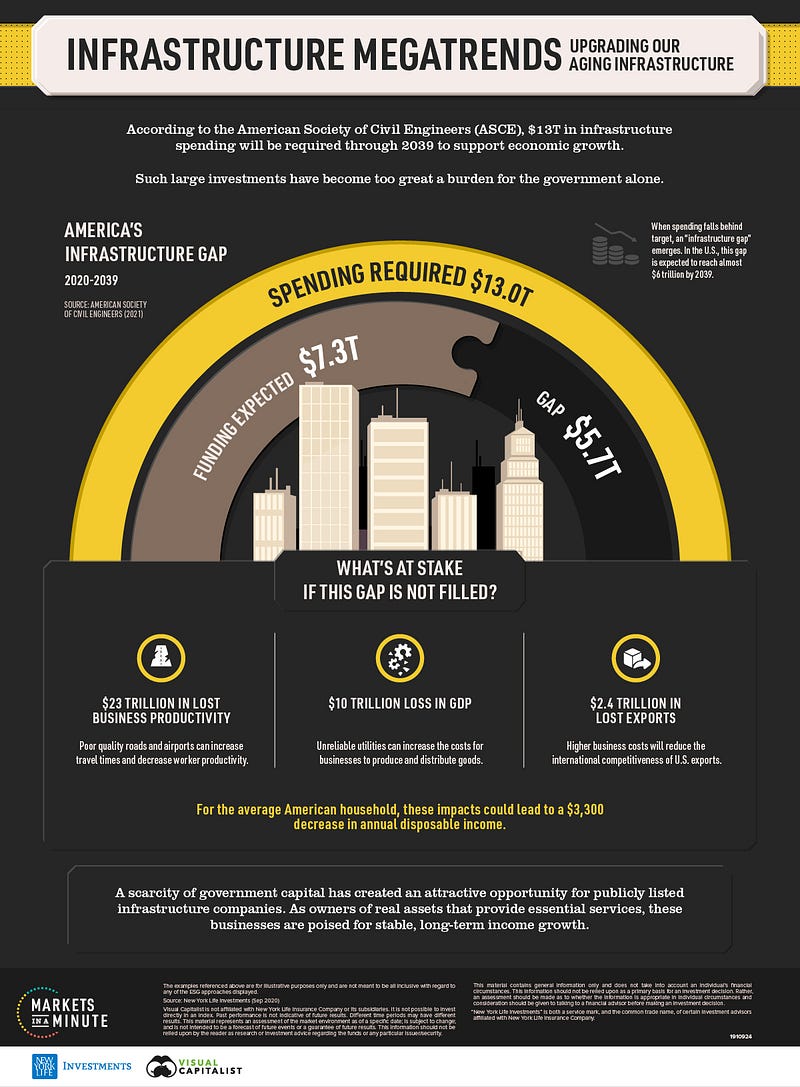
Global Business Week: Visualizing the $5.7 Trillion U.S infrastructure investment gap
The state of Financial markets & Economies, Weekly Charts, Business Trends & Statistics
Heavy selling in U.S stocks earlier last week gave way to buying with conviction on Friday, as stocks rallied throughout the day. The Nasdaq led gains for the second day in a row, with big tech stocks like Microsoft setting the pace. Oil prices continued to slide, falling another 2.26% on Friday — down 16% from recent highs as fears of the spread of COVID-19 continue to weigh on demand projections for the rest of the year. But oil is not the only commodity in a correction. Copper prices are down 19% from recent highs, palladium is down 23%, and lumber prices have crashed more than 70% from recent highs.
Hong Kong is the only major stock market currently in a bear market — the Hang Seng Index dropped 1.8% Friday, bringing its losses to 20% from its most recent peak as investors struggle to value companies amid a broad crackdown by Chinese authorities across a wide swath of industries. For the week, all three major U.S indices ended lower, with the Dow slipping 1.1%, the S&P 500 declining 0.6%, and the Nasdaq dropping 0.77%. The losses weren’t steep but the sentiment has certainly turned sour with the onset of the delta variant, which is casting doubt on the pace of economic recovery.
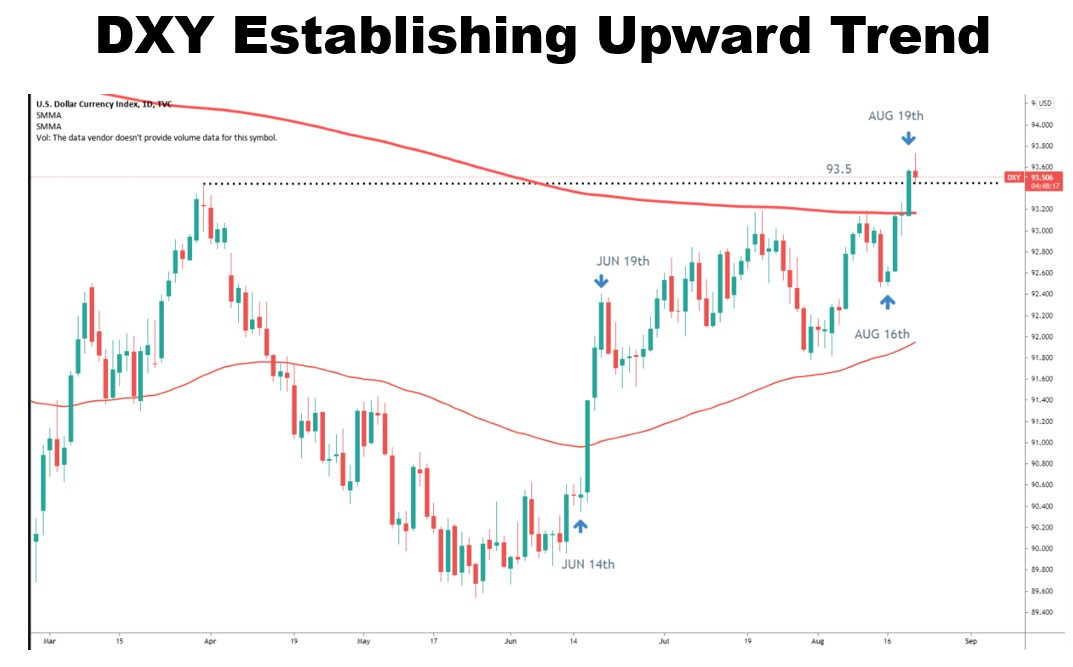
The benchmark U.S dollar index (DXY) has moved up to fresh yearly highs as traders have begun to anticipate a faster-than-expected timeline to the Federal Reserve’s stimulus withdrawal — closing the week @ 93.46. DXY made a new high (93.72) for the year. The index broke above the 200 simple moving average (SMA) signaling the end of a long-term downtrend.
A large part of this comes from the Fed suggesting they are close to reaching their benchmark employment target, thus allowing them to increase interest rates. Weekly jobless claims have been continually dropping, supporting this narrative. The largest component of the DXY Index, EUR/USD rates, dropped by -0.81% and closed below 1.1700 for the first time since October 2020. Escalating delta variant concerns have the investors scrambling towards the safety of the reserve currency.
Moving on to the digital assets, they have continued to make new highs ever since the lows they carved in mid-July. Any corrections have been minor and have been met with renewed buying interest, pushing the cryptos higher — at the time of writing, Bitcoin is a whisker away from the psychological barrier of $50k, while Ethereum closes in on $3300. Bitcoin has retraced its path back to the mid-May level. With the recent rise, mainstream cryptos have also regained the $2 trillion market cap. The short-term momentum remains strongly bullish as BTC & ETH head back to their all-time highs (ATHs). Cardano (ADA) is an exception here, which has already charted a new ATH of $2.58.
Today’s featured infographic from the Markets in a Minute chart from New York Life Investments quantifies America’s infrastructure gap using research from the American Society of Civil Engineers (ASCE). With each passing year, significant investment is required to maintain and improve America’s infrastructure. When these investments fall behind their targets, an infrastructure gap can emerge.
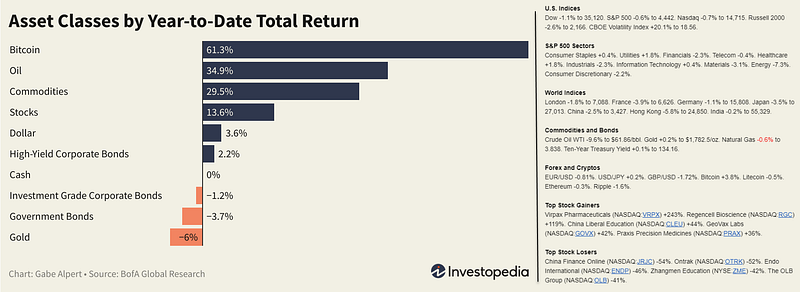
And finally, before moving on to some other statistics, here are the weekly & YTD numbers from various markets and different assets (Figure 1).
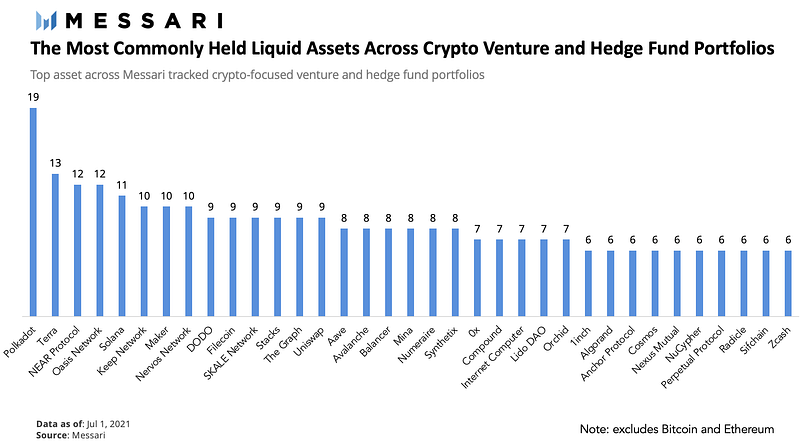
Top Crypto Assets in Portfolios
Polkadot, founded in 2016 by Parity and the Web3 Foundation (both founded by Gavin Wood), describes itself as a layer 0 protocol. Polkadot is #1 in VC funding, #1 GitHub activity, and #9 in market cap. The chart below (Figure 2) lists the most commonly held liquid digital assets across various Crypto Venture and Hedge Fund portfolios. The list excludes the top two cryptos — Bitcoin & Ethereum.
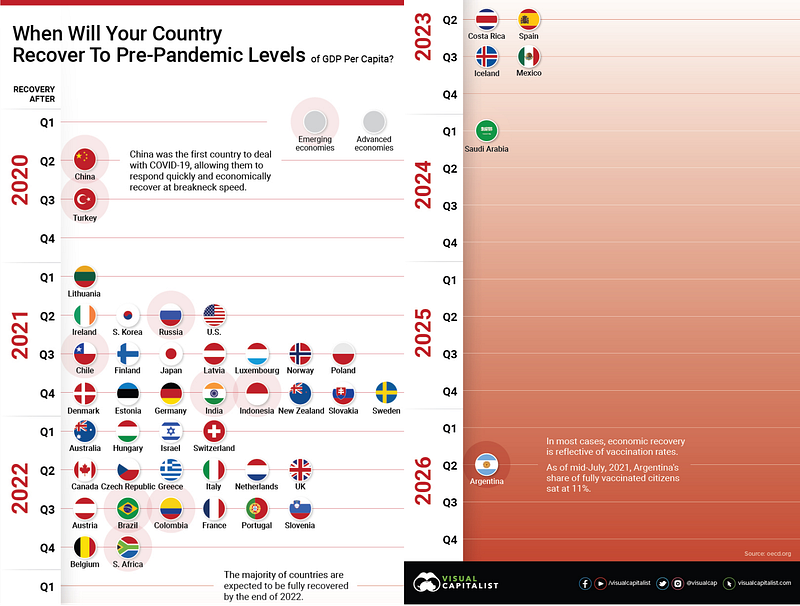
Economic Recovery to Pre-Pandemic Levels
This chart using data from the OECD (Figure 3) anticipates when countries will economically recover from the global pandemic, based on getting back to pre-pandemic levels of GDP per capita. At the top, China and the U.S. are recovering at breakneck speed. In fact, China already reached pre-pandemic GDP per capita levels just after Q2 2020. On the other end, some countries are looking at years, when it comes to their recovery date. Saudi Arabia isn’t expected to recover until after Q1 2024, and Argentina is estimated to have an even slower recovery, occurring only after Q2 2026.
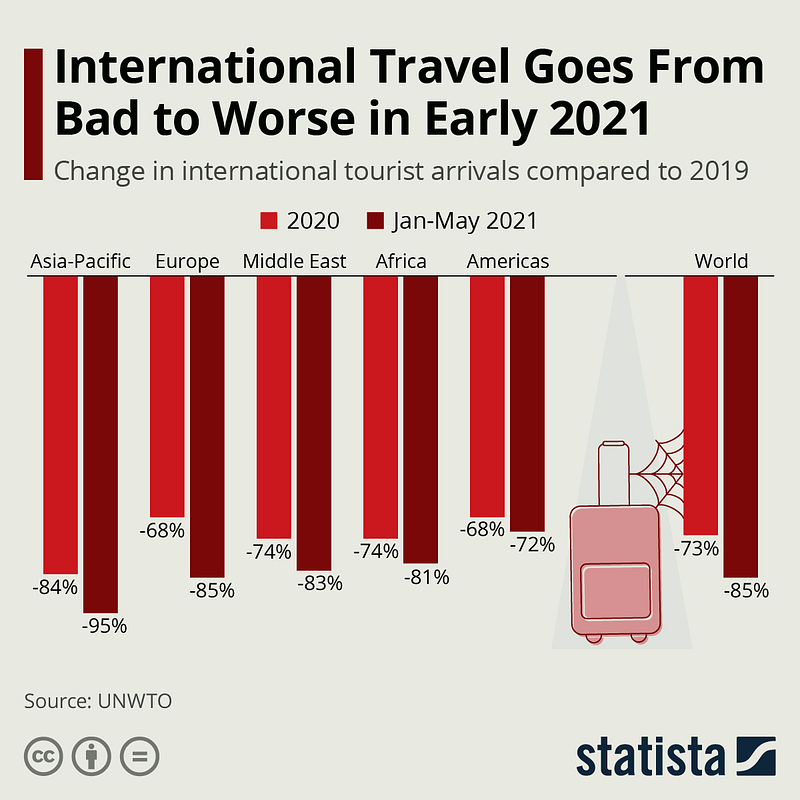
International Travel gets Worse in 2021
Coming off the worst year on record for international travel, many had hoped that things could only get better in 2021 for the battered tourism industry. As it turns out, the situation went from bad to worse, however, at least when looking at international tourist arrivals in the first five months of the year. Having dropped by more than one billion visitors or 73% in 2020, international tourist arrivals declined by 85% between January and May 2021 when compared to the same period of 2019. According to the UNWTO, tourism destinations around the world recorded 460 million fewer international arrivals in the first five months of 2021 compared to 2019. Even compared to 2020, when COVID-19’s crippling effect on international travel became apparent in March, arrivals declined by 65%, as travel restrictions remained in place in large parts of the world. The chart below (Figure 4) breaks down the decline in various regions of the World.
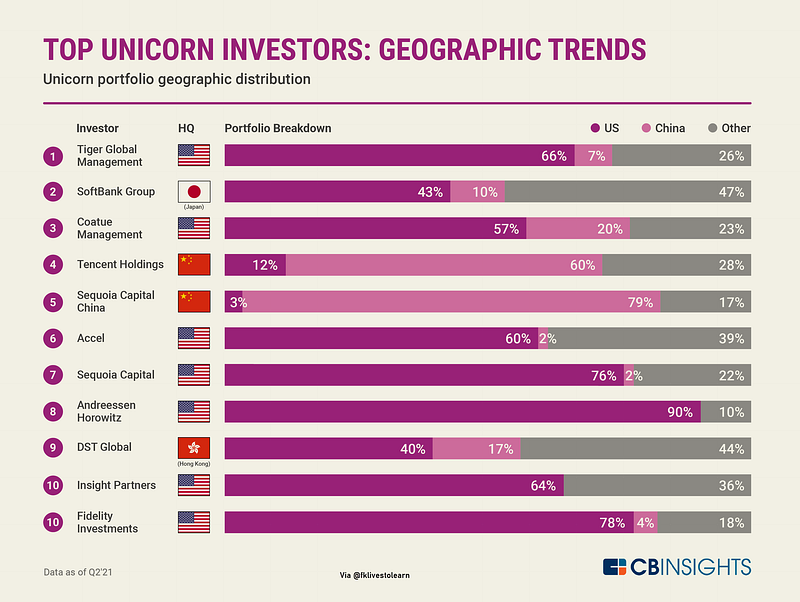
Top Unicorn Investors
There are currently nearly 800 unicorns (private companies valued at $1B+) from 40+ countries around the world. Of those, about half are based in the US (50%), followed by China (20%). Using CB Insights data, we look into which investors have backed the most unicorns. Below, the infographic (Figure 5) ranks them by unicorn count and breaks down the geographic distribution of the unicorns in their portfolios. Among the top 10 unicorn investors, unicorn portfolio companies are largely US-based, followed by China-based unicorns. China-based investors have backed proportionally more Chinese unicorns, and US-based investors have backed proportionally more American unicorns.
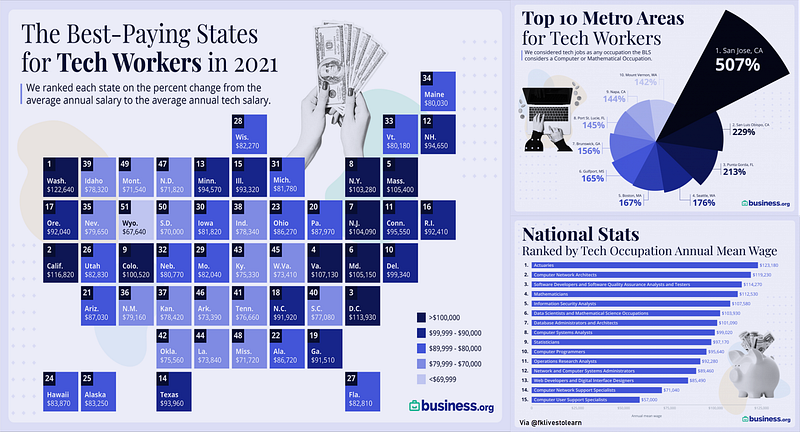
State of Tech Workers in the U.S
In 2020, despite the economic turmoil caused by the global pandemic, America’s tech sector experienced rapid growth. Last year, the total number of U.S. tech jobs grew by 60,000. Because of this demand, U.S. employers are willing to pay for the right talent — on average, tech workers in the U.S. earn about 61% more than the average salary. But some tech workers make more than others, depending on where they live. This infographic by business.org (Figure 6) uses data from the Bureau of Labor Statistics (BLS) to highlight the average annual tech salaries in each state, compared to the average salary of other occupations. It also touches on the top-paying metro areas, and what type of tech jobs offer the highest compensation across the country.
Balance Sheets of Major Central Banks
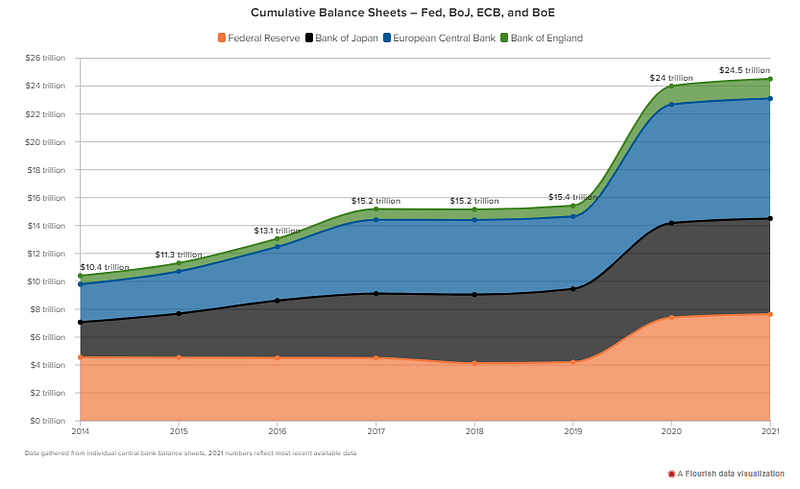
The Wall Street Journal reported recently that Federal Reserve officials are nearing an agreement to begin winding down the central bank’s accommodative monetary policy in about three months if the economic recovery continues — and to end its $120-billion-per-month asset purchase program by the middle of next year. Federal Reserve officials allegedly discussed how and when to pare their $80 billion in monthly Treasury securities purchases and $40 billion in monthly mortgage securities purchases at their July 27–28 meeting. The chart below (Figure 7 ) highlights the cumulative balance sheets of the four major central banks.
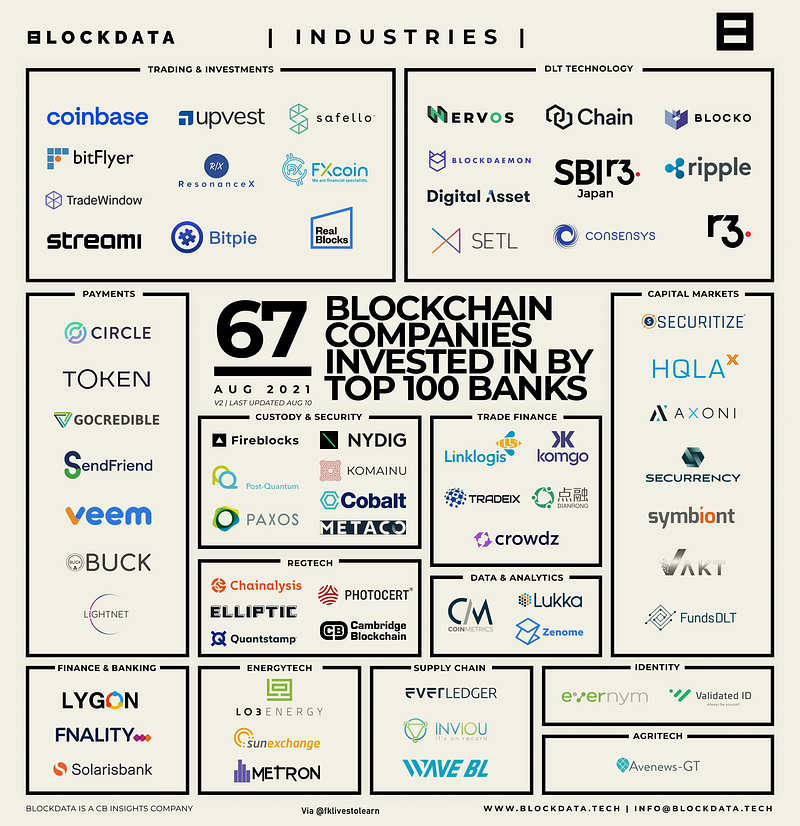
Blockchain Investment by Top Banks
Many top banks have been making investments in cryptocurrency and blockchain companies (Figure 8). They want to strengthen their strategic position, better understand blockchain use cases, and potentially integrate blockchain technology into their financial systems. The companies that have received the most investment with top banks among their investors are Circle ($711M), Dianrong ($649M), Ripple ($392.9M), NYDIG ($355M), Paxos ($340M), Digital Asset ($262.12M), Fireblocks ($179M) and Lukka ($97.3M).
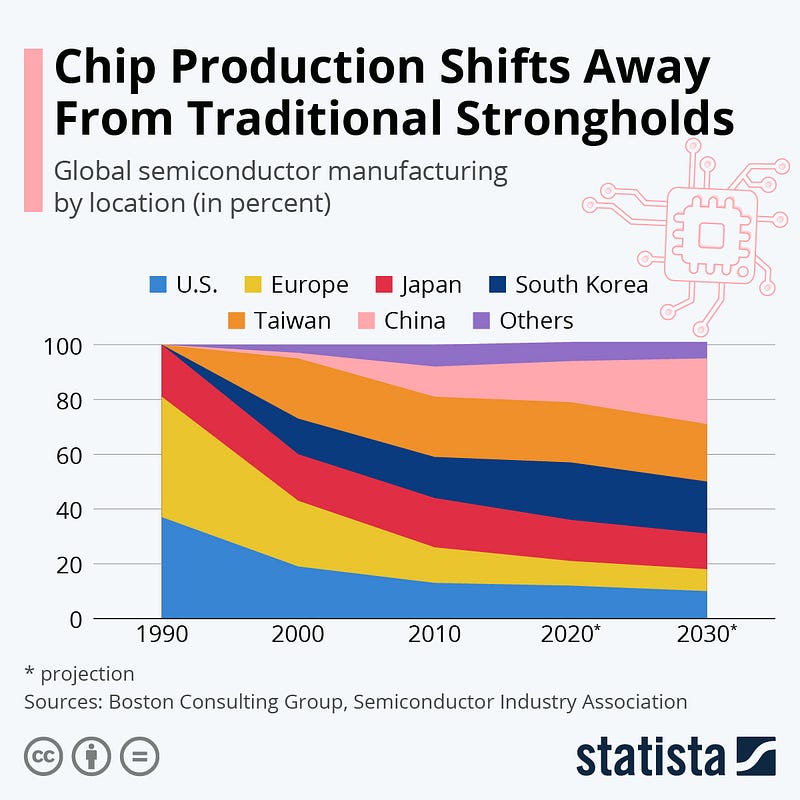
Global Chip Production Shifts
Semiconductors have come back into international focus after shortages, aggravated by the COVID-19 pandemic, shone a spotlight on the crucial part computer chips play for many major industries, for example, car manufacturing. Data from Boston Consulting Group and the Semiconductor Industry Association shows how much chip production has moved away from its traditional strongholds (Figure 9) in the last decades. In 1990, Japan, Europe & the U.S. dominated semiconductor manufacturing, but with South Korea, Taiwan & finally Mainland China entering the market, the three initial manufacturing locations were reduced to a combined market share of only around 35% in 2020. The decline is projected to continue, if more slowly, until 2030.
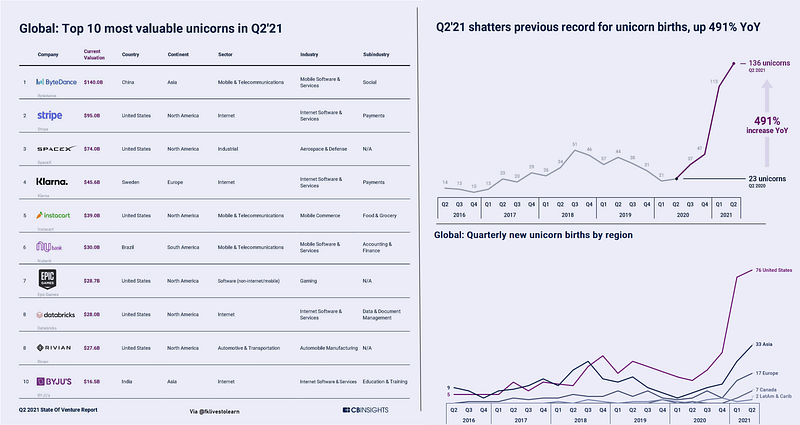
Top 10 Unicorns in Q2 2021
According to CB Insights data, Q2 21 saw the birth of 136 new unicorns globally — nearly 6x the 23 unicorns born a year ago in Q2 20, and already higher than the 128 unicorns born in all of 2020 (Figure 10). The most valuable unicorns in the quarter were ByteDance ($140B valuation), Stripe ($95B), SpaceX ($74B), Klarna ($45.6B), and Instacart ($39B). The majority of newly minted Q2’21 unicorns are based in the US (76), followed by Asia (33), Europe (17), and Canada (7), and Latin America and the Caribbean (2). The US has seen exceptional growth in new unicorns, as 148 have come into being in the first half of 2021, nearly surpassing 2020’s total of 152.
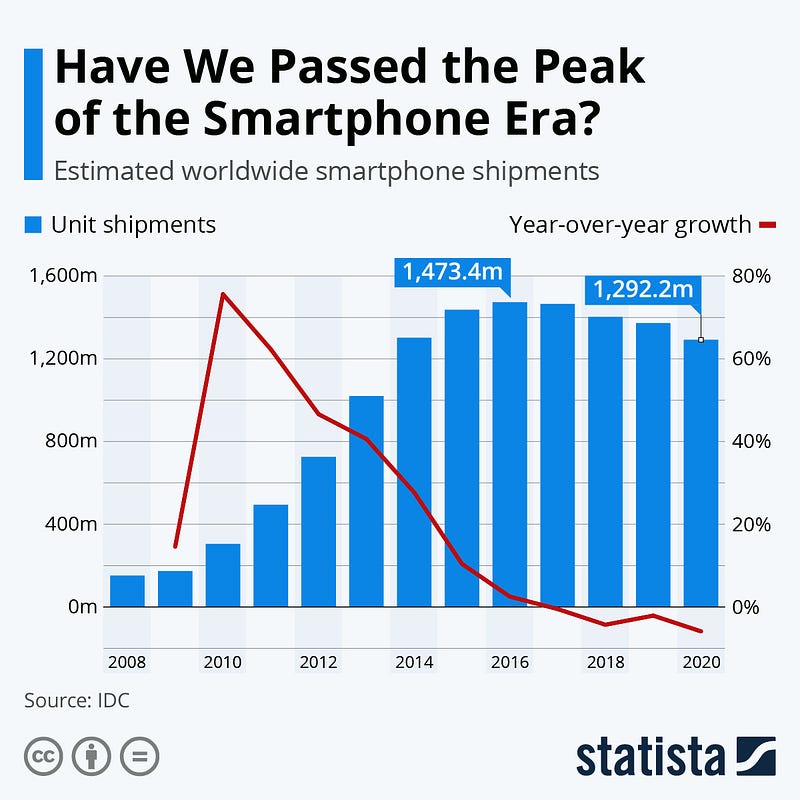
Has the Smartphones Era peaked?
The smartphone boom has died down a bit, as market saturation and a lack of real innovation have led to declining sales for the past few years. And while the market did return to positive growth in Q4 2020 and carried that momentum through the first half of 2021 (Figure 11), it remains doubtful if smartphone shipments will ever return to the level reached in 2016. Back then, Apple, Samsung, and the like shipped 1,473 million devices, marking the industry’s peak so far. By 2020, shipments had dropped back to 1,292 million units, the lowest total since 2013.
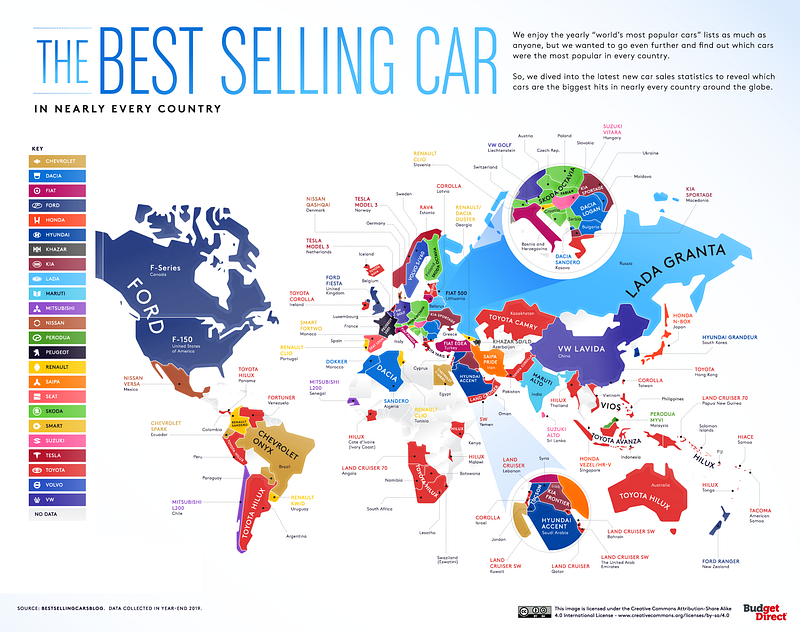
Best Selling Cars Globally
Each country has different preferences for goods, and vehicles are no different. Consumers in a dense country might prefer smaller cars, while countries with wide expanses (and parking spots) open the way for larger trucks. Likewise, rugged terrain might call for vehicles that can adapt and scale quickly. And it is also a question of which manufacturer invested in the country. As the world’s largest automakers have raced to attract consumers in every corner of the globe, they built factories, renamed models, and even built specific cars to fit the tastes of individual countries. This infographic from Budget Direct Car Insurance (Figure 12) highlights the best-selling vehicles in the world, using 2019 year-end sales data.
Market Humor: Will Delta derail the Taper Plans?
Previous Edition of GBW
