
WEEKLY BUSINESS ROUNDUP
Global Business Week: How does factor investing work?
The state of Financial markets & Economies, Weekly Charts, Business Trends & Statistics
Mixed inflation data, strong job growth, waning consumer confidence & increasing worries about the delta variant created problems for investors last week in charting a clear path forward. Although Friday closed flat on a low volume for all three U.S benchmark indices, the S&P 500 and Dow finished up for the second week in a row while Nasdaq slipped — for the week, the Dow led the major averages, up 0.9% as S&P gained 0.7% and Nasdaq edged down 0.1%. It was also another record-breaking week for European stock markets.
The yield on the 10-year U.S. Treasury slipped below 1.3% following the University of Michigan’s consumer sentiment report, which showed a 13% monthly decline to its lowest levels since 2011. As the Q2 earnings season winds down, we are going to hear from major retailers and chipmakers in the coming week. Home Depot, Target & Walmart will all report quarterly results, and they will give us a better picture of the waxing and waning of consumer confidence and spending in the second quarter.
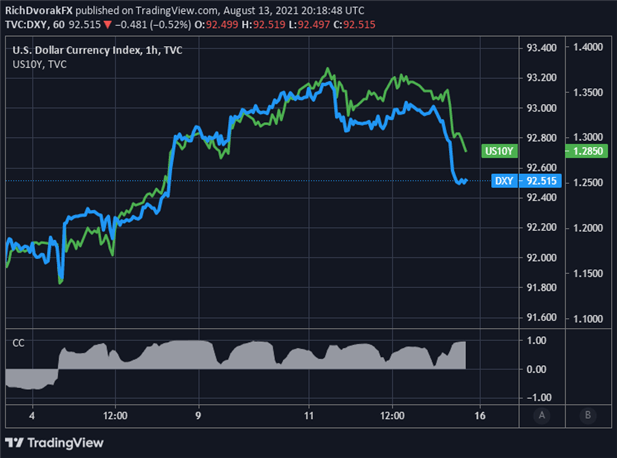
US Dollar bears sent the broader DXY Index recoiling -0.3% lower last week as the Inflation, consumer sentiment data weighed negatively on Treasury yields. FOMC minutes due for release in the coming week may reinvigorate the case for USD bulls. Losses in DXY this week have erased about half of the gains notched post-NFPs and leaves the broader US Dollar up 0.4% month-to-date. Looking at the strong relationship between the Treasury yields and DXY, upcoming FOMC minutes would dictate the direction going forward. DXY closed @ 92.52.
Digital currencies also took the center stage this week being part of the U.S infrastructure bill debate. Talk of regulation & the biggest DeFi hack, however, didn't dampen the appetite for Bitcoin and the associated cryptos. Bitcoin has topped $48k while Ethereum has surpassed $3,300 so far. Other Alt. coins like Cardano has seen exponential gains, now trending close to its all-time high of $2.46, reached back in May. Opportunites to trade Bitcoin continue to grow — Valkyrie is the latest issuer looking to launch a Bitcoin-themed ETF. Soon to be launched Valkyrie Bitcoin Strategy ETF, will be an actively managed fund that has not been given a formal ticker symbol yet.
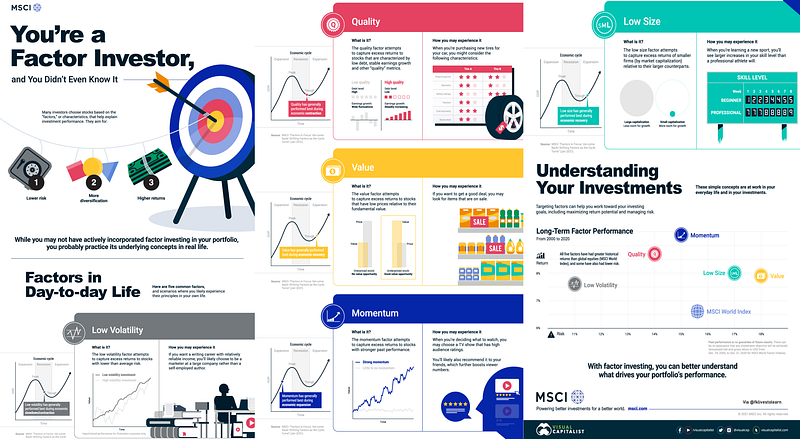
Factor investing can provide investors with a data-driven understanding. of how their investments perform in certain scenarios. Today’s featured infographic from MSCI (featured above) uses scenarios from everyday life to explain how factor investing works.
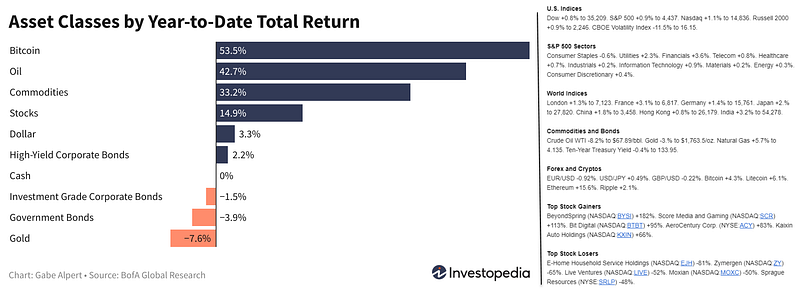
And finally, before moving on to some other statistics, here are the weekly & YTD numbers from various markets and different assets (Figure 1).
Global Supply Chain Congestion
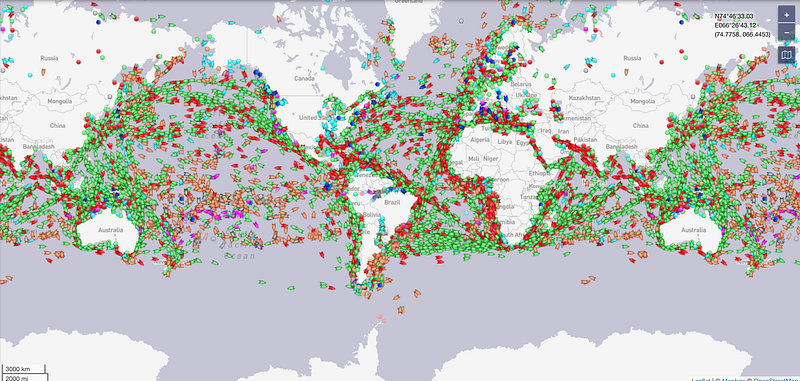
The global supply chain was dealt another blow as China’s largest port, Ningbo-Zhoushan, on the eastern coast of the country, was partially shut down earlier today due to a new COVID-19 outbreak. That will have a compounding impact on major ports throughout Asia and around the world, which are already reeling due to the ongoing pandemic — leading to more delays and higher prices for imports. The planet’s waterways are pretty congested right now. Here’s a live map from MarineTraffic.com (Figure 2).
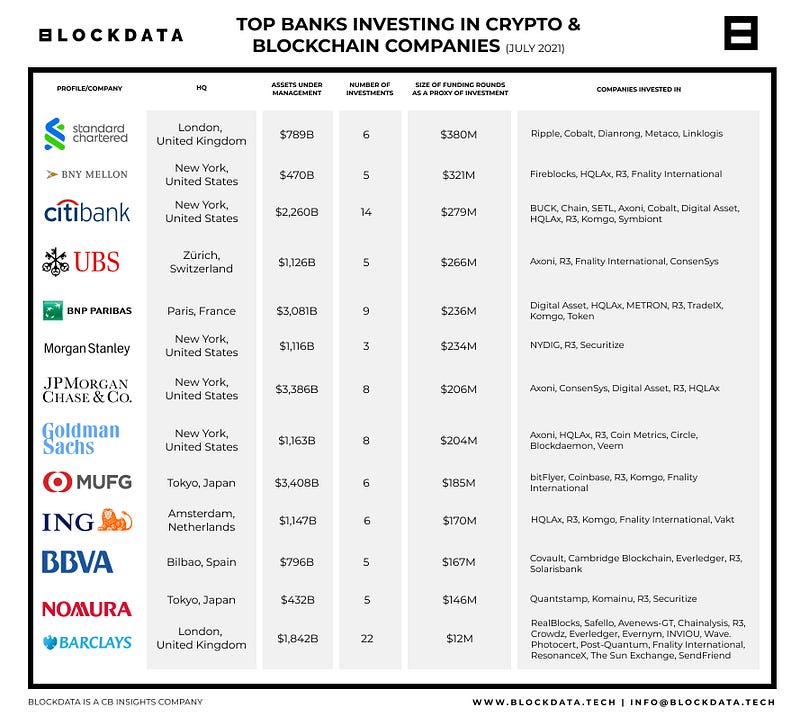
Top Banks Investing in Crypto/Blockchain
According to Blockdata, Most major banks are investing in crypto and blockchain-related companies in 2021. Out of the top 100 banks by assets under management, 55 have invested in cryptocurrency and/or blockchain-related companies (Figure 3). Either directly, or through subsidiaries. The most active investors based on the number of investments in blockchain companies are Barclays (19), Citigroup (9), Goldman Sachs (8), J.P. Morgan Chase (7), and BNP Paribas (6).
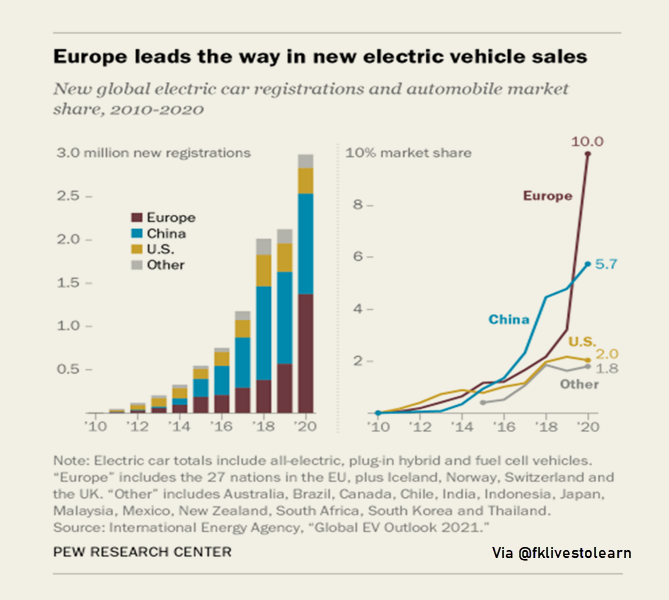
Europe Leads the Way in EV Sales
Europe and China far outpace the US in sales (Figure 4) of electric vehicles (EVs). But this week, US President Joe Biden set an aggressive target for EVs to make up 50% of new US car sales by 2030. As auto companies prepare for the transition to EVs, EV tech funding is on pace for a new high this year. Top investors in the space span the US, China, Germany, and South Korea, focusing on battery tech, EV charging, and more.
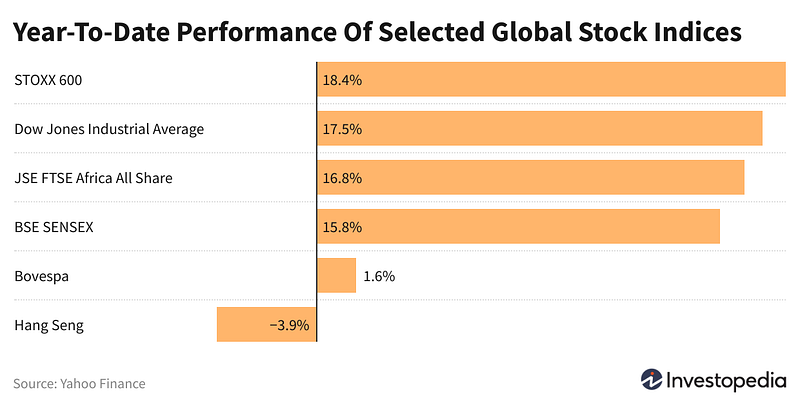
Longest Winning Streak Since 1990
Europe’s STOXX 600 index headed toward its tenth consecutive session of record highs last Friday as it inched up 0.2%. The index is approaching its longest winning streak since 1990 (Figure 5) and has outperformed most other national or regional equity benchmarks this year, including the Dow Jones Industrial Average. The rally has been fueled in large part by strong earnings, which have been 11% higher than expected this quarter across Europe according to Goldman Sachs.
Key Trends for the Future of Ecommerce
eCommerce is on the rise, with the pandemic significantly accelerating the already present shift to online shopping, which is set to transform how most people interact with all forms of retail brands. That makes it an essential consideration for nearly all businesses. And even within that broader shift, there are more specific, more niche buying and browsing trends that could impact your strategy, and alter your marketing approach. The infographic from Grazziti Interactive (Figure 6) recently put together this overview of rising eCommerce trends, which could provide some good food for thought for your strategy.

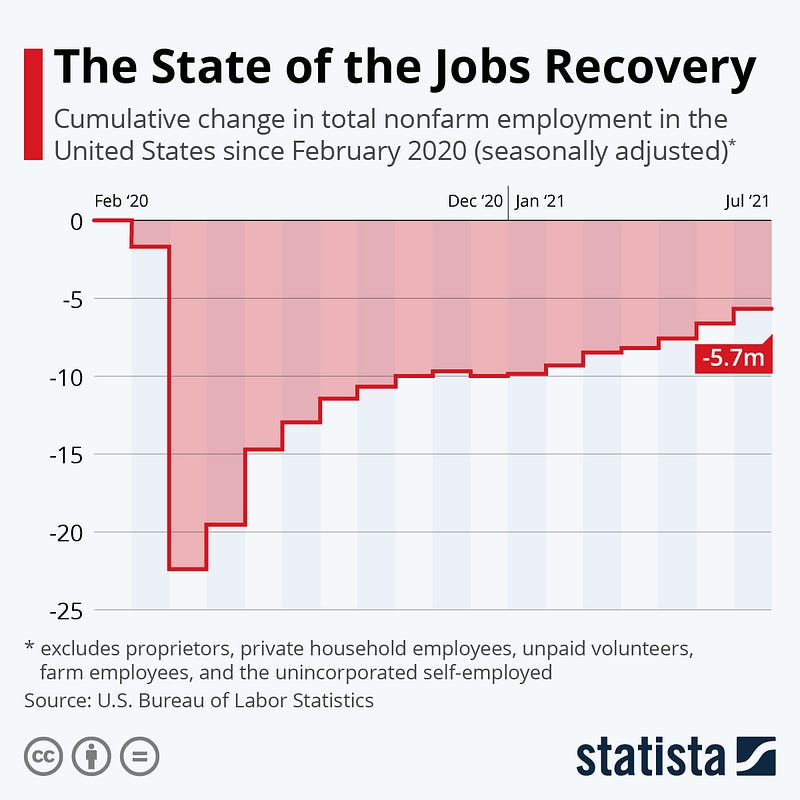
U.S Jobs Recovery
While the rise in COVID-19 infections and the slowdown of the vaccine rollout has put a dent in Americans’ optimism in recent weeks, the labor market continued its recovery at full speed in July. The latest jobs report showed the largest job gain since August 2020, as the U.S. economy added 943,000 jobs last month. As the following chart shows (Figure 7), jobs recovery, in general, is taking longer than many people had originally hoped. After a quick initial rebound, job gains slowed to a crawl in late 2020 before picking up pace again in 2021. In July 2021, almost 17 months into the pandemic, total nonfarm employment was still 5.7 million jobs short of the 152.5 million jobs reported in February 2020.
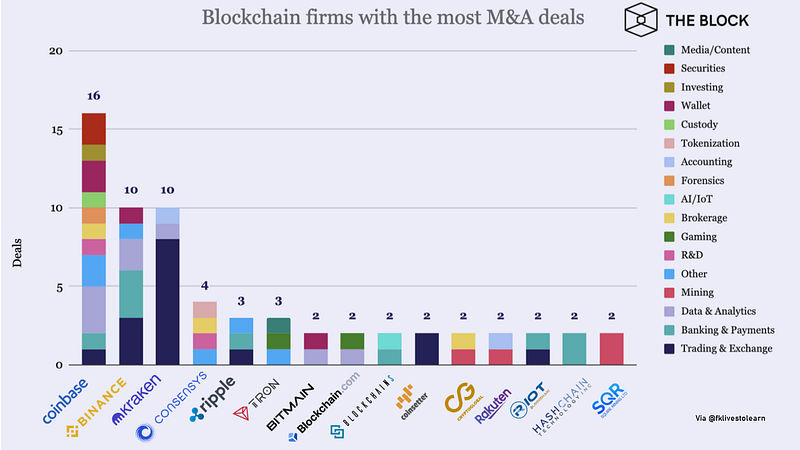
Blockchain Firms with the Most M&A
According to data from The Block, Cryptocurrency exchanges led the way for the most number of M&A deals. Coinbase has been the most active exchange with a total of 16 M&A deals, followed by Binance and Kraken with ten deals apiece. Excluding the three exchanges above, nine out of the 12 remaining blockchain firms participated in two transactions each (Figure 8). Analyzing the data by segment, the most frequent categories in which deals were done include Trading & Exchange, Banking Payments, and Data & Analytics, respectively.
Global VC Fudning Overtakes 2020
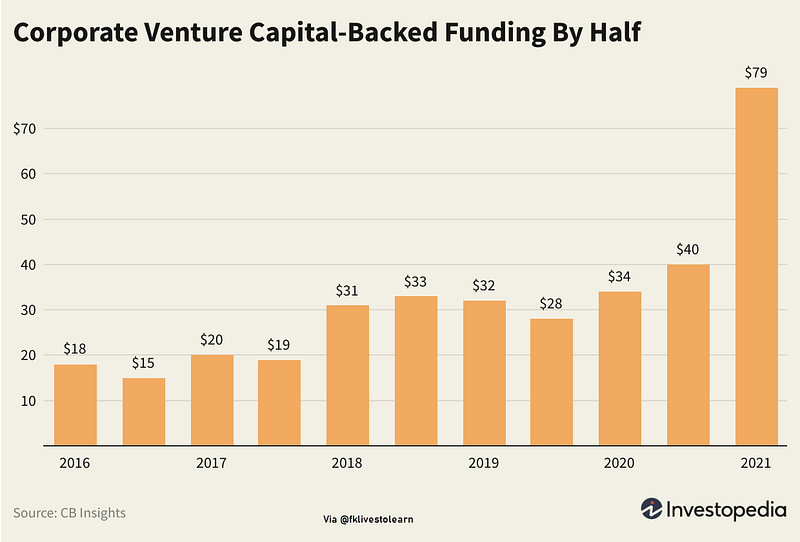
Global funding backed by corporate venture capital (CVC) hit $79 billion across 2,099 deals in the first half of 2021, according to newly-released data from CB Insights. That’s more than the $74 billion invested in all of 2020 (Figure 9). CVCs are also deploying more money per deal than their individual counterparts, the average CVC-backed deal size rose 75% year-over-year to an all-time high of $46.9 million in the half, while the average individual VC-backed deal grew only 68% to $30.1 million.
Alphabet VC arm Google Ventures was the most active corporate venture capital fund of the half with 64 deals, followed by Salesforce Ventures with 59 deals. The third-most-active corporate venture capital fund was a relative newcomer to CB Insights’ list: Coinbase Ventures made 37 deals, nearly doubling its 2020 activity with a series of investments in blockchain-related startups including Vega Protocol and Casa.
Market Humor: ETH keeps the Cryptos Alive
Previous Edition of GBW
