
WEEKLY BUSINESS ROUNDUP
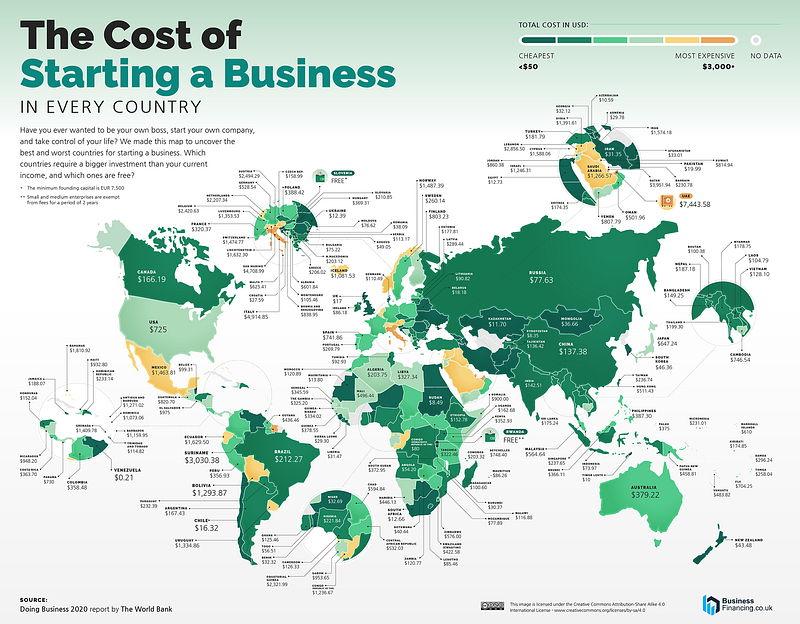
Global Business Week: Comparing the costs of starting a business in every country
The state of Financial markets & Economies, Weekly Charts, Business Trends & Statistics
As it has become too familiar a story in recent times, the DJIA and the S&P 500 closed the week at record highs following a bumper NFP report which showed the U.S economy adding 943k jobs — better than expected, with the unemployment rate falling to 5.4% from 5.9%. Financial stocks led the gains for the Dow Industrials on renewed hopes for the U.S. economy, despite a continued rise in COVID-19 cases. However, the Nasdaq lost ground for the second day in a row as investors have been shunning stay-at-home stocks from 2020 like Peloton and Zoom in favor of large-cap tech, utilities & health care. Having said that, consumers are starting to pull back on risk, but investors have yet to make that switch.
According to the most recent Morgan Stanley and AlphaWise consumer survey, only 41% of respondents believe the U.S. economy will get better over the next six months, compared to 48% a month ago. 38% say it will get worse, compared to 33% last month. Most survey respondents identified the resurgence of COVID-19 as the reason for their caution, and while they intend to keep spending at current levels, they also intend to spend less on riskier activities. The payrolls gain also put pressure on metals, with gold futures settling with their worst daily drop since mid-June. For the week, the Nasdaq rose 1.1% to lead the major averages, despite a Friday decline. The S&P rose 0.9% and the Dow gained 0.8%.
The US Dollar (via DXY Index) has rallied after the July US nonfarm payrolls report on the back of elevated US Treasury yields and a jump in Fed rate hike odds. Another hot inflation report is expected, and rates markets are starting to move in a manner suggesting that a more hawkish Fed could be on the horizon — however, any upcoming change in policy will be limited to tapering asset purchases. While the short-term sentiment in the benchmark index has taken a constructive tone, the medium-term bias remains sideways. After making a higher low (around 91.80) in the daily chart, DXY has reversed course to close the week @ 92.78.
It was an eventful week for the digital assets with both Bitcoin & Ethereum propelling higher, taking the broader crypto market with them. Both the top coins of the crypto market have made a sharp reversal from earlier lows on July 20 — taking out the declining trend line and turning the medium-term bias from bearish to neutral. In the short term, there is a strong bullish momentum building, provided in part by ETH’s London hard fork, which upgraded the network towards a more scalable, low fee & less-energy intensive future. At the time of writing, BTC was trading just above $43.5k & ETH was trading around $3,070.
Today’s featured infographic (above) from BusinessFinancing.co.uk uses data from the World Bank’s Doing Business 2020 report to examine the startup cost for a small-to-medium-size LLC in the largest business cities across 190 countries. A new business usually requires paying different fees for licensing, permits, and approvals, and many governments also have minimum on-hand capital requirements. And costs are relative. Though it might be more costly to start a business in some countries on paper, affordability also takes into account relative income.
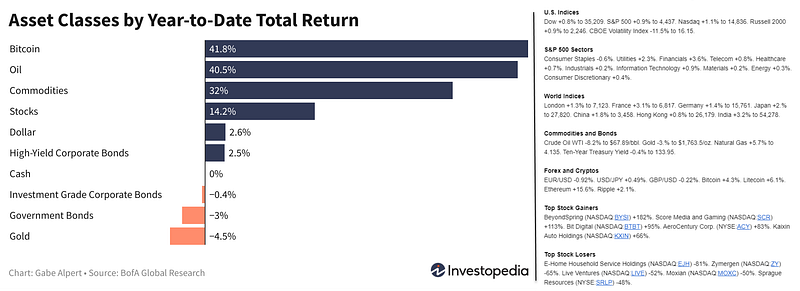
And finally, before moving on to some other statistics, here are the weekly & YTD numbers from various markets and different assets (Figure 1).
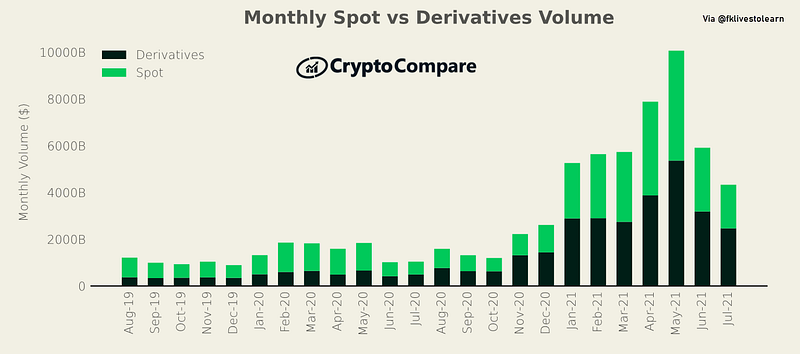
Crypto Volumes Declined in July
There are a few trends to watch for here. In the bigger picture. crypto volumes have soared in the last nine months or so (Figure 2). Having said that, Derivatives volumes decreased by 22.6% in July to $2.5 trillion. Meanwhile, total spot volumes decreased by 31.5% to $1.9 trillion. This might change with the reversal of fortunes in the market recently. Despite the fall in overall volume, Derivatives have gained Market share over the spot. The derivatives market now represents 56.9% of the total crypto market (vs 52.9% in June).
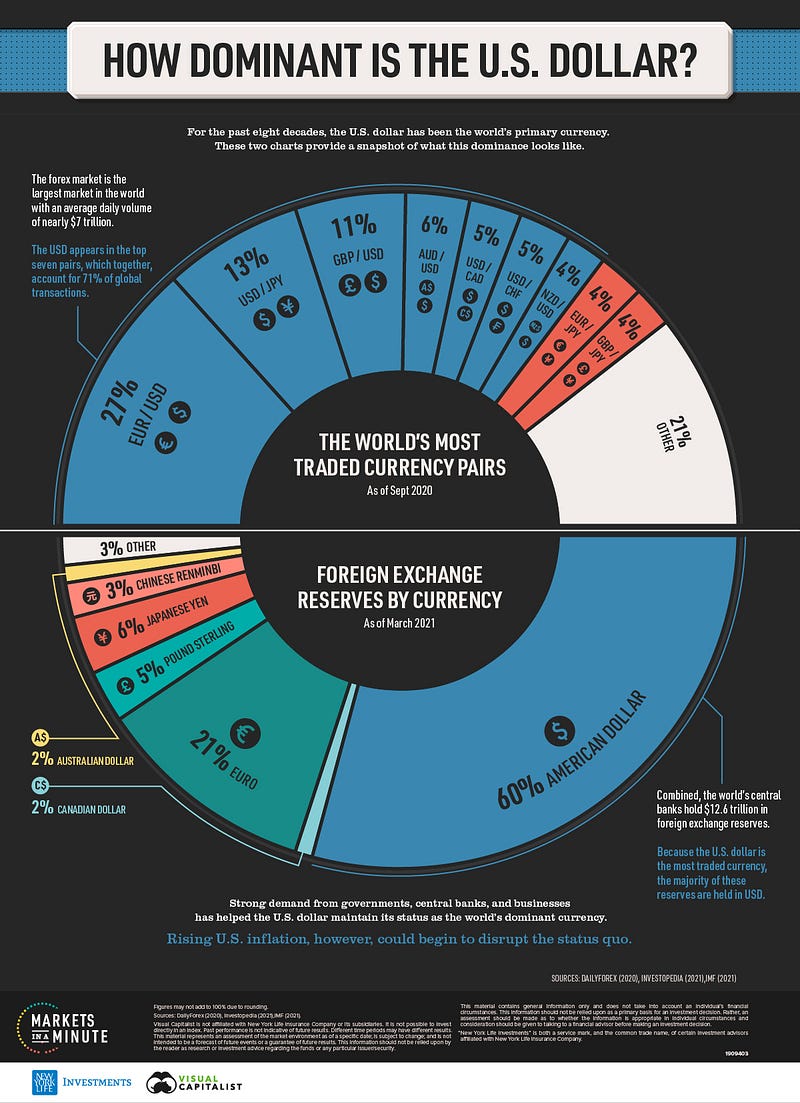
The dominance of the U.S Dollar
The U.S. dollar has been the world’s dominant currency since the end of World War II. According to the Congressional Research Service, roughly half of international trade, international loans, and global debt securities are denominated in USD. The same goes for many of the world’s most important commodities including gold, silver, and crude oil. In this Markets in a Minute chart (Figure 3) from New York Life Investments, they provide a snapshot of the U.S. dollar’s global standing.
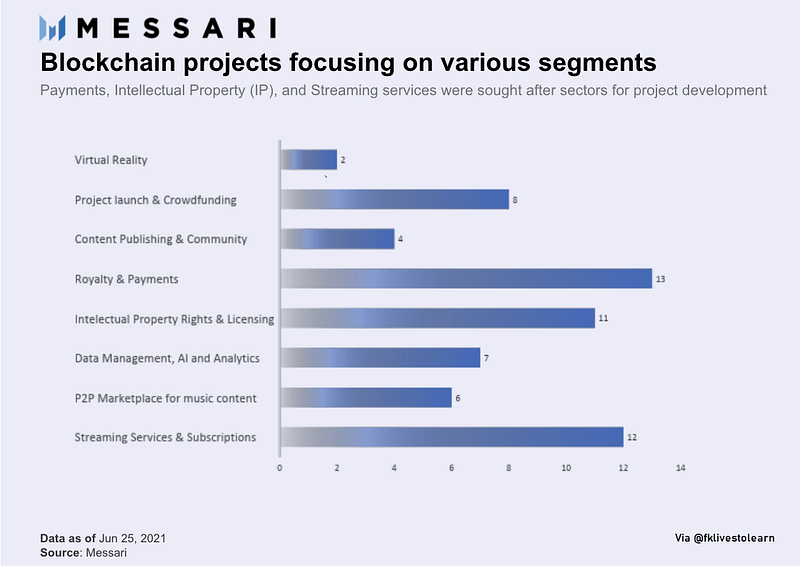
Popular Blockchain Projects
According to the latest Messari Research, Payments, Intellectual Property & Streaming services were the most sought-after blockchain projects (Figure 4). Most initial blockchain-based music projects have targeted licensing owners and the payment part to make the ecosystem lucrative for the artists.
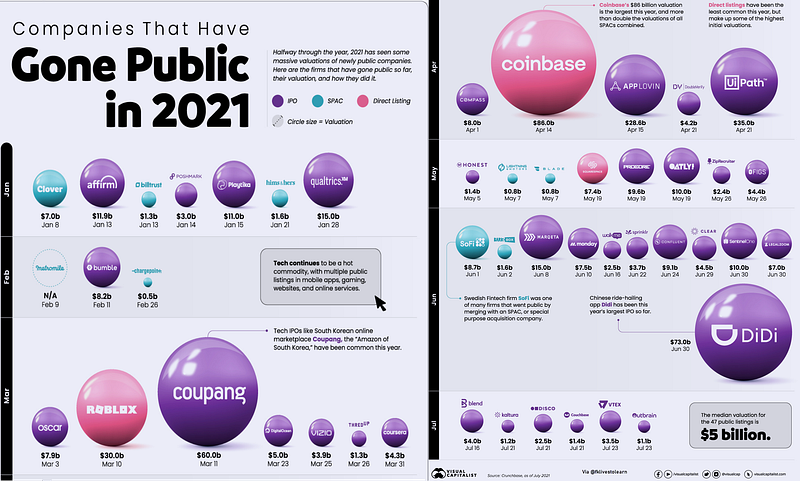
IPO’s in 2021 So Far
The beginning of the year has been a productive one for global markets, and companies going public in 2021 have benefited. The following infographic (Figure 5) measures 47 companies that have gone public just past the first half of 2021 (from January to July) — including IPOs, SPACs, and Direct Listings, as well as their subsequent valuations after listing. From much-hyped tech initial public offerings (IPOs) to food and healthcare services, many companies with already large followings have gone public this year. Some were supposed to go public in 2020 but got delayed due to the pandemic, and others saw the opportunity to take advantage of a strong current market.
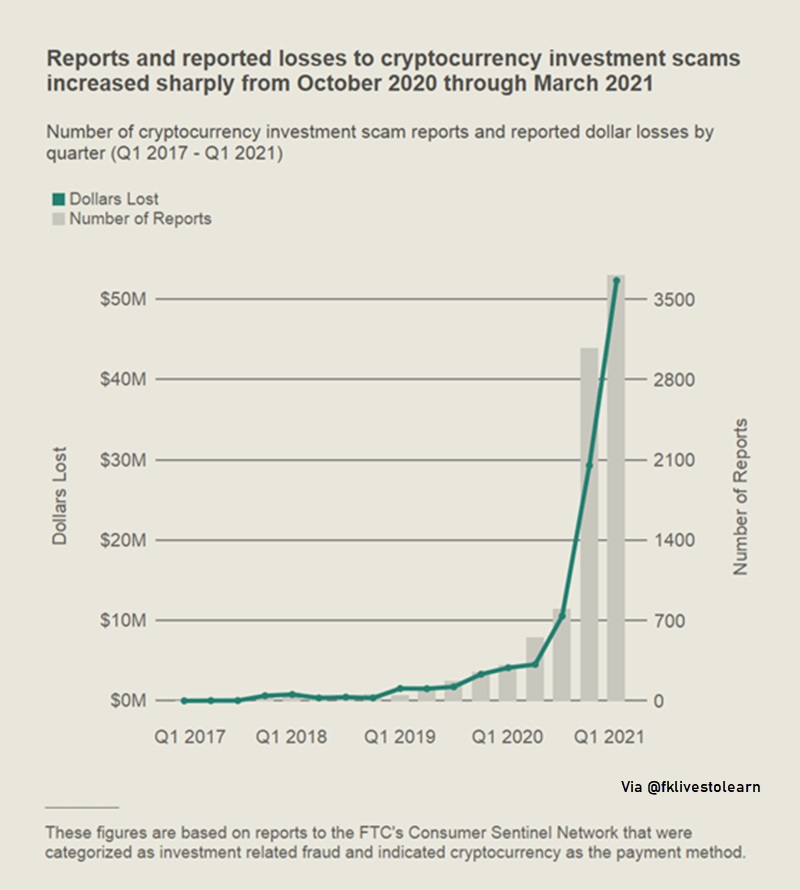
Crypto Investment Scams
Figures provided by U.S Federal Trade Commission (FTC) highlights an alarming trend in the rising cryptocurrency scams. Going back all the way back to Q1 2017, dollar losses in this market segment have been on the rise, but since Oct. 2020, they have seen an alarming increase (Figure 6) — from less than $10M to over $50M.
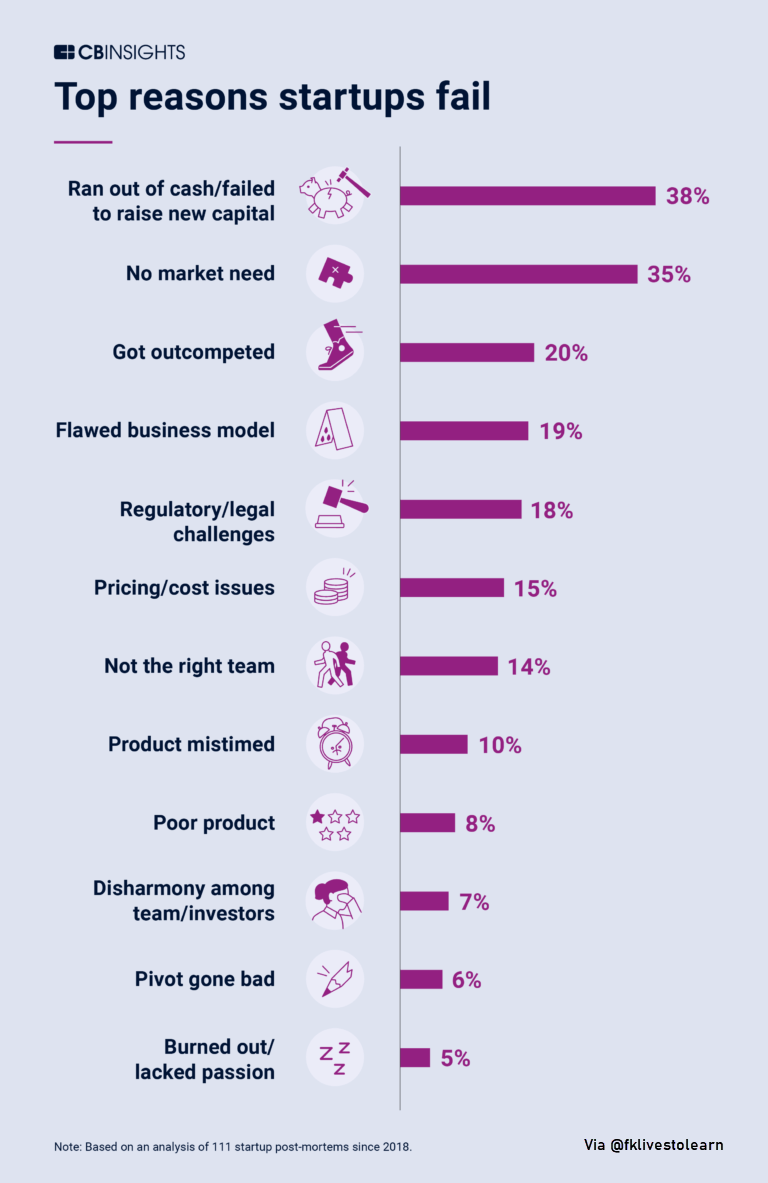
Top Reasons for a Startup Failure
After reading through 111 post-mortems since 2018, CB Insights has learned there is rarely one reason for a single startup’s failure. However, they did begin to see a pattern in these stories. And so after sifting through the post-mortems, they identified the top 12 reasons startups fail. Since many startups offered multiple reasons for their failure, you will see that the chart (Figure 7) highlighting the top reasons doesn’t add up to 100%.
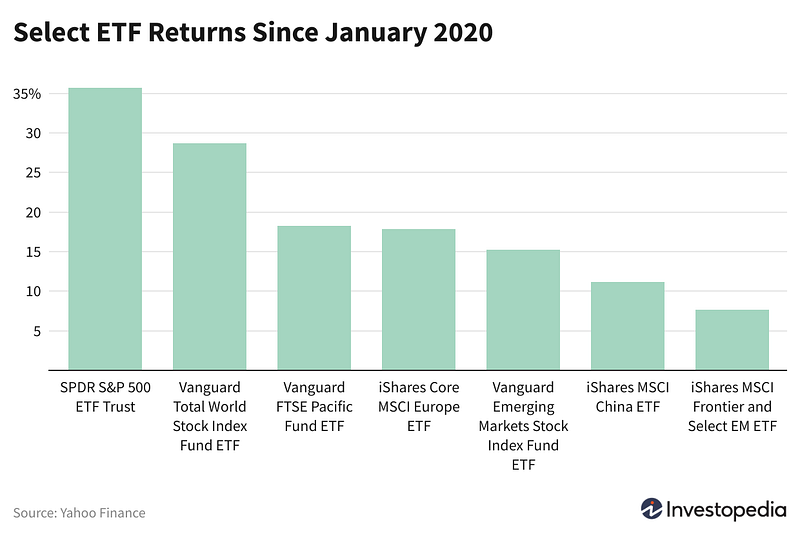
Inequality in Global ETF Returns
Stock market returns in lower-income countries have lagged those in higher-income countries since the beginning of the COVID-19 pandemic, as demonstrated by the performance of exchange-traded funds (ETFs) since January 2020 (Figure 8). The S&P 500’s return has been more than twice as high as the Vanguard Emerging Markets Stock Index Fund ETF’s (VWO) return over that time period, and more than four times higher than the iShares MSCI Frontier and Select EM ETF’s (FM) return. Emerging market ETFs have posted relatively high returns after previous increases in IMF lending capacity. In April 2009, the IMF increased its lending capacity by $500 billion to help lower-income countries through the aftermath of the 2007–2008 financial crisis.
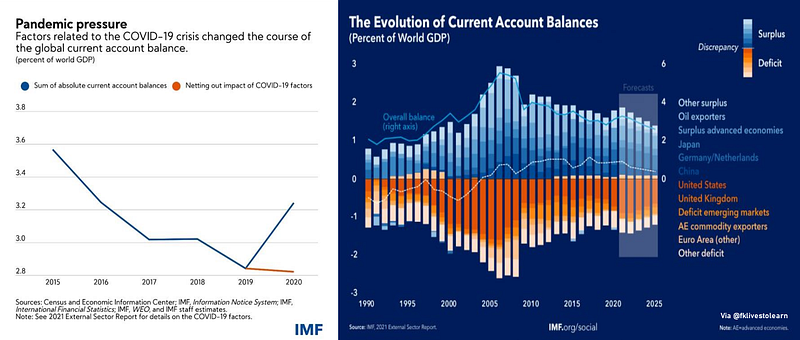
In our latest External Sector Report, IMF found that the global reaction to the pandemic further widened global current account balances — the sum of absolute deficits and surpluses among all countries — from 2.8% of world GDP in 2019 to 3.2% of GDP in 2020 (Figure 9). Those balances are set to widen further as the pandemic continues to rage in much of the world. If not for the crisis, global current account balances would have continued to decline. While external deficits and surpluses are not necessarily a cause for concern, excessive imbalances — larger than warranted by the economy’s fundamentals and appropriate economic policies, can have destabilizing effects on economies by fueling trade tensions and increasing the likelihood of disruptive asset price adjustments.
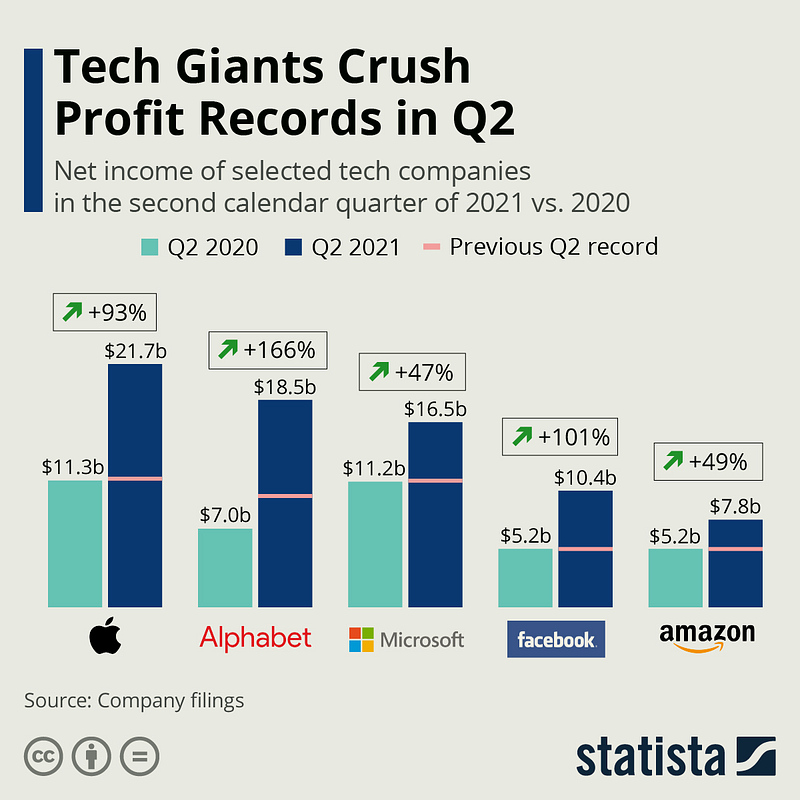
Tech Giants Crush Profit Records in Q2
Amazon was the last of the big five U.S. tech companies to report its earnings for the three months ending June 2021. And like the other four GAFAM companies before it, Amazon reported another record-breaking quarter, despite falling just short of Wall Street expectation in terms of sales and Q3 guidance. The e-commerce giant saw net sales grow 27% to $113 billion in the past three months, partly offsetting a slowdown in its core e-commerce business with strong growth in its cloud and advertising segments. While Facebook and Apple also offered modest guidance this week, warning investors that the blockbuster growth rates achieved over the past 15 months couldn’t be sustained forever, there were little signs of weakness in big tech’s Q2 results (Figure 10).
Market Humor: Coinbase & Robinhood IPOs take the market by storm

Previous Edition of GBW
