
WEEKLY BUSINESS ROUNDUP
Global Business Week: Visualizing Asset Class Correlation over 25 Years
The state of Financial markets & Economies, Weekly Charts, Business Trends & Statistics
Investors were giving a positive spin to even bad news last week, like the tepid 49k U.S Job additions in January — considering steep losses in December. On top of that encouraging vaccine news and the passing of a new stimulus bill pushed the U.S. equity markets to post their best week since election week in November, as the S&P 500 and the Nasdaq went out on record highs between the resurgence of the biggest stocks in those indexes.
Even the bonds saw an inflow of $21.1 billion — the biggest in 4 months as bond yields kept on creeping higher. For the week, Dow gained 3.9%, the S&P rose 4.7%, the Nasdaq jumped 6%, and the small-cap Russell 2000 index rallied 7.7% for its best week since June. The benchmark 10-year Treasury yield finished at a year-to-date high of 1.17%, gaining 8 basis points on the week.
This was one of those weird weeks when the Greenback and the associated Dollar Index managed to hold onto gains even with the risk-on behavior in Equities — both these things are usually inversely related. U.S dollar gained against the Swiss Franc, Euro & Japanese Yen, while losing to the Australian Dollar, New Zealand Dollar & British Pound. A softer NFP data caused the dollar index to decline sharply on Friday, giving up most of the gains from the previous but ended the week in gains.
And finally, Cryptoverse kept up its reputation of being the most happening of all the financial markets. Bitcoin again pierced the $40k barrier after three weeks, but it was the second-largest crypto Ethereum which stole the show — posting yet another all-time high close to $1760. Both have seen a correction ever since then will BTC trading around $38,750 while ETH was trading in the neighborhood of $1604. Overall, the crypto market remains healthy trading well above the recent support levels.
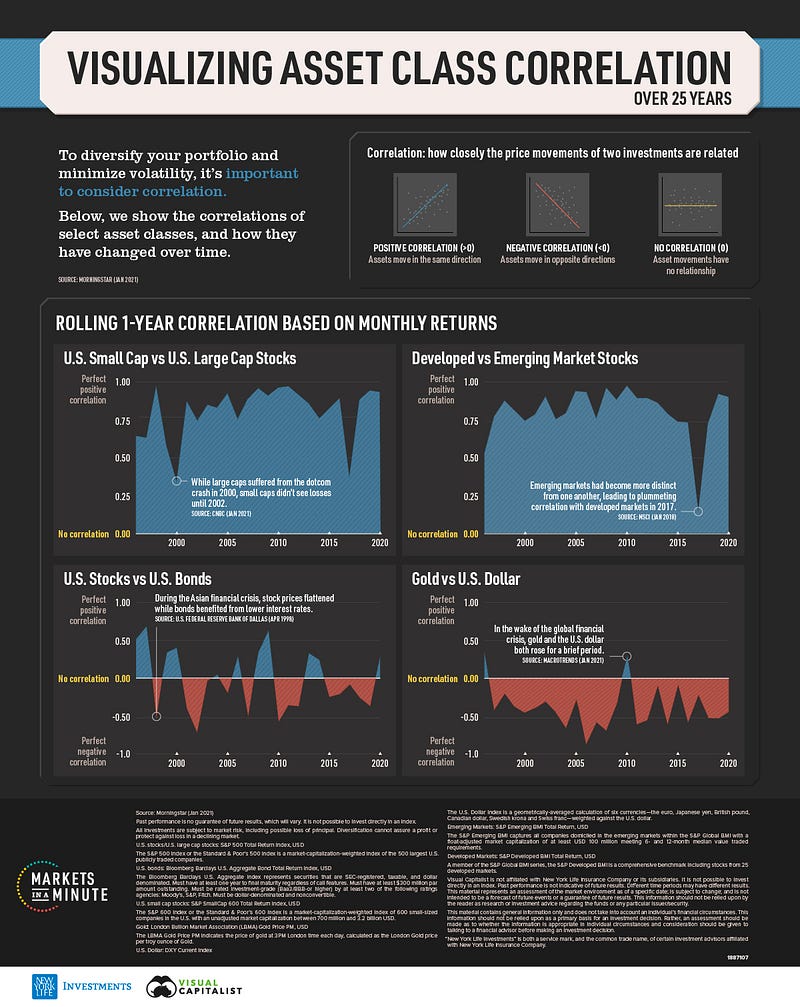
Today’s featured infographic (above) highlights how investors can minimize the impact of risk or even a market crash on their portfolio. The key is to a portfolio with asset classes that have a low or negative correlation. However, the correlation between asset classes can change depending on macroeconomic factors. The data from New York Life Investments shows the correlation of select asset classes and how they have shifted over time.
Before we move on to some of the other interesting statistics from the financial world, here are the weekly numbers of various markets (Figure 1).
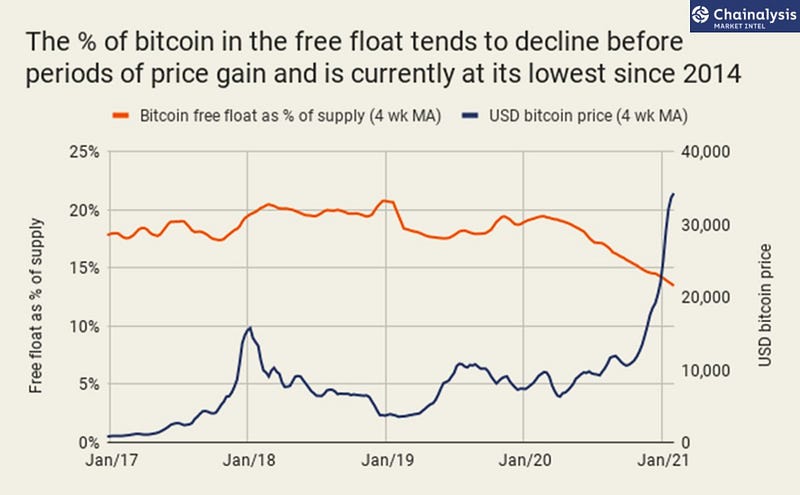
Bitcoin free float declines to 6-year lows
According to Chainalysis Market Intel, the free float of bitcoin is currently 2.4 million bitcoin, just 13% of the 18.6 million bitcoins mined to date — the lowest share of supply in bitcoin’s free float since 2014 (Figure 2). As evident from the chart above, periods of price gains are usually preceded by a decline in BTC free-float. This basically suggests that BTC available to buy remains scarce despite record prices.
Where Women are most likely to be your Boss
According to the International Labor Organization, you are most likely to encounter a woman boss if you are working in Jordan, Saint Lucia, Botswana, Honduras, or the Philippines. Jordan led the pack with 62% of all managerial positions filled by women (Figure 3). The data also revealed that only five out of 83 countries reporting these figures to the ILO have achieved gender parity in leadership positions.
Asian and African countries rank lower with the exception of the Philippines being an obvious outlier. The United States ranks 21st with a 40.7% share of managerial positions being filled by women. Also, ILO suggests that women are most likely to hold managerial positions in human resources, administration, finance, marketing, or public relations.

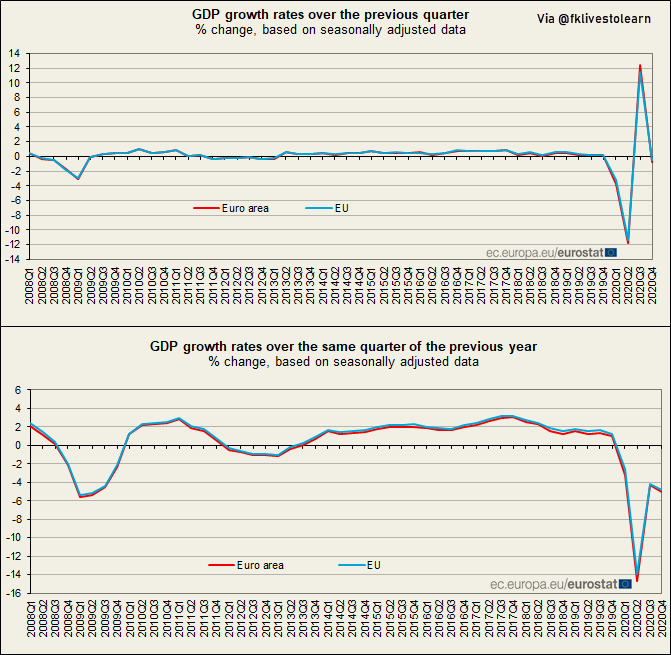
Eurozone Economy contracted by 6.8% in 2020
According to the preliminary estimates from Eurostat, GDP for the entire 27-country bloc fell 6.4% last year. In the fourth quarter last year, seasonally adjusted GDP decreased by 0.7% in the euro area compared with the previous quarter, which was better than analysts expected. The decline was 0.5% in the EU. Obviously, the blame fell on the COVID-19 pandemic and ensuing lockdowns. A strong rebound in Q3 was followed by another fall in Q4 as the virus resurfaced.
The rebound in Q3 2020 was as following: (+12.4% in the euro area and +11.5% in the EU) — Austria (-4.3%) recorded the highest decrease compared to the previous quarter, followed by Italy (-2.0%) and France (-1.3%). Lithuania (+1.2%) and Latvia (+1.1%) recorded the highest increases, while Germany recorded a 0.1% increase (Figure 4).
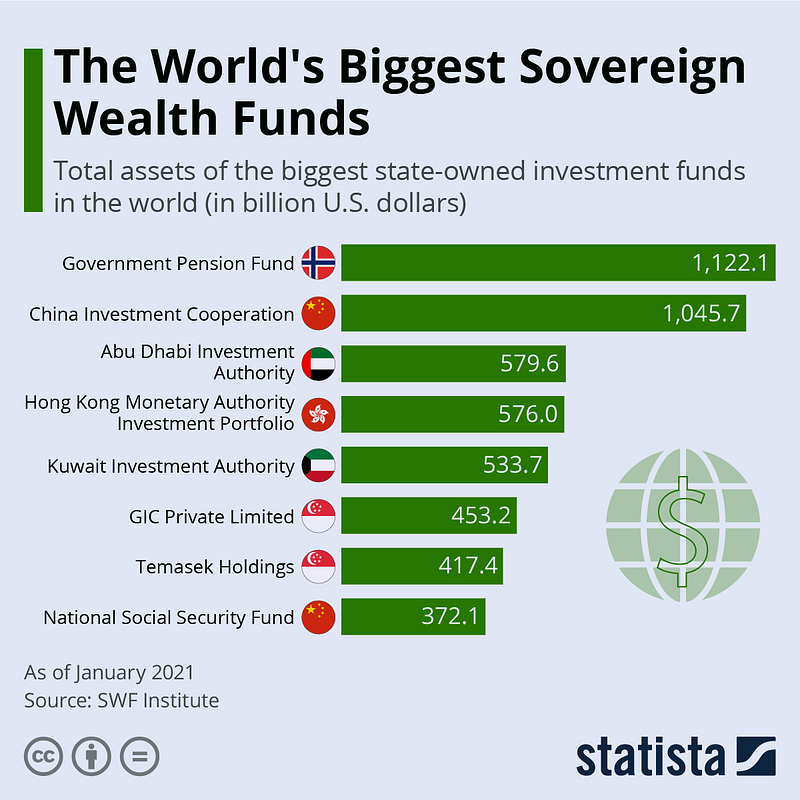
World’s Biggest Sovereign Wealth Funds
According to data from the SWF Institute, The Norwegian Government Pension Fund is the largest of any sovereign wealth fund in the world — contained more than $1.1 trillion as of January 2021. Most of the assets are tied up in stocks, bonds & real estate. Not far from the proportions of the Government Pension Fund is the China Investment Cooperation fund. It manages a similarly large amount of assets of just above $1 trillion. The other sovereign wealth funds in the top eight are not nearly as big. Assets range between $370 and $580 billion (Figure 5). Most of the funds are located in Asia and the Arab world — in Hong Kong, China, Singapore as well as Kuwait, and the United Arab Emirates.
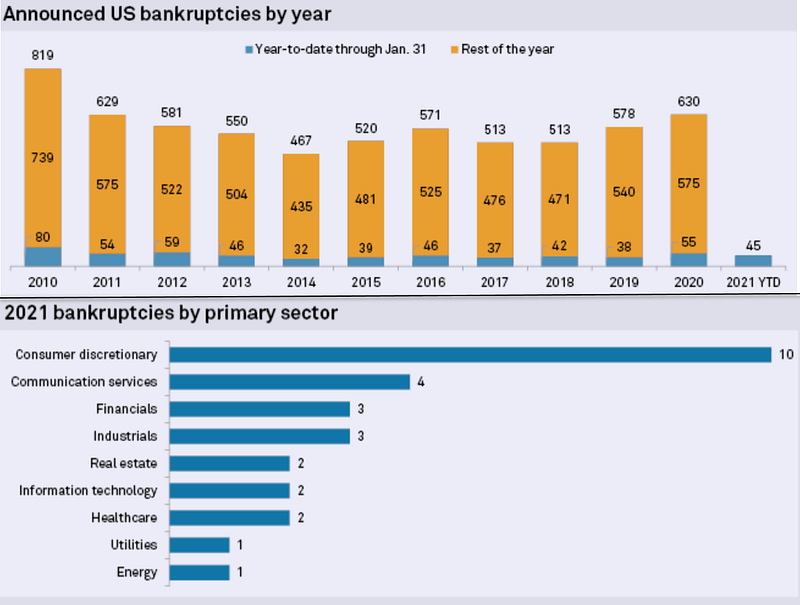
U.S Corporate Bankruptcies rise in January
According to S&P Global Market Intelligence data, U.S. corporate bankruptcy filings rose to 45 in January from 39 in December 2020. The consumer discretionary category accounted for the largest share of bankruptcies with 10 for the month. Last year saw 630 filings, the most in a decade (Figure 6).
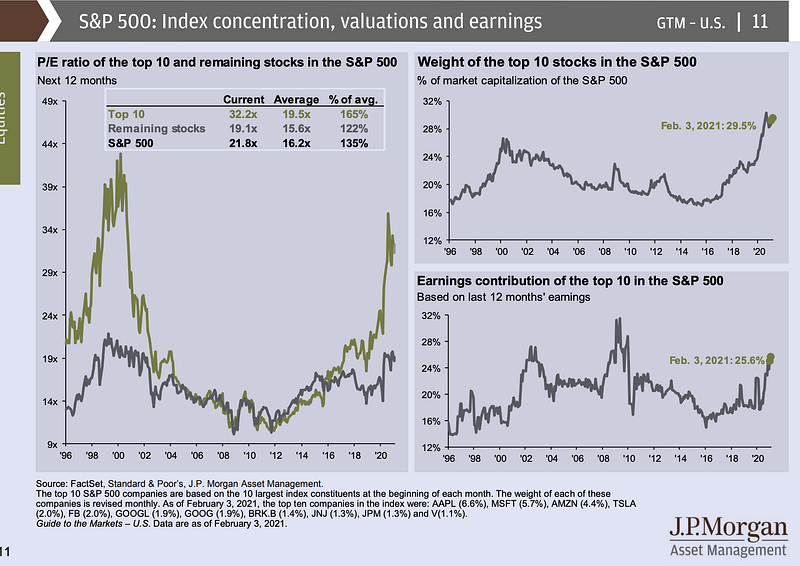
Impact of Top 10 Stocks in the S&P 500
As the market marches on to new record highs, so has the concentration of the market caps of the companies leading the indexes. While it’s true that more stocks are in uptrends, the big ones keep getting bigger and their P/E ratios are getting swollen again. According to JPMorgan Asset Management, the weight of the top 10 stocks in the S&P 500 is just under 30% — near record highs. The top 10 have an average P/E ratio of 32.2 versus 19.1 for the remaining stocks in the index, and they contributed 25.6% of the S&P 500’s overall earnings over the last 12 months (Figure 7).
Previous Edition of GBW
