WEEKLY BUSINESS ROUNDUP
Global Business Week: U.S annual GDP sees the biggest drop since 1946
The state of Financial markets & Economies, Weekly Charts, Business Trends & Statistics
Strong results and positive outlooks have been met with selling. It was the first monthly loss for the U.S indices since October as stock averages all fell about 2% in Friday trading, wrapping up a week dominated by a feeding frenzy on highly shorted stocks touted on Reddit. Feds continued its ultra-dovish tone, with Fed Chair Jerome Powell promising he would give markets plenty of notice before considering any tapering of bond purchases.
This past week we saw stock markets fixated by an astronomical run-up in shares of GameStop Corp. (GME), which at one point were up 2,000% in less than a month. The war against ‘Shorts’ quickly spread to other stocks like AMC Entertainment (AMC), Express (EXPR), Bed Bath & Beyond (BBBY), Nokia (NOK) & Koss (KOSS). The push higher was so extreme that About 44 circuit breaker halts were triggered in the first two hours of trading on Wednesday alone.
All this heightened activity led to a spike in volatility, with the VIX ‘fear gauge’ temporarily spiking by the most in almost 3 years over the course of 24 hours. Although this dynamic along with the general risk-off sentiment offered a boost for the Greenback and the benchmark Dollar Index. A follow-through in this sentiment, which right now seems lacking, is needed for a solid streak of gains for DXY. For now, 91.00 level is capping any gains.
And talking about volatility, it is a much more common theme in cryptos. The ‘meme stock’ action quickly spread to Cryptocurrencies, where Elon Musk’s addition of #Bitcoin to his Twitter bio set up the stage for a $6K rally in the premier digital, in a matter of hours. And while Bitcoin has given up most of these gains at the time of writing (hovering around $34k), Ethereum has held up well with higher lows — trading around $1375 currently. Seems like Alt. coins still have a bit of sizzle left.
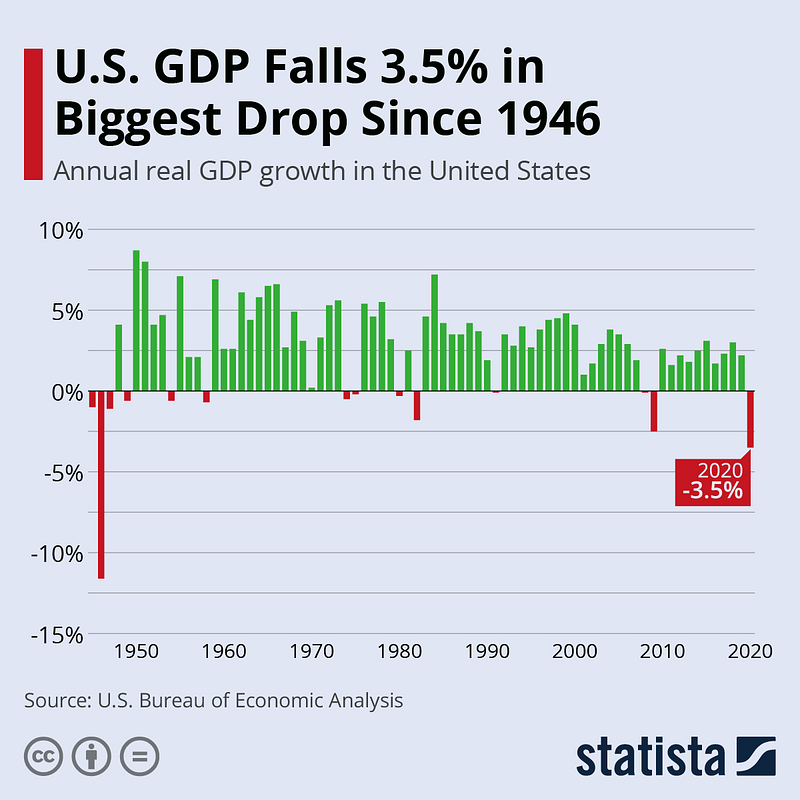
Today’s featured chart comes from Statista, which highlights the biggest annual drop in the U.S GDP since 1946. According to BEA’s latest GDP reading, supports the assessment that the economic output remained far below pre-pandemic levels in Q4 2020. Real GDP increased at an annual rate of 4% in the fourth quarter, down from 33.4% in the third quarter. For the full year, real gross domestic product decreased by 3.5% compared to 2019.
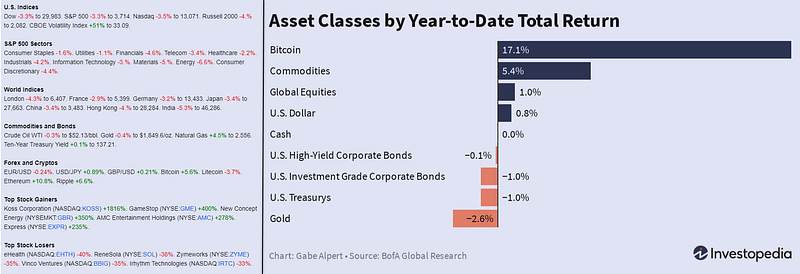
Here are some weekly & YTD numbers for the financial markets (Figure 1) before we move on to some of the other interesting statistics from the financial world.
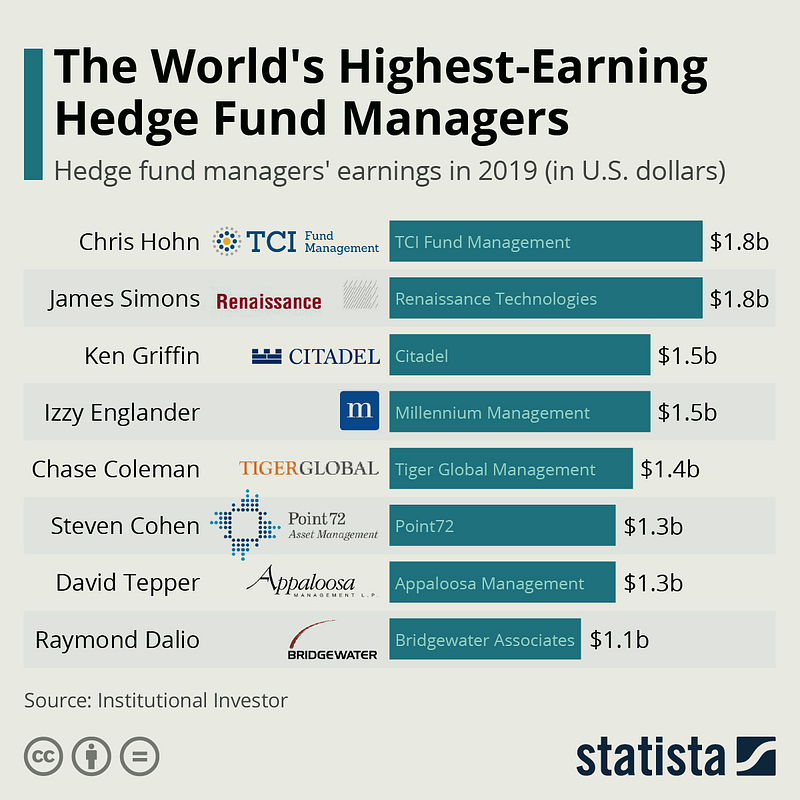
World’s Highest-Earning Hedge Fund Managers
Wall Street was abuzz with the talk of the army of retail traders from WSB Reddit causing the ‘invincible’ hedge funds to take huge losses. Hedge funds have had to cut their losses after a group of amateur traders came together to push up shares in GameStop & some other companies. Well known managers Steve Cohen and Dan Sundheim were among those impacted. Hedge fund managers tend to earn whopping sums of money and in 2019 — according to a ranking released last March by Institutional Investor the 25 highest earners pocketed a collective $20.2 billion (Figure 2).
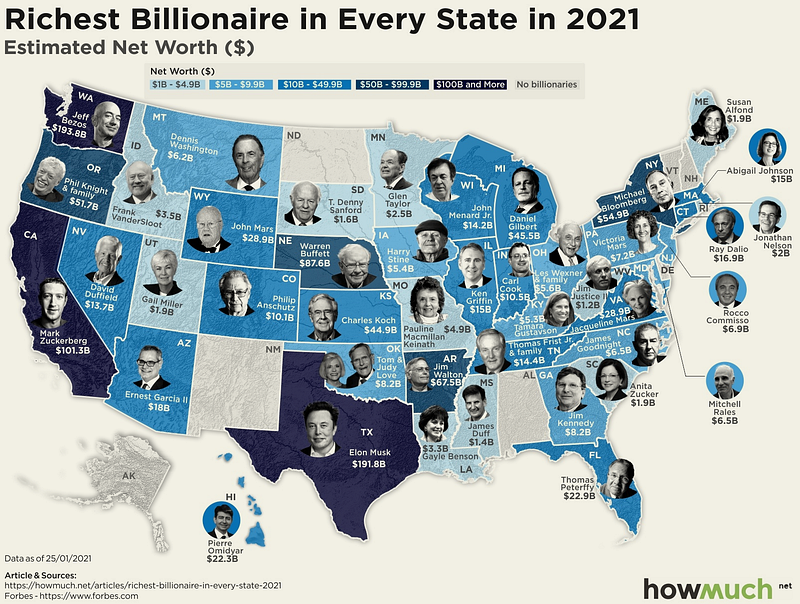
The Wealthiest Billionaires Around the U.S.
COVID-19 had a strange impact on the global economy. On one hand, it created high levels of unemployment, record business closures and evidence of financial decline. But on the other, the stock market is setting record highs, tech companies are thriving, and wealth inequality is accelerating. The map of the richest billionaire in every state for 2021 (Figure 3) provides a snapshot of this second economy. Howmuch.net found the data for our visualization thanks to the Real Time Billionaire tracker at Forbes.
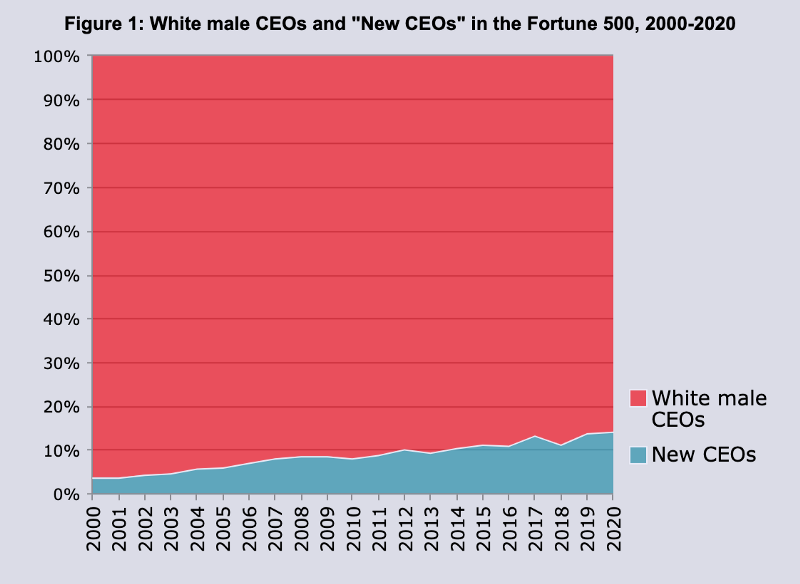
“New CEOs” in Fortune 500 since 2000
Walgreens Boots Alliance has tapped Starbucks COO Roz Brewer to be its next CEO starting March 15. Brewer will be the only Black woman at the helm of a Fortune 500 company. Since 2000, there have been 151 white women and people of color appointed CEOs at Fortune 500 companies. The chart below shows the slow increase in these “New CEOs” from a total of 19 in 2000 to 71 in 2020 (Figure 4).
COVID Crisis Results in Staggering Loss of Working Hours
With tens of millions of people losing their jobs or seeing their working hours reduced due to the COVID-19 pandemic, the ongoing crisis has disrupted labor markets around the world at an unprecedented scale.
According to the latest edition of the ILO Monitor, 114 million jobs were lost in 2020, which, in combination with working-hour reductions within employment, resulted in working-hour losses approximately four times as high as during the financial crisis in 2009. The International Labour Organization estimates that the working hours lost in 2020 (compared to pre-pandemic levels) were equivalent to 255 million full-time jobs, leading to $3.7 trillion in lost labor income. That’s even higher than the worst-case estimate made in spring 2020, when the ILO had predicted lost labor income between $860 billion and $3.44 trillion for the entire year.
As the following chart shows, the disruptions to the labor market were most pronounced in the second quarter of 2020, when widespread lockdowns led to working-hour losses equivalent to 525 million jobs. By the end of 2020, as millions had returned to work or switched to working from home, the situation had improved significantly. However, the ILO does not expect global working hours to return to pre-Covid levels in 2021.
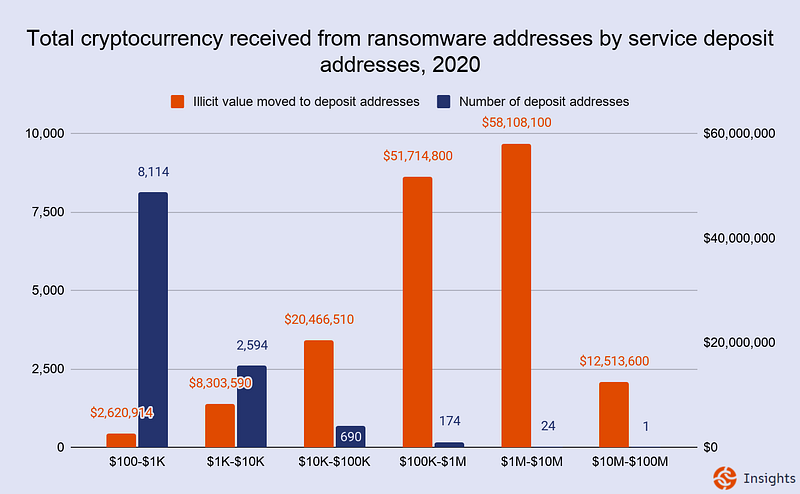
Accounts are bucketed by range of total value received from ransomware addresses. Each orange bar represents the total amount ransomware addresses sent to all addresses in the corresponding bucket, while each blue bar represents the number of individual deposit addresses in the bucket.
The data shows that ransomware money laundering is even more concentrated at the deposit address level. Just 199 deposit addresses receive 80% of all funds sent by ransomware addresses in 2020. An even smaller group of 25 addresses accounts for 46%.
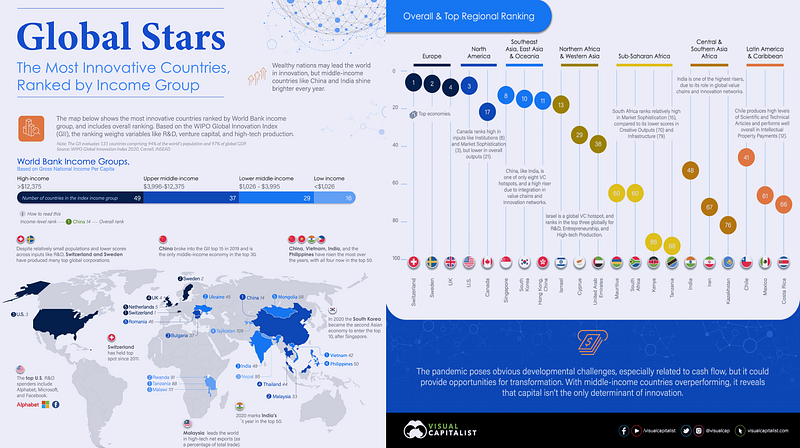
The Most Innovative Countries, Ranked by Income Group
Innovation can be instrumental to the success of economies, at macro and micro scales. While investment provides powerful fuel for innovation — the relationship isn’t always straightforward.
The 2020 ranking from the World Intellectual Property Organization (WIPO) reveals just that.
The above map breaks down the most innovative countries in each World Bank income group, based on data from WIPO’s Global Innovation Index (GII), which evaluates nations across 80 innovation indicators like research and development (R&D), venture capital, and high-tech production.
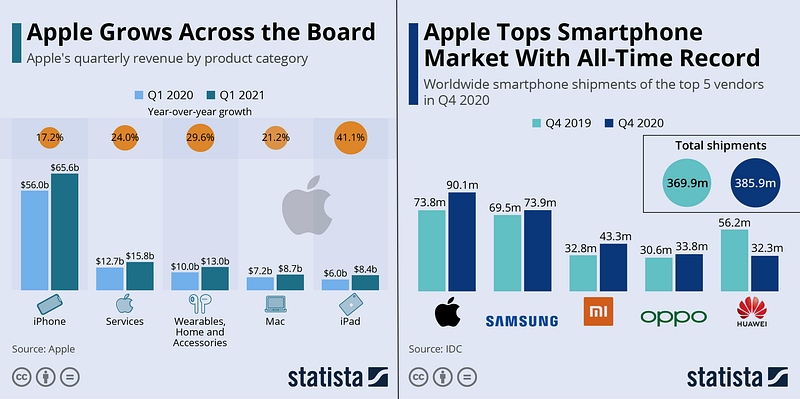
Thanks to record-breaking iPhone sales, Apple reported the best quarter in its history on Wednesday, topping $100 billion in revenue for the first time. After pushing the launch of the iPhone 12 back to October due to the COVID-19 pandemic, Apple shipped more iPhones during the holiday quarter than ever before, with market researcher IDC putting the total at 90 million units.
It wasn’t just the iPhone that helped Apple fly by the $100 billion milestone for the first time. The company posted strong results across the board, with the iPhone segment’s 17-percent growth actually the weakest of the pack. The long-forgotten iPad made a strong comeback, with revenue growing by more than 40 percent year-over-year thanks to the popularity of the latest iPad Air, which was also launched in October.
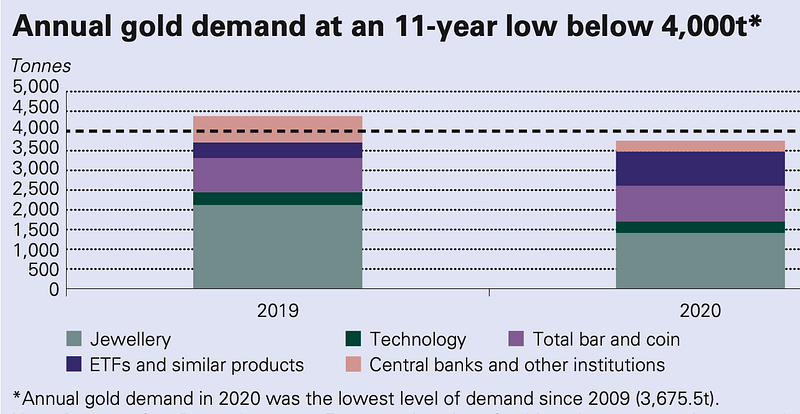
- Last year annual gold demand dropped 14% to 3760 tonnes, the lowest in 11 years, according to the World Gold Council. Jewelry demand fell 34% and hit a record low in 2020. Gold buying by central banks slowed almost 60%. However, inflows into global gold ETFs reached a record high of 877.1 tonnes ($47.9 billion), pushing AUM to $228 billion, and gold bar and coin demand grew 3%. For Q4, demand for the precious metal was 28% lower year over year, making it the weakest quarter since Q2 2008.