
WEEKLY BUSINESS ROUNDUP
Global Business Week: Interest rates fall decades after Pandemics
The state of Financial markets & Economies, Weekly Charts, Business Trends & Statistics
Investors continued to move out of stocks and into the relative safety of bonds as the U.S equities closed the week in losses ahead of the long Presidents Day weekend. Geopolitical tensions, expiration of options contracts, and narrow aversion of a U.S government shutdown all played out on the minds of investors. The three major U.S averages cut their earlier losses during the Friday afternoon, with the S&P 500 briefly turning positive, before all three declined again in the last hour of trading. The yield on the 10-year Treasury note fell to 1.92%. For the week, the S&P 500 fell 1.6%, the Nasdaq Composite closed down 1.8%, and the Dow Jones average slid 1.9%. The volatility that escalated this week is probably going to continue into next week with rising Russia-Ukraine tensions.
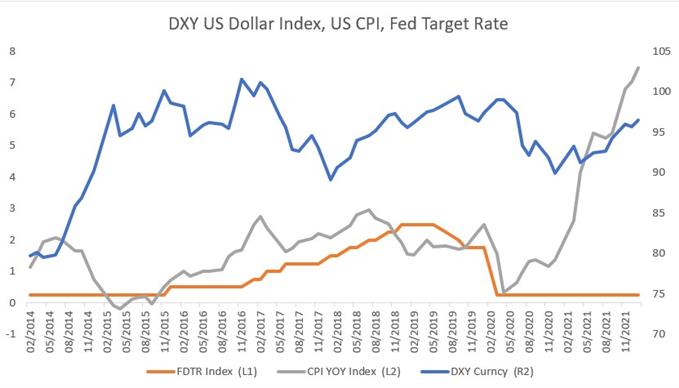
Higher-than-expected US CPI readings spurred fears that the Fed may tighten monetary policy more aggressively in the months to come, and this was reflected in the strength of the benchmark dollar index (DXY), as it climbed to a new weekly high — closing @ 96.11. The higher CPI reading points to price pressures that are probably more ‘entrenched’ than the Fed has anticipated — this might precipitate into faster rate hikes & end to asset purchasing programs.
So much so, that the implied probability of a 50bps rate hike at the March FOMC meeting has surged to 89% from 24% a day ago, according to the CME’s FedWatch tool. Hawkish-biased comments from Fed officials following the inflation data suggest that the Fed may become more aggressive in tightening, and market participants still have time to price in the expectations. As was the case in 2015 tightening, market participants may again buy on expectations and then “sell the facts”, rendering the Greenback susceptible to a pullback after the March policy meeting.
Risk aversion in equities led to a sell-off in the digital assets led by Bitcoin — as has been the case in so many recent sessions. After rebounding from January lows, both Bitcoin and Ethereum have again receded significantly from the recent highs. Both reached a peak of $45.8k and $3280 respectively on Feb. 10, before turning lower on risk aversion. Moving in lockstep with the legacy financial markets, cryptos are trending lower, and the move continues to do so until the geopolitical and macroeconomic issues head towards a resolution. For now, the larger bearish trend has again reinforced itself.
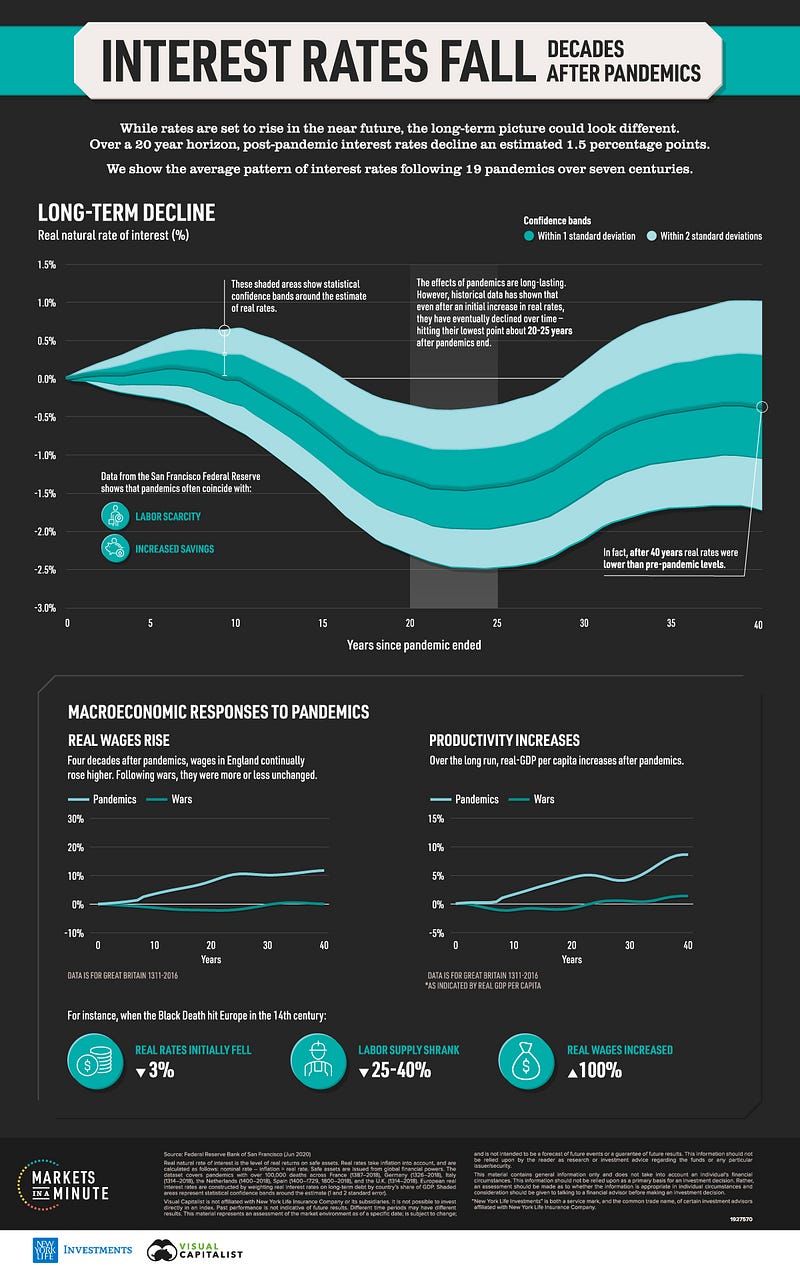
Despite higher interest rates on the horizon, historical data shows that real interest rates fall decades after pandemics end. Real interest rates were shown to decline as much as 1.5% lower, even after an initial rise. The Markets in a Minute chart (infographic above) from New York Life Investments, shows how pandemics have impacted real interest rates across 19 pandemics since the 14th century.
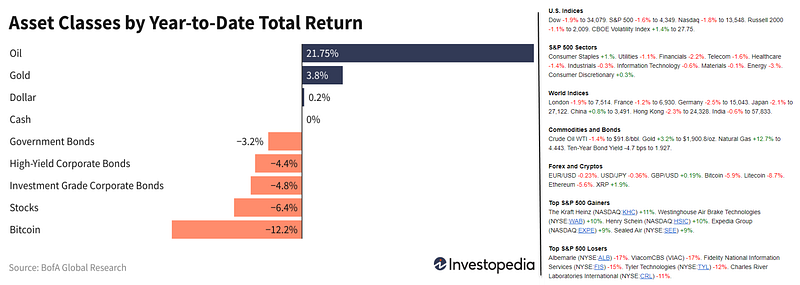
And finally, before moving on to some other statistics, here are the weekly & YTD numbers from various markets and different assets (Figure 1).
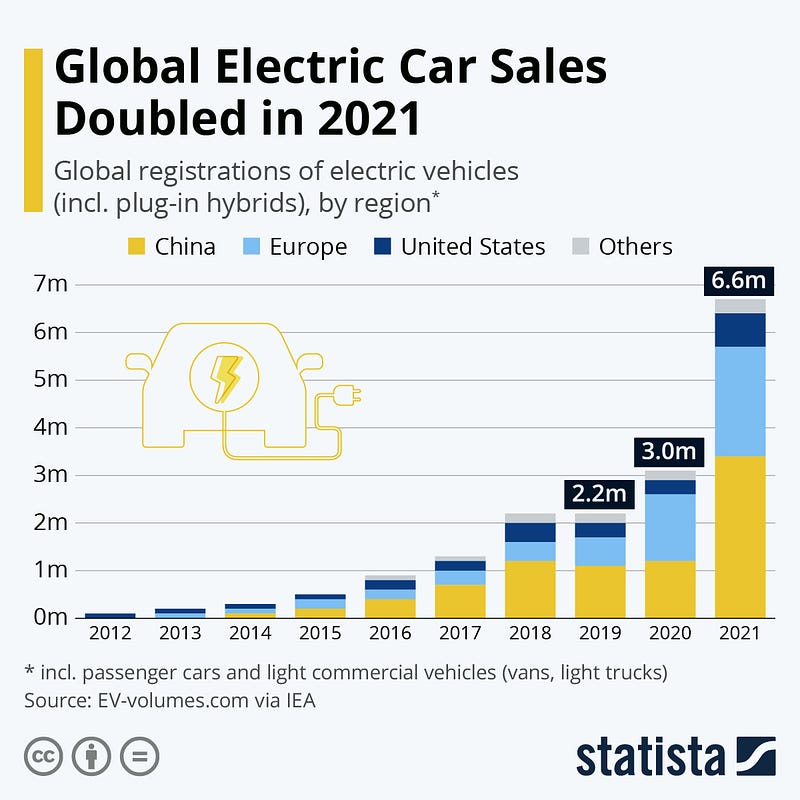
Global Electric Car Sales Doubled in 2021
While 2021 was another difficult year for the car industry, heavily affected by the global chip shortage, global electric car sales more than doubled over the past twelve months, reaching 6.6 million, compared to just 3 million in 2020 (Figure 2). That’s according to preliminary EV-volumes data cited by the International Energy Agency (IEA), which reports that all net growth in global car sales in 2021 can be attributed to electric vehicles. China in particular had a breakout year in 2021, almost tripling electric car sales from 1.2 to 3.4 million. Europe remains the second-largest market for electric cars, with new registrations increasing by almost 70% to 2.3 million, roughly half of which were plug-in hybrids. In the United States, sales surpassed half a million for the first time, but the overall market share of electric vehicles remains far below that of China and many European markets.
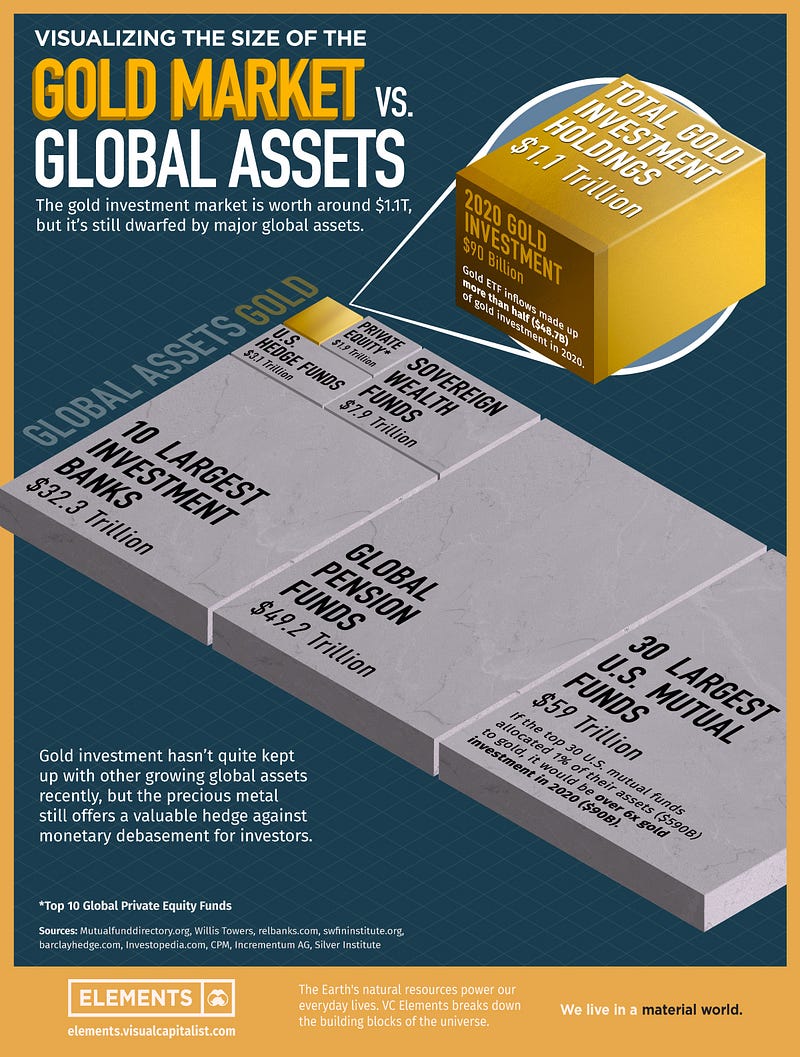
Gold Market as a Share of Global Assets
Gold has been a vital asset for investors and speculators to hedge against uncertainty and currency devaluation, but today it is just a small part of the investment landscape. While gold investment holdings stand at $1.1 trillion, this figure is dwarfed by various other global assets and funds. This infographic (Figure 3) compares the size of gold investment holdings to global assets, highlighting the difference in dollars invested, and where modern-day investors have (or haven’t) been allocating their money.
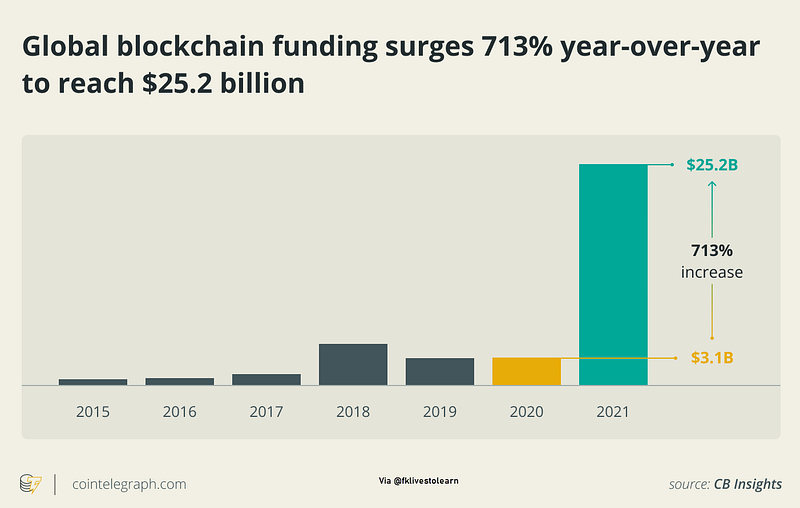
Blockchain Funding hit a Record in 2021
Alchemy, a Silicon Valley-founded blockchain developer platform, added $200 million in funding to bring its valuation to $10 billion. In October, Alchemy raised $250 million in Series C funding at a $3.5 billion valuation. A reminder that blockchain funding is at an all-time high with 713% year-over-year growth (Figure 4), because numbers go up.
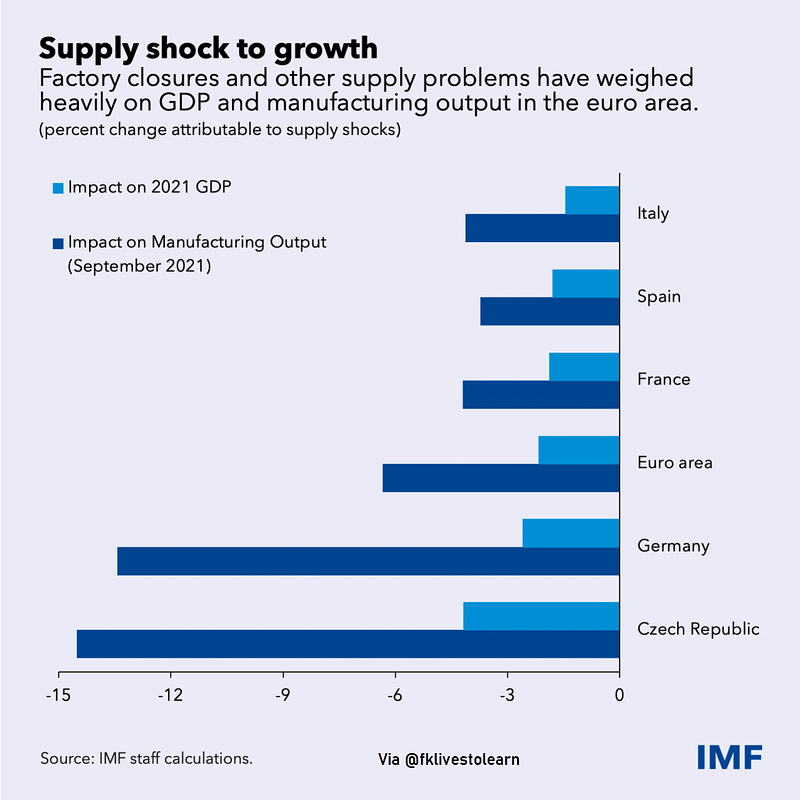
Supply Chain Shock on Euro Area
In a new paper, IMF estimates that euro-area manufacturing output in the fall of 2021 would have been about 6% higher without the constraints on supply. Based on the historical correlation between manufacturing and overall output, we assess that gross domestic product would have been about 2% higher — equivalent to about one year’s worth of growth in normal pre-pandemic times for many European economies (Figure 5). The drag on output was largest in countries where manufacturing firms operate at the downstream end of global value chains and are reliant on highly differentiated intermediate inputs. Key examples include countries with large automotive sectors, such as Germany and the Czech Republic, where the manufacturing output would have been as much as 14% higher.
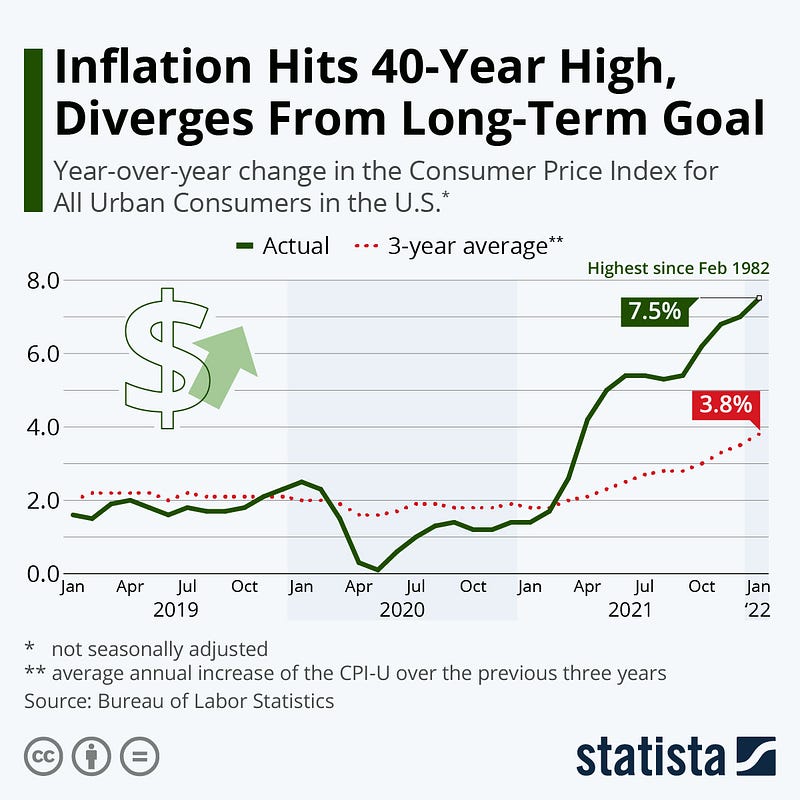
U.S CPI Inflation at a 40-Year High
Consumer prices in the United States continued to surge at the start of 2022, as inflation hit a 40-year high in January. The Consumer Price Index for All Urban Consumers (CPI-U) was up 7.5% compared to a year ago (Figure 6), while the core index excluding more volatile food and energy prices increased 6.0% over the last 12 months. Those were the highest readings since February 1982 and August 1982, respectively, further fueling fears that inflation is out of control. When inflation spiked in the spring/early summer of 2021, it was largely due to the so-called base effect, caused by the pandemic’s cooling effect on consumer prices a year earlier. At the onset of the pandemic, prices had taken a dive due to a sudden drop in consumer spending and fuel demand before slowly climbing back to their pre-pandemic trajectory over the summer and fall. Due to that initial dip in consumer prices, year-over-year comparisons were always going to be exaggerated for a while, but that is no longer the case.
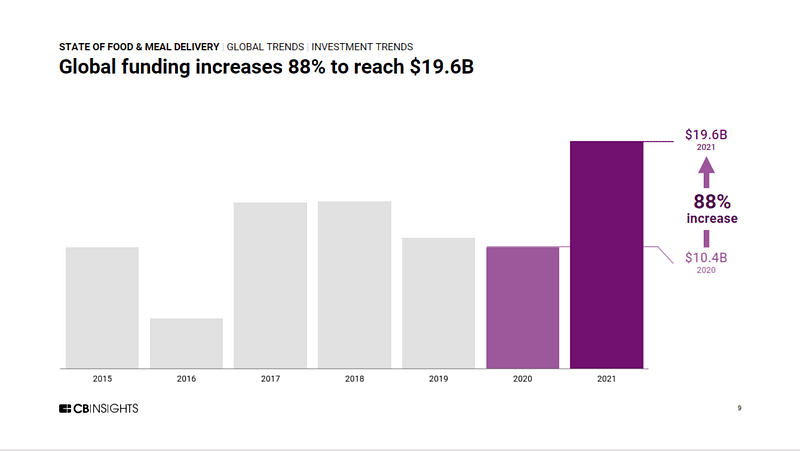
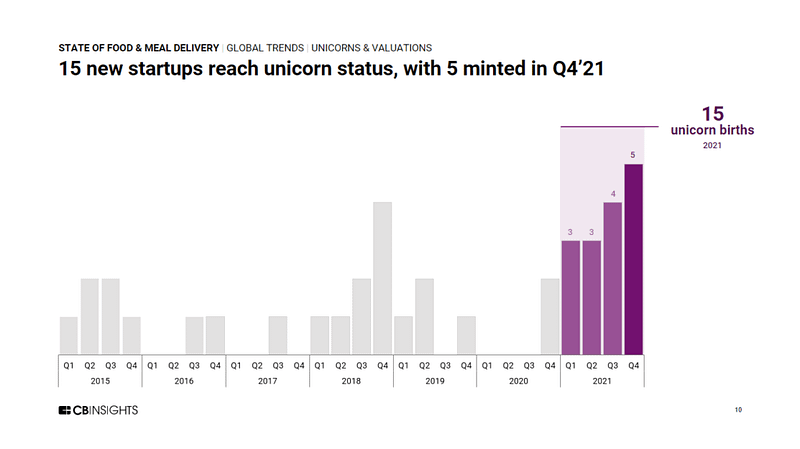
Urban Delivery Funding Surge
Food & meal delivery saw a record-breaking year for funding, mega-rounds, unicorns, and more. Food & meal delivery funding reached a record high in Q4’21 (Figure 7). In CB Insight’s State Of Food & Meal Delivery 2021 report, they dig into global investment trends to highlight key takeaways like an 88% jump in annual funding with top equity deals and startups dominating the space.
Market Humor: Markets Bet On Fed March Rate Hike As Inflations Soars Out Of Control

Previous Edition of GBW
Read more stories like this and others by Faisal Khan on Medium.
Stay informed with the content that matters — Join my weekly Newsletter