
WEEKLY BUSINESS ROUNDUP
Global Business Week: Visualizing 5 Types of Climate Indexes
The state of Financial markets & Economies, Weekly Charts, Business Trends & Statistics
Geopolitical tensions, a spike in near-term inflation expectations and weakened consumer sentiment caused the U.S stocks to fall sharply in the Friday afternoon session. Warning by U.S officials of an imminent Russian invasion of Ukraine sent treasury yields tumbling, oil prices surging and the S&P 500 falling back below its 200-day moving average. The benchmark 10-year yield, which broke above 2% on Thursday for the first time since 2019, fell back to about 1.93% on Friday. Last week’s volatility in the bond market started after hotter than expected inflation data spooked the investors as they began to price in a 0.50% hike in the Fed’s next meeting in March. For the week, the Dow Jones average fell 1%, the S&P 500 shed 1.8% and the Nasdaq Composite retreated 2.2%.
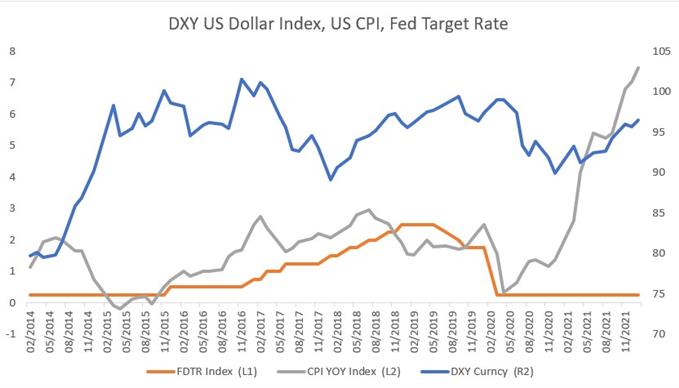
Higher-than-expected US CPI readings spurred fears that the Fed may tighten monetary policy more aggressively in the months to come, sending the DXY US Dollar Index to a weekly high. It might prove to be very different from the previous 2015–2018 rate-hike cycle. Inflation is much higher this time due to unprecedented monetary and fiscal stimulus put in place to shore up growth amid the Covid-19 pandemic. Labor market conditions have improved tremendously in recent months, with the latest nonfarm payrolls report showing a robust increase in job numbers and solid wage growth. This suggests that the Fed may tighten monetary policy more aggressively than the previous cycle, paving the way for a stronger US Dollar down the road.
In alignment with the risk-off sentiment in equities, cryptos lost footing during the week. Although the extreme bearish sentiment in the digital assets seems to have eased off, the larger downward trend is still intact. After reaching an earlier high of around $45.9k, Bitcoin has slipped to $41.9k at the time of writing — immediate support is in the $40.7k region. Ethereum’s rebound took it to the $3,300 vicinity before it slipped to about $2,850 at the time of publishing. The sentiment is currently mixed in the short term with a lot hinging on geopolitical & macroeconomic factors.
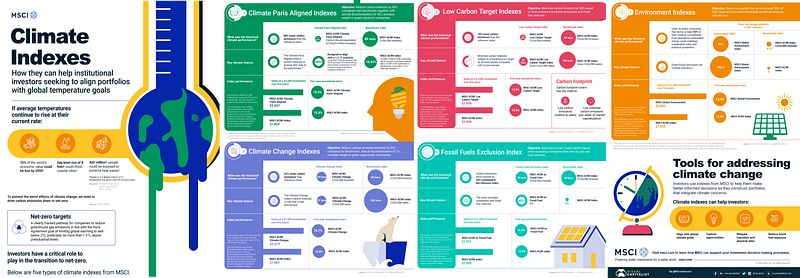
To prevent the worst effects of climate change, climate experts believe we need to drive carbon emissions down to net zero. This infographic from MSCI shows five climate indexes that can help align investor portfolios to the goals of the Paris Agreement, mitigate emissions, and reduce fossil fuel exposure.
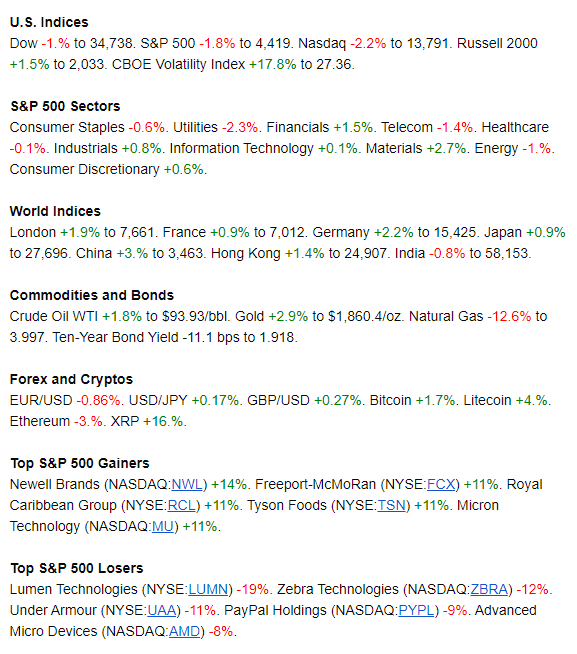
And finally, before moving on to some other statistics, here are the weekly & YTD numbers from various markets and different assets (Figure 1).
How Big is Apple?
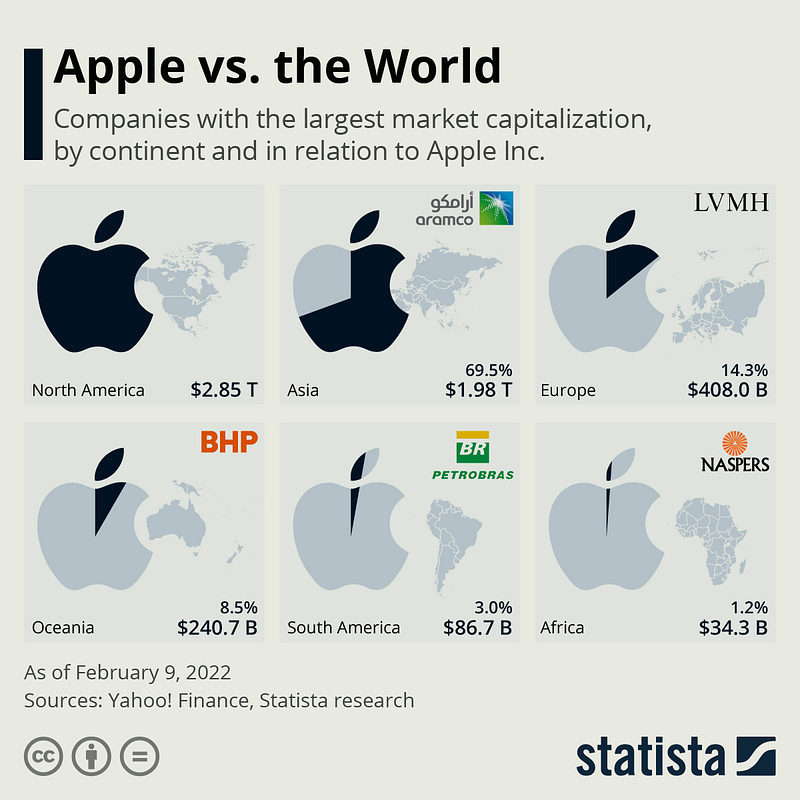
The list of the world’s most valuable companies is famously dominated by North America, with Apple currently sitting at the top of this prestigious pile. In the infographic below (Figure 2), Apple is pitted against the rest of the world to see how each continent’s biggest public company compares to the might of the tech giant. Apple wins, obviously, but the interesting part is the degree to which the most valuable companies of each region lose when comparing their market capitalization figures. Asia produces the strongest contender. Saudi Aramco, aka Saudi Arabian Oil Company, weighed in with a market cap of $1.98 trillion at the beginning of February 2022 — that’s 69.5% of Apple’s $2.85 trillion. Next up is Europe.
There, the fight already starts to become very one-sided, with the luxury conglomerate LVMH looking great while entering the ring but failing to land any punches: Its $408 billion market cap is only 14.3% the size of its heavyweight opponent’s. Oceania’s most valuable, the Melbourne-based mining company BHP has a market capitalization equivalent to 8.5% of Apple’s, while Petrobras from South America reach just 3%. Despite being the most valuable public company in Africa, South African publishing firm Naspers’ market cap is a mere 1.2% of the almost 3 trillion attributed to Apple.
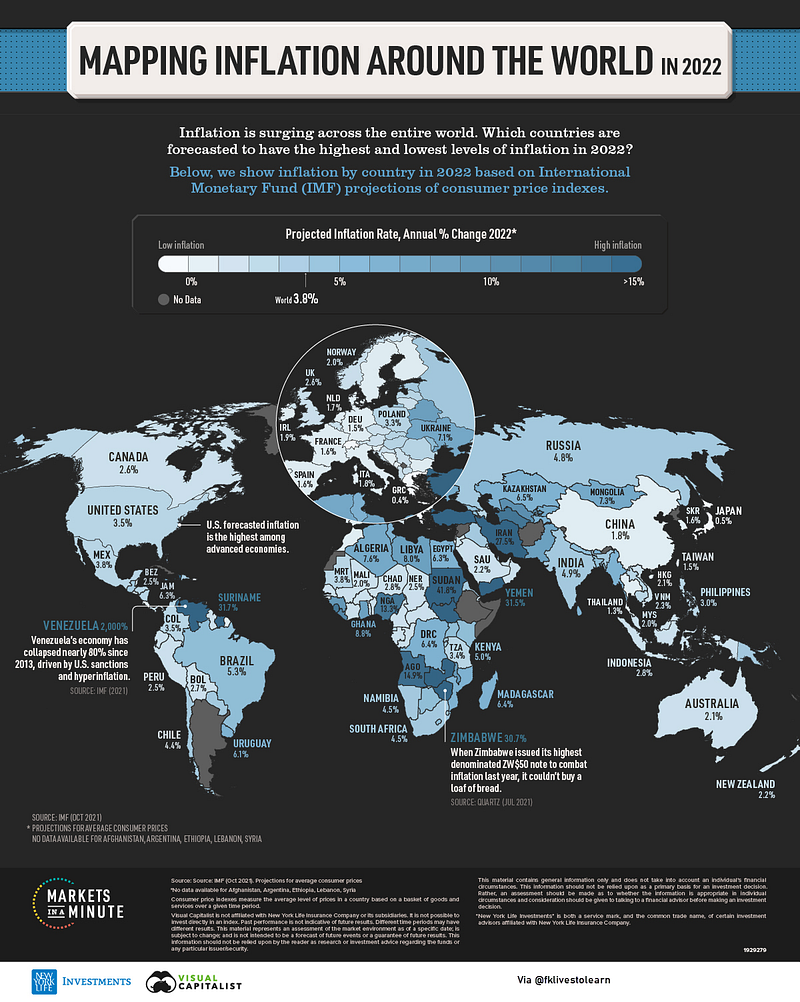
What will inflation look like in 2022?
Today, this is a question on many investors’ minds. Across several countries, inflation has hit its highest level in decades. Supply shortages and massive monetary stimulus have contributed to increasing consumer prices. Asset prices, including houses, have also risen significantly. This Markets in a Minute infographic (Figure 3) from New York Life Investments shows inflation by country in 2022 according to IMF projections.
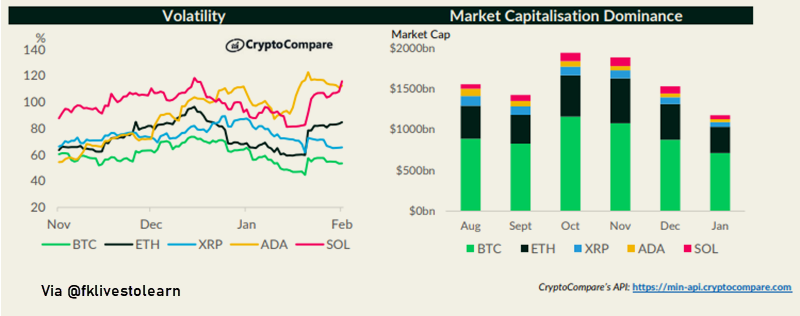
Marketcap of the Top 5 Cryptos Slides
Volatility across the top 5 assets generally increased over the month of January. BTC and ADA remained the least and most volatile assets at 53.3%, and 111% respectively. The total market cap for the top 5 cryptocurrencies fell 23.3% in January to $1.17 trillion (Figure 4), with BTC gaining marginal market share (rising above 60% for the first time since September 2021). The other four assets’ market share distribution remained largely unchanged.
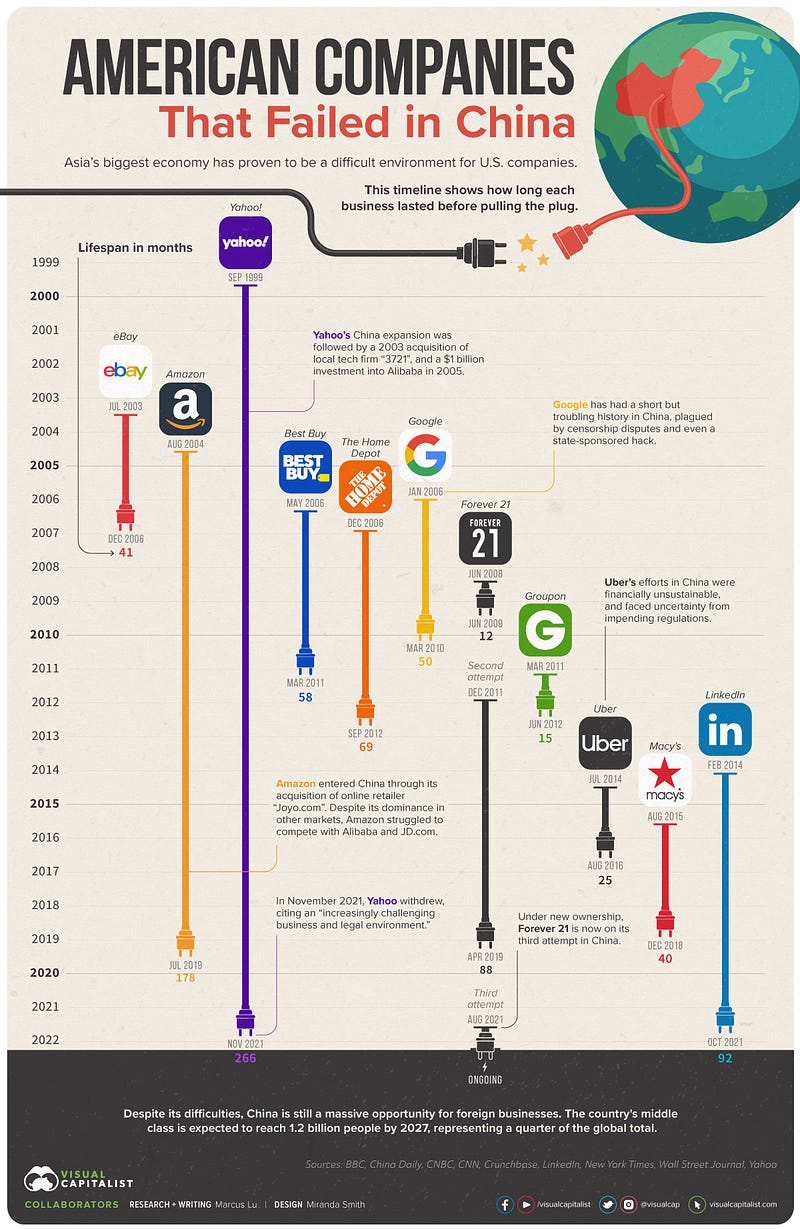
U.S Companies Failing in China
For decades, China has been a top priority for American companies looking to expand. This is because the country’s middle class is simply enormous, growing from 3.1% to 50.8% of the country’s total population between the years 2000 and 2018. According to Brookings, there are now at least 700 million people in China’s middle class, and this group has never had more disposable income to spend on consumer goods and services. Despite the size and potential of the market, China is not an easy place for foreign businesses to enter. As this infographic below (Figure 5) shows, many of America’s biggest names eventually admitted defeat.
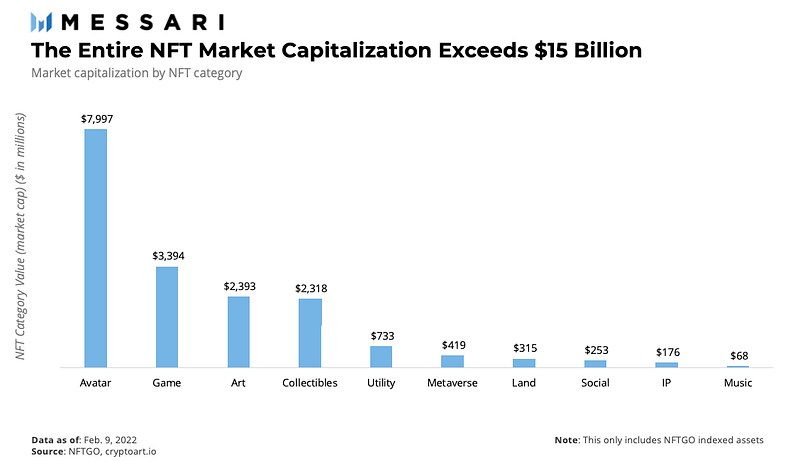
NFT Marketcap Exceeds $ 15B
According to NFT analytics platform NFTGO, the NFT market capitalization exceeds 16 billion or around 1% of crypto’s two trillion dollar industry. Although the term NFT is most commonly used to reference avatar or art NFTs, they come in a variety of different flavors including Digital land, Avatars, Gaming assets, Metaverse assets, Intellectual property, Music & Financial. Avatar NFTs currently represent the largest sub-sector within NFTs, accounting for almost $8 billion of the $18 billion dollar market capitalization (Figure 6) and more than the next three categories combined.
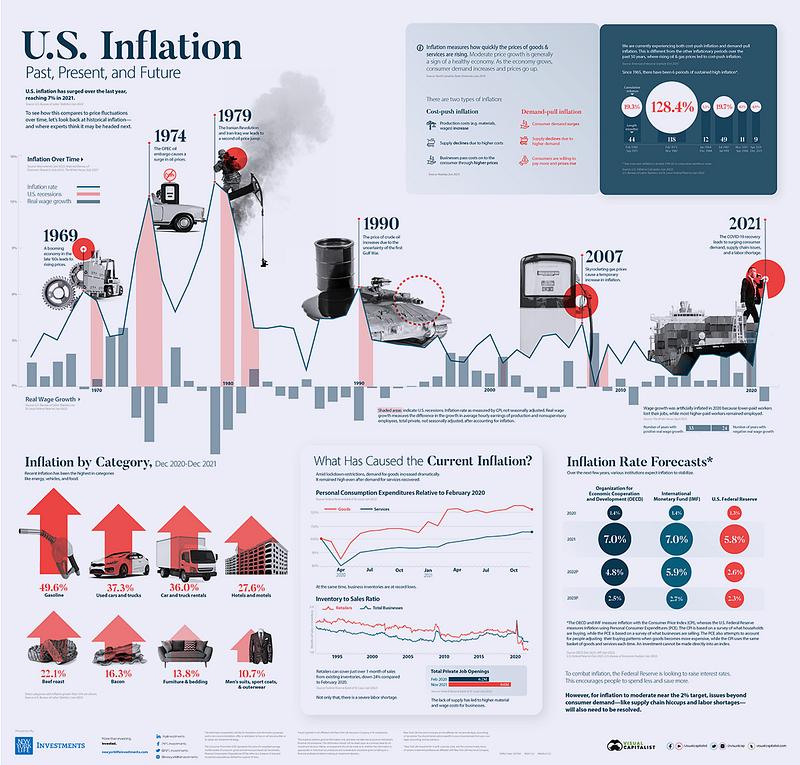
A Historical Perspective on U.S Inflation
There are two types of inflation — Cost-push inflation where Production costs, such as materials and wages, increase. Supply declines due to higher costs, and businesses pass costs on to the consumer through higher prices. And the second is Demand-pull inflation where consumer demand surges. Supply declines due to higher demand, which means consumers are willing to pay more and prices rise. We are currently experiencing both cost-push inflation and demand-pull inflation. This is different from the other inflationary periods over the past 50 years, where rising energy prices led to cost-push inflation. The inflation rate in the U.S. has surged, reaching 7% year-over-year in December 2021. This marks the highest level in 40 years. In this graphic from New York Life Investments (Figure 7), we look back at historical inflation — and where experts think it may be headed next.
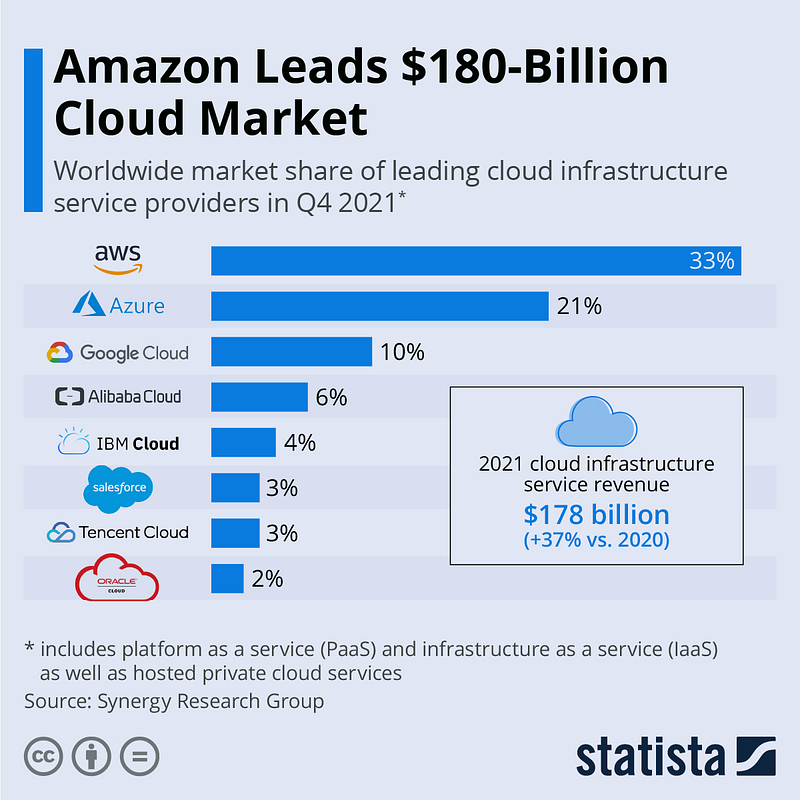
Amazon is the Leader of Cloud Market
Having established itself as an early leader in the market for cloud infrastructure, Amazon Web Services (AWS), the online retailer’s profitable cloud platform, is still ahead of the pack. According to estimates from Synergy Research Group, Amazon’s market share in the worldwide cloud infrastructure market amounted to 33% in the fourth quarter of 2021, still exceeding the combined market share of its two largest competitors, Microsoft and Google. In Q4 2021, global cloud infrastructure service revenues surpassed $50 billion for the first time, bringing the industry total for the year to $178 billion. As the following chart shows (Figure 8), Amazon and Microsoft accounted for more than half of cloud infrastructure revenues in the final three months of 2021, with the eight largest providers controlling roughly 80 percent of the market.
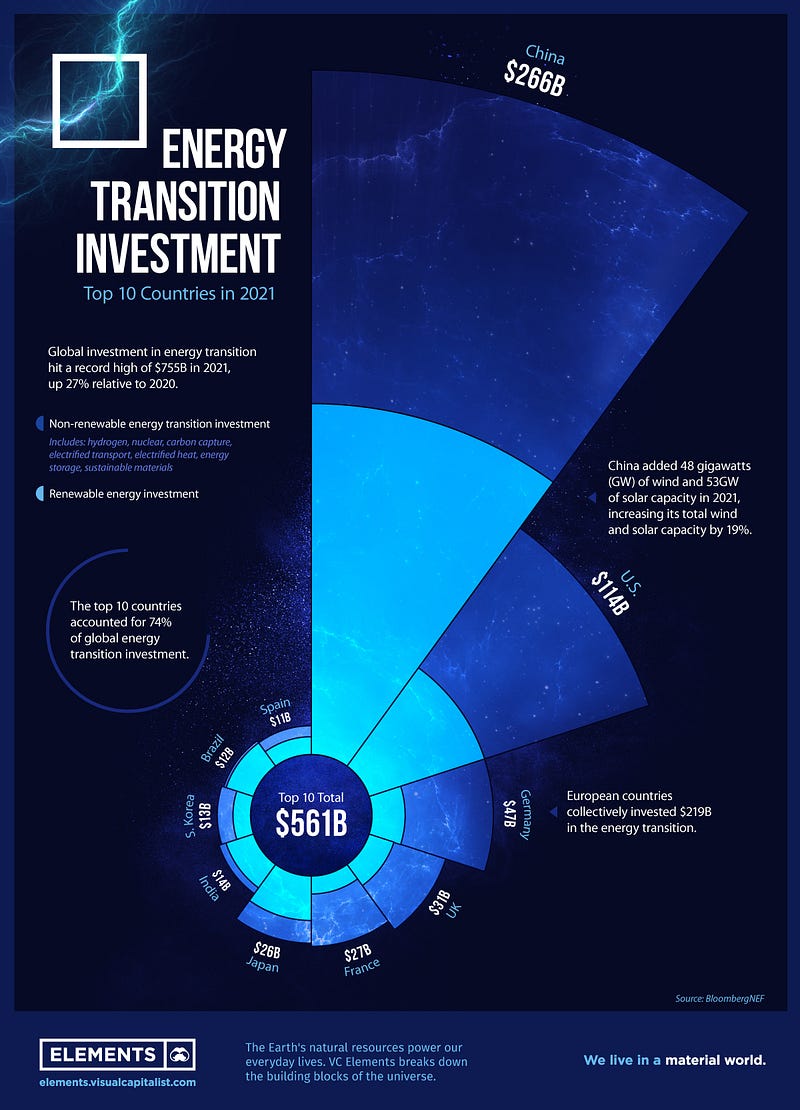
Energy Transition Investment
More than 130 countries have set or are considering a goal of net-zero emissions by 2050. Achieving net-zero on a global scale, however, requires $125 trillion in climate investment by 2050, according to research commissioned by the United Nations Framework Convention on Climate Change (UNFCCC). While that level of investment hasn’t been achieved yet, it’s ramping up. In 2021, the world spent $755 billion on deploying low-carbon energy technologies, up 27% from the year prior. This graphic (Figure 9) highlights the top 10 countries by low-carbon energy investment in 2021 using data from BloombergNEF.
Market Humor: Fed, ECB, BoE Race To Raise Rates Amid Soaring Inflation!

Previous Edition of GBW
Read more stories like this and others by Faisal Khan on Medium.
Stay informed with the content that matters — Join my weekly Newsletter


