
WEEKLY BUSINESS ROUNDUP
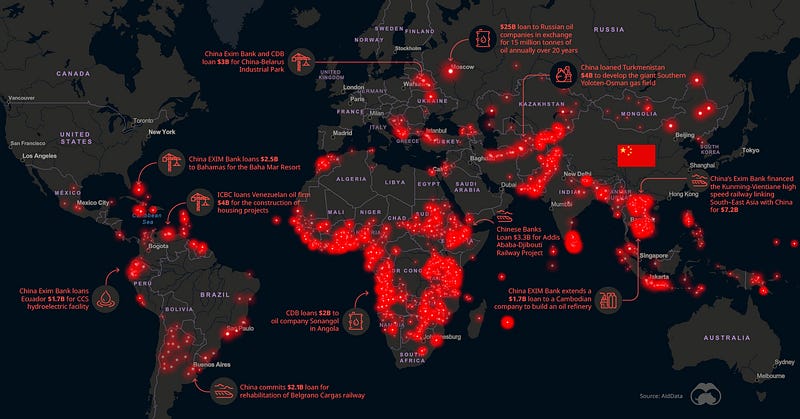
Global Business Week: How Chinese financing is fueling Megaprojects around the World
The state of Financial markets & Economies, Weekly Charts, Business Trends & Statistics
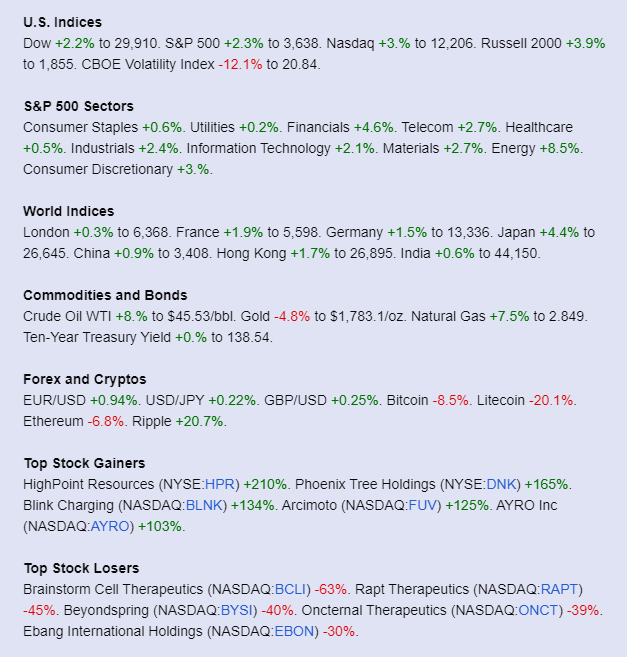
Who would have thought back in March-April that seven months later Dow would be hitting the 30,000 points milestone. DJIA achieved this landmark on Tuesday for the first time since its inception in 1896. It has been an astounding climb given that it took 18 years for the index to get from 10,000 to 20,000, but less than four years to reach 30,000 — that too with the Coronavirus pandemic.
Things only look brighter for the stocks from hereon in, with another stimulus package on the horizon, vaccine optimism, booming housing market, and U.S economic numbers which continue to surprise towards the upside. For the week the Dow closed above 30,000 for the first time, with the S&P 500 and Nasdaq closing up 2.3% and 3.0% respectively — with both indices closing at fresh record highs.
With the risk-on trade in full swing in Equities, Greenback slipped further pushing the dollar index to the cusp of another leg lower. DXY closed at 91.78, a whisker away from the previous lowest reading charted earlier in September. Seems like the breakdown of the reserve currency is about to gain more momentum.
Extreme volatility was seen in the digital assets as the premier crypto, Bitcoin, reversed hard from the all-time high. Falling almost 17% to the region of $16,200. Some of the Alt. coins saw ever bigger losses in the region 20%+ including Ethereum. However, every healthy market has pullbacks and periods of consolidation and this was perhaps one of those moves. BTC has moved back above $18k at the time of writing along with Alt. coins rebounding as well — giving credence to this narrative. I still believe more there is more juice left in this bullish rally.
Before moving on to some of the other statistics, have a look at this week’s featured infographic (above), which highlights How Chinese Financing is Fueling Megaprojects Around the World. AidData, a research lab at the W&M Global Research Institute, has compiled a massive database of Chinese-backed projects spanning from 2000–2017. Collectively, it creates a comprehensive look at China’s efforts to grow its influence in countries around the world, particularly in Africa and South Asia.
Tax abuse is a major problem for many countries
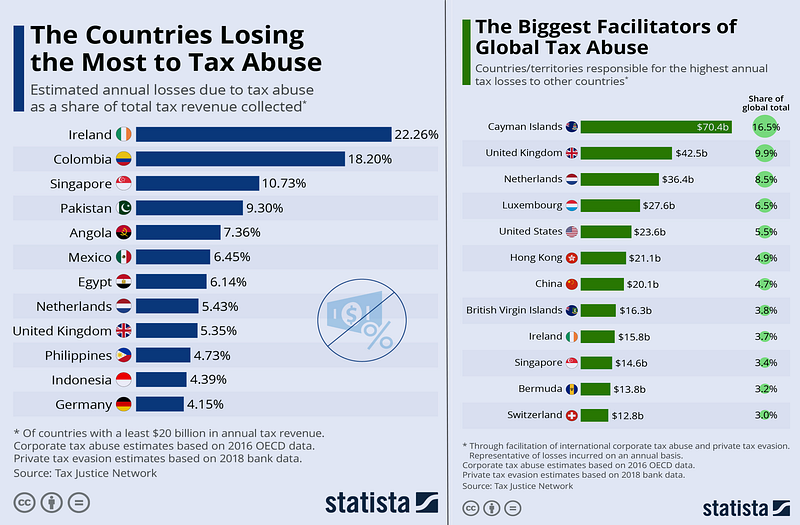
The two charts above present a picture of the most affected countries are by tax abuse (left chart) and the biggest facilitators of this financial crime. Corporate & private tax evasion is employed by individuals and business entities to hide their wealth in tax haven countries (right chart). For the countries affected by this tax abuse, it means losing billions in tax revenue which is critical in running a country.
The biggest loser is Ireland with an estimated 22.26% of the total tax revenue collected lost to abuse, followed by Colombia & Singapore — losing 18.2% and 10.73% respectively (Figure 2). On the flip side, the Cayman Islands is the biggest facilitator of such an activity with an estimated $70.4 billion or 16.5% of global total tax abuse making its way there. Ireland is ironically one of the top 10 facilitator countries as well.
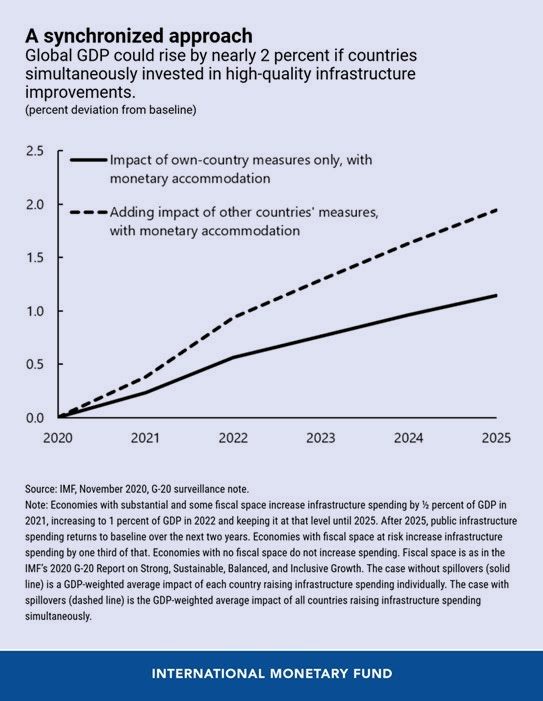
Collective Infrastructure Push will boost Global Growth
An IMF report published ahead of the G20 leaders meeting argues that a synchronized infrastructure investment push could invigorate growth globally, limit scarring, and address climate goals. In fact, when many countries act at the same time, public infrastructure investment could help lift growth domestically and abroad through trade linkages. This positive “spillover” effect could provide an additional boost to global output (Figure 3).
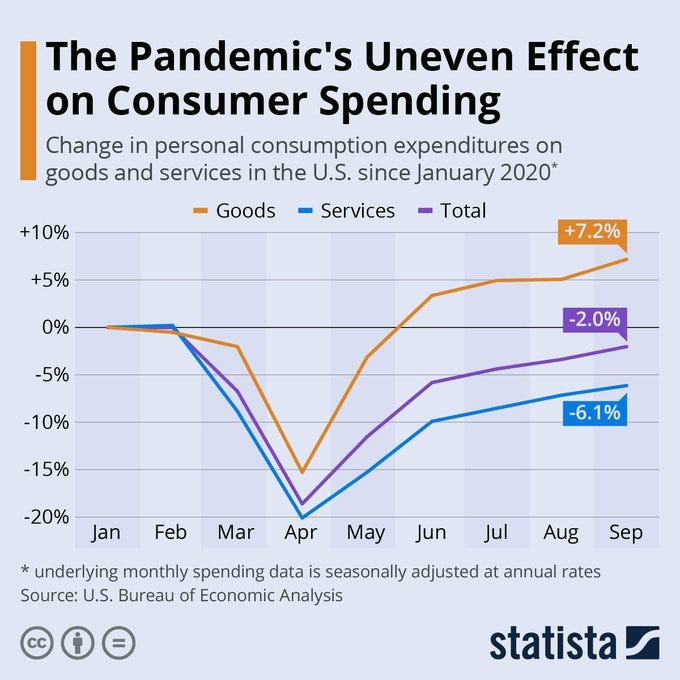
The Pandemic’s uneven effect on Consumer Spending
Although consumer spending fell off the cliff when the lockdowns started in early spring this year — consumer spending in the U.S fell almost 20% from levels in January (Figure 4). Although goods transactions returned to pre-pandemic levels in early June, the services sector remains sluggish. According to the data from the U.S. Bureau of Economic Analysis, while spending on goods quickly recovered from the initial shock, consumer spending on services is still more than 6% off pre-pandemic levels.
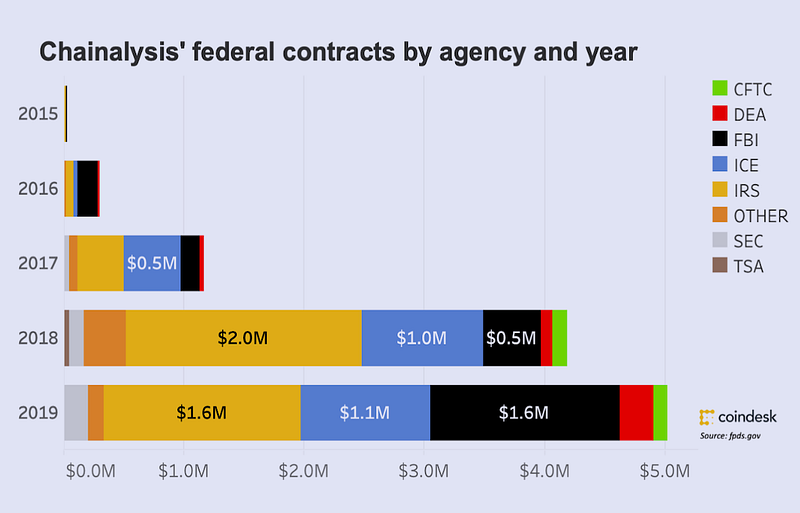
Bitcoin Investigation Giant To Raise $100 Million
Chainalysis a bitcoin unicorn and a crypto investigation firm raised $100 million in their Series C at a $1 billion valuation. Over the past year, the firm’s revenue has reportedly doubled (Figure 5). Chainalysis has already helped the U.S Department of Justice track down over $1 billion in cryptocurrencies, which were seized earlier this month, and has now amassed 350 customers, many of which are state government and private institutions. So assuming we are at $10 million this year, and $20 million next year, that is still a valuation which is 50x revenue.
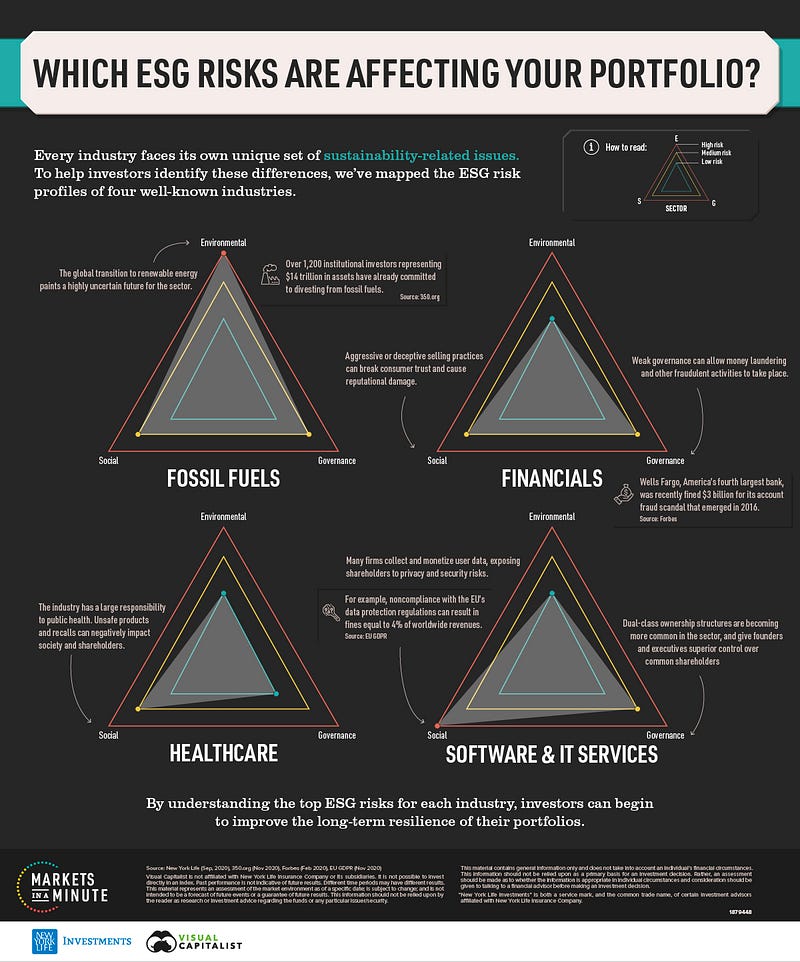
Which ESG Risks Are Affecting Your Portfolio?
Sustainability is best described as the consideration of environmental, social, and governance (ESG) factors when analyzing companies. Combining these non-financial metrics with traditional analysis has been proven to have a positive influence on long-term returns. According to the Minute chart (Figure 6) from New York Life Investments, Visual Capitalist has mapped the ESG risk profiles of four prominent industries to gain a better understanding of the sustainability issues they’re likely facing.
The global transition to renewable energy paints a complex future for the sector, though it’s uncertain when oil demand will peak — predictions range from 2025 all the way to 2040 (Figure 6). Nevertheless, market participants are taking action. To date, over 1,200 institutional investors representing $14 trillion in assets have made commitments to divest from fossil fuels.
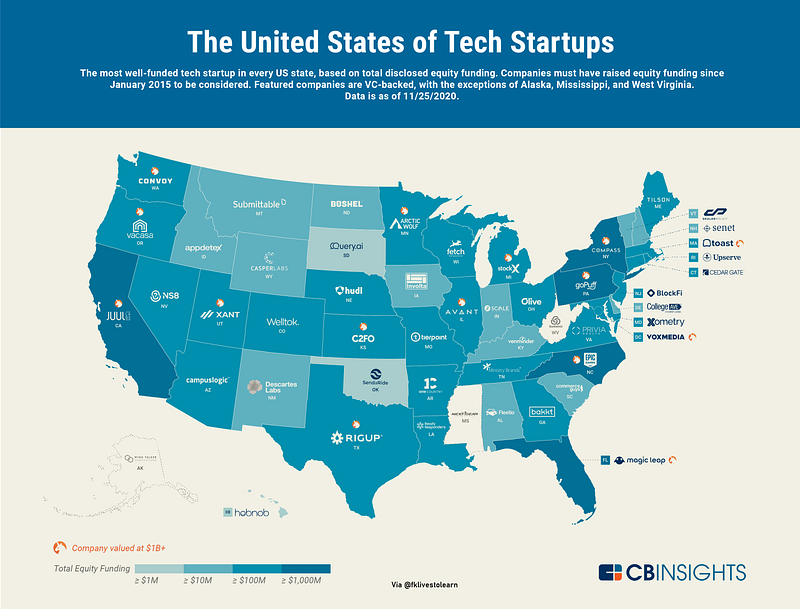
The United States of Tech Startups
The infographic (Figure 7) from CB Insights shows the top tech startup in every US state, based on funding totals. Companies include JUUL Labs, Epic Games, and Magic Leap. The tech boom has diffused beyond the traditional hotbeds of California, New York, and Massachusetts, spreading across the entire US. In our latest map of the most well-funded tech startup in each state, some companies with the deepest pockets were found in Florida (Magic Leap, $3B), North Carolina (Epic Games, $3.4B), and Washington (Convoy, $675M).
Market Humor: Bulls on a Rampage

Previous Edition of GBW:
