
WEEKLY BUSINESS ROUNDUP
Global Business Week: ETFs just had the best first half of inflows ever
The state of Financial markets & Economies, Weekly Charts, Business Trends & Statistics
Better than expected U.S retail sales report & quarterly earnings were not able to outweigh the investor concerns emanating from rising inflation and a global resurgence of the delta variant in the current pandemic. The sentiment was echoed all day on Friday as all three major U.S indexes ended the day in the red. The yield on the 10-year U.S. Treasury perked up a bit, but nearly all major asset classes were under pressure throughout the session.
The major market averages all snapped three-week winning streaks, with the Dow dropping 0.5%, the S&P 500 slipping nearly 1% and the Nasdaq Composite closing 1.8% lower. But the bond market continues to buck inflation fears, as the 10-year U.S. Treasury yield fell to around 1.30%. Crude oil slumped to its biggest weekly loss since mid-March as markets face the prospect of extra supplies from OPEC producers, and a stronger dollar also hurt the appeal of commodities.
Talking about the Greenback, the reserve currency strengthened its bullish tone as it headed to fill in the gap down from early April — the benchmark index DXY closed the week @ 92.71. Although the underlying weakness in stocks pushed the US dollar higher this week, Fed Chair Powell’s comments on Wednesday and Thursday proved unhelpful to the theme as US yields continued to drop. If that is the case, the strength might not sustain in the medium term. For now, though, higher lows in DXY dictate immediate strength.
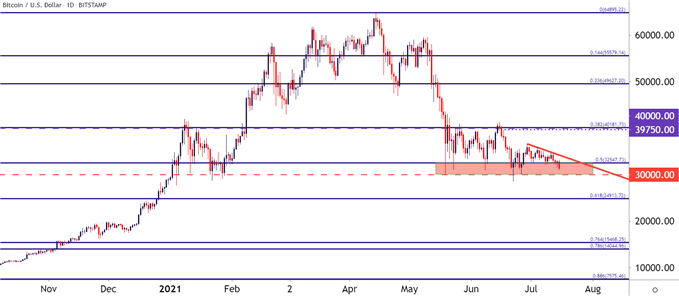
Although Cryptocurrencies were the poster child for speculative fervor earlier in the year, the recent decline and the current price chart for BTCUSD presents a scary prospect. Bitcoin is sitting precariously close to the same support zone that came into play in mid-May. And while the initial bounces back in May or early June led to a run-up to the 40k level, more recently, those bounces have been showing a diminishing impact, and now there’s a descending trendline sitting atop price action. A similar setup is in play for Ethereum as well, which is close to the support zone of $1,800. At the time of writing, BTC was trading around $31.6k while ETH’s price stood just over $1,880.
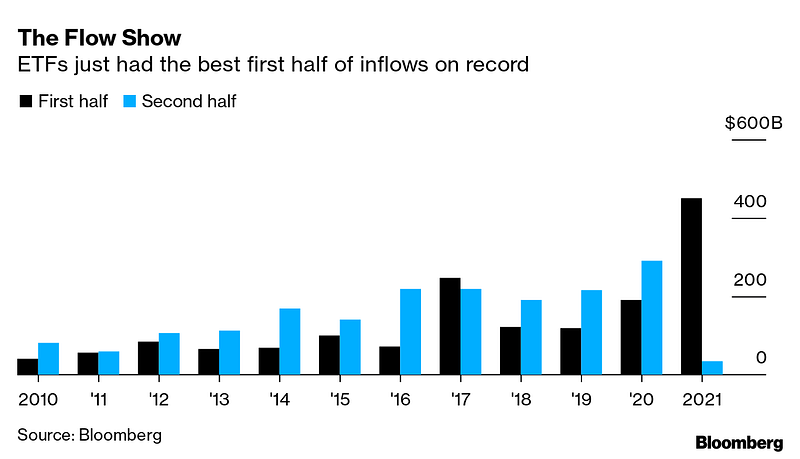
Today’s featured chart (above) shows that ETFs are on the brink of sucking in more money over seven months than in any calendar year on record — already at $488.5 billion, they will likely break the $497 billion full-year mark set in 2020 in just a few weeks, or maybe a few days. U.S. money managers are rushing headlong into the fast-expanding universe of exchange-traded funds.
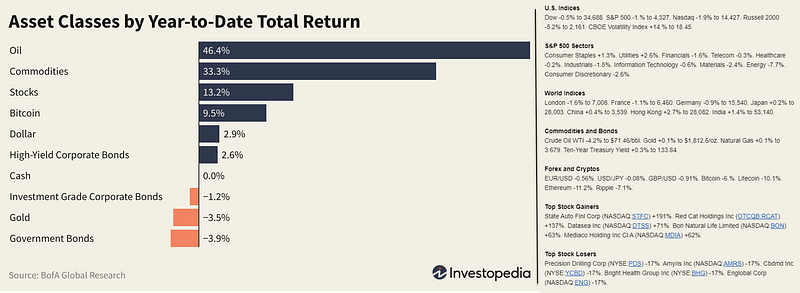
And finally, before moving on to some other statistics, here are the weekly & YTD numbers from various markets and different assets (Figure 1).
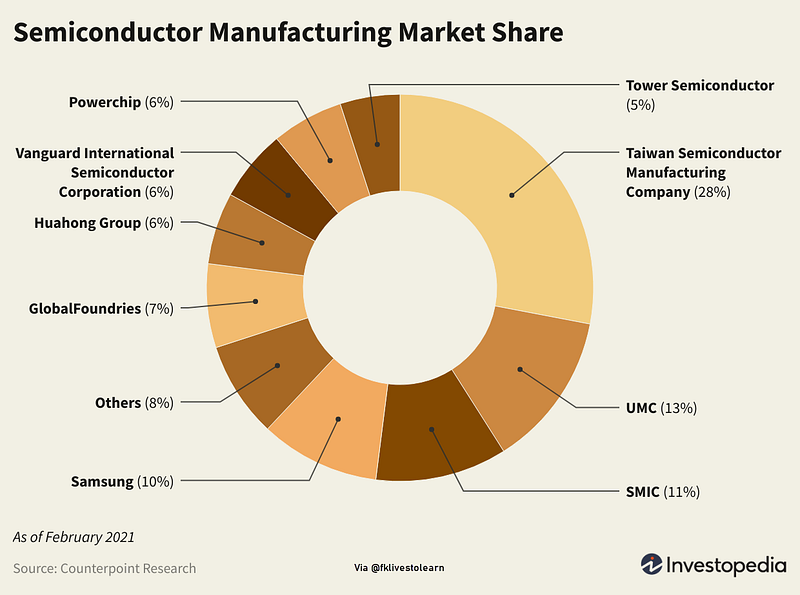
TSMC is the Biggest Chip Producer
Intel said in March that the company plans to invest $20 billion in its U.S. semiconductor manufacturing facilities this year & trying to become a specialty chip manufacturer for others, a sub-industry currently dominated by Taiwan Semiconductor Manufacturing Company or TSMC. TSMC controls 28% of the global semiconductor manufacturing market as of the first quarter of 2021 (Figure 2) and generates as much as 56% of global revenues for outsourced specialty chip manufacturing. It has struggled to meet demand in 2021 due to COVID-19-related workforce reductions and shortages of key manufacturing components like helium. Its production shortfalls have contributed to a global semiconductor chip shortage which has caused sharp price increases in cars, laptops & a variety of other goods.
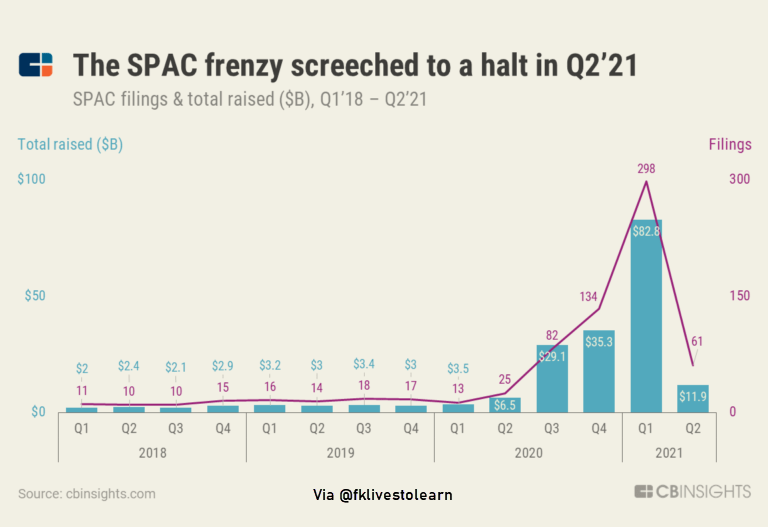
SPAC Frenzy Halting
While SPAC (Special Purpose Acquisition Company) mergers have continued at a breathtaking pace, there’s been a massive slowdown in SPAC filings since the SEC announced new accounting rules in April (Figure 3).
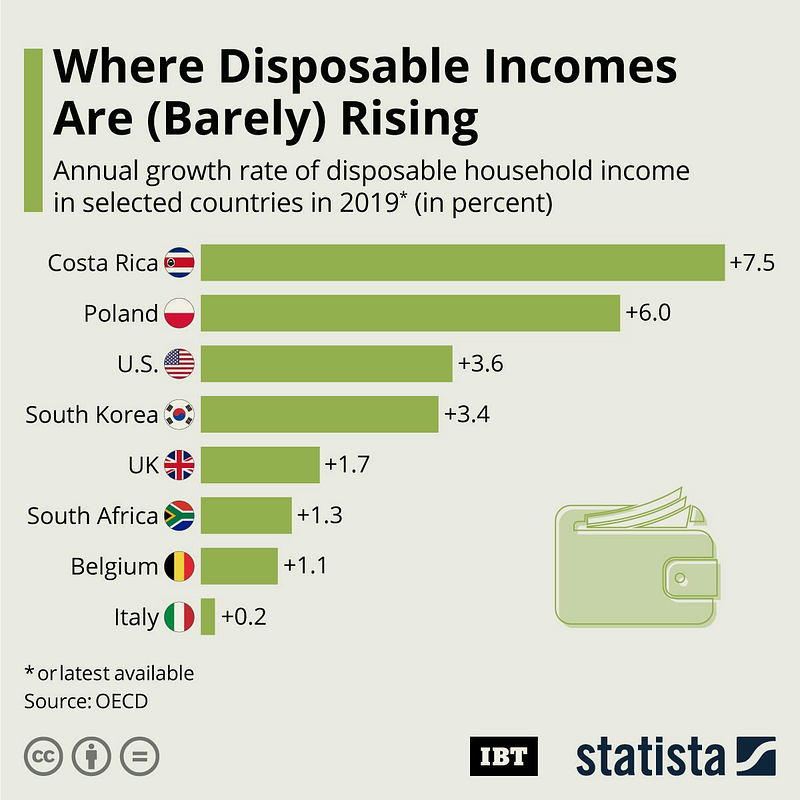
Disposable Incomes barely Rising
Prior to COVID-19, the growth of disposable incomes — the money that remains in peoples’ pockets after they have taken care of their basic needs, differed widely in the OECD. Eastern European countries like Poland, Estonia, or Lithuania saw some of the biggest increases but were surpassed by the OECD’s newest member, Costa Rica. Here, people had 7.5% more spending money per year at their disposal, while the same number was 6% in Poland (Figure 4). Western European countries did not see the same increases — with the exception of Ireland, where disposable incomes grew by 5% in 2019. The lowest increase was seen in Italy at just 0.2%, while Belgium, Switzerland, the Netherlands & South Africa barely surpassed 1%.
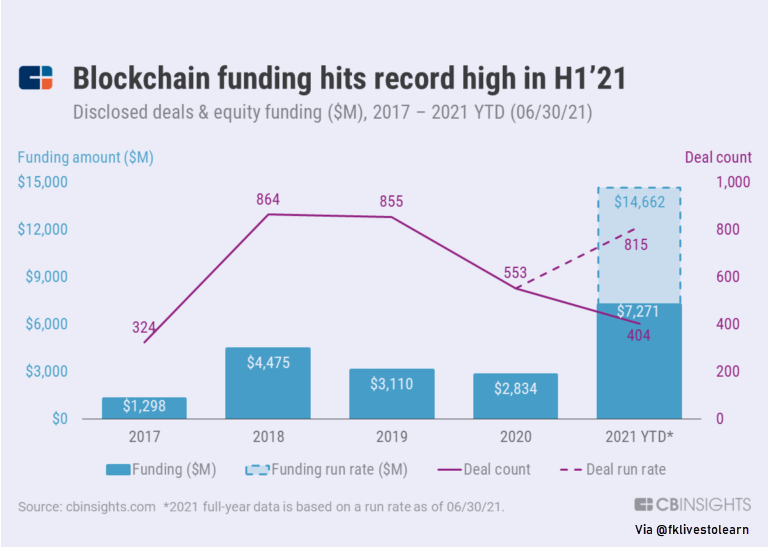
Blockchain Funding High
Investors poured more money into blockchain companies in H1'21 than they did over the course of any full year in history (Figure 5). It’s been a record year so far for blockchain tech, as it has reached new equity funding and media coverage milestones. Blockchain companies have already raised over $7 billion in venture capital and private equity funding in H1’21 — an amount higher than that raised over the course of any full year in history. Even legacy financial institutions are placing bets in the space.
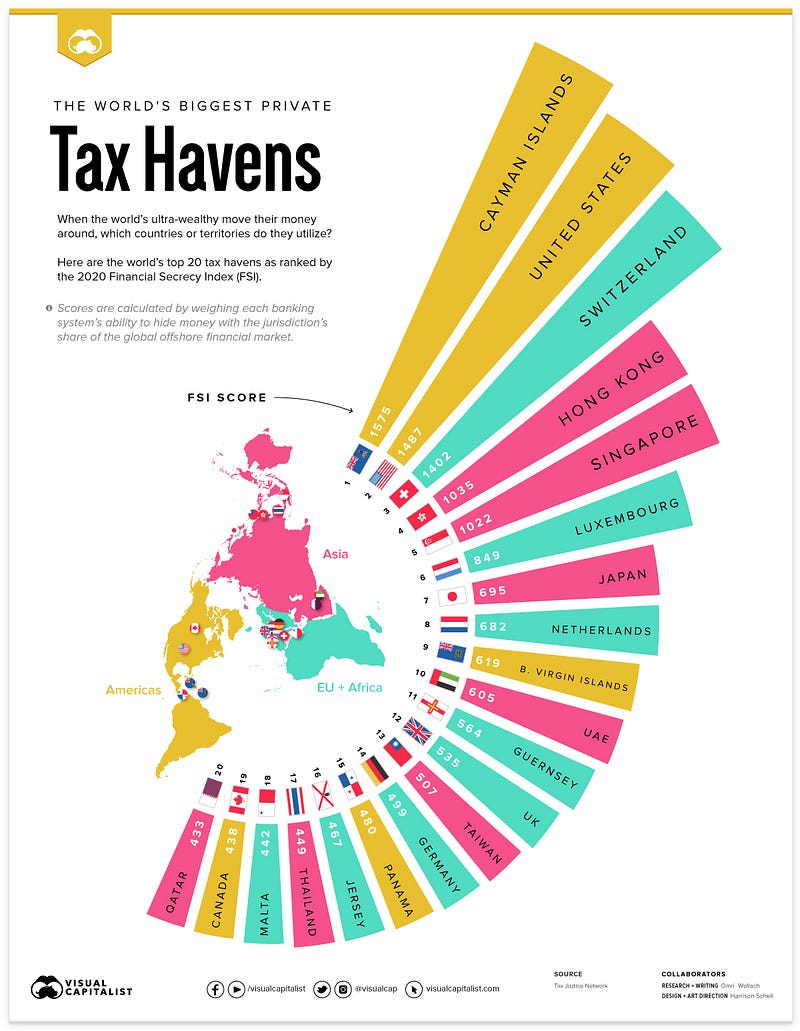
World’s Biggest Tax Havens
When the world’s ultra-wealthy look for tax havens to shield income and wealth from their domestic governments, where do they turn? If you are putting money in offshore bank accounts in order to save on taxes, there are two main criteria you’re looking for — secrecy and accessibility. Based on pop culture and media reports, you might imagine a secretive bank in Switzerland or a tiny island nation in the Caribbean. And though there is some truth to that logic, the reality is that the world’s biggest tax havens are spread all over the world. Some of them are small nations as expected, but others are major economic powers that might be surprising. Here are the world’s top 20 tax havens, as ranked by the 2020 Financial Secrecy Index (FSI) by the English NGO Tax Justice Network (Figure 6).
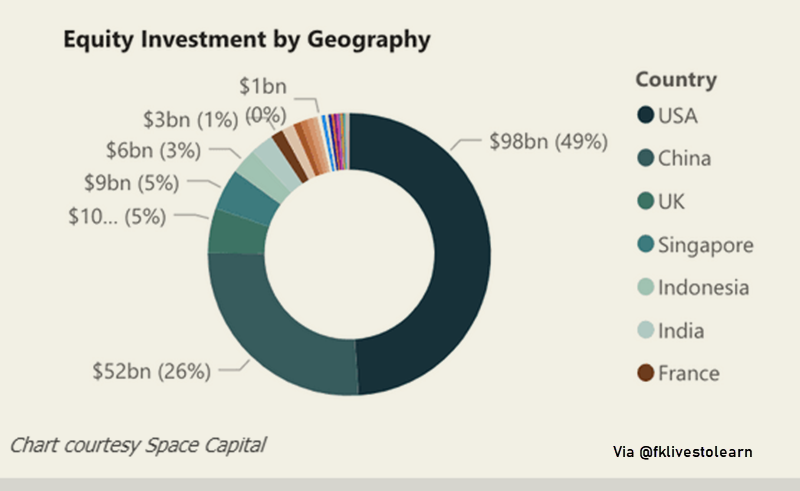
Booming Space Investment
Space Capital said 1,553 unique companies are involved in some form of space business, and together $199.8 billion of equity investments have been made in them since 2012, about half coming in the U.S (Figure 7). In addition, the report noted that 14 space company special purpose acquisition companies (SPAC) have been formed to date, three of which have successfully merged. Space Capital said while it welcomed the additional money these SPACs are bringing to the industry, it warned some may be overvalued from a market perspective.
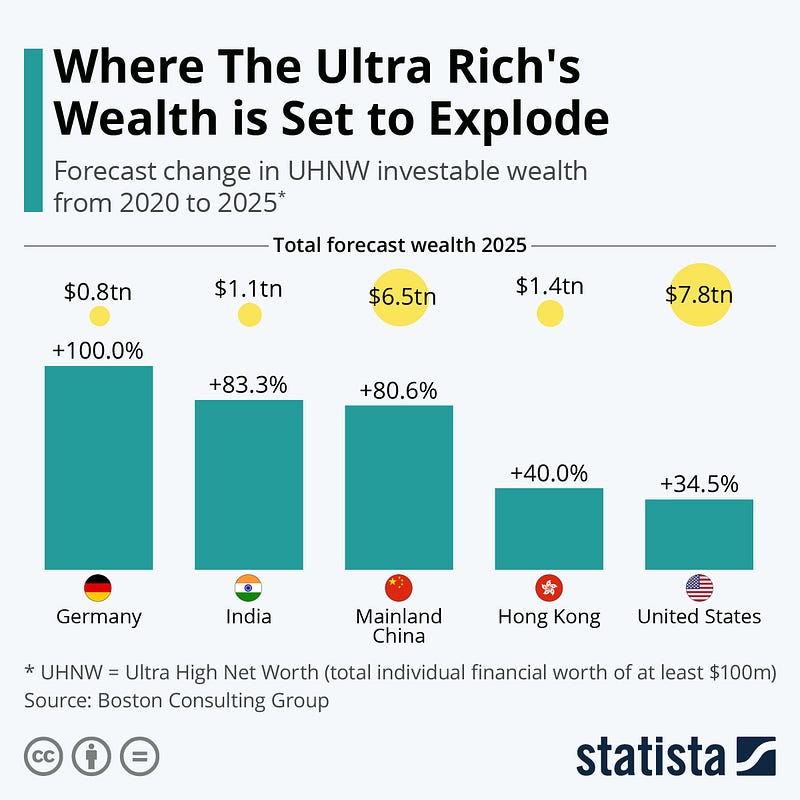
Growth of Ultra Rich Wealth
A forecast by the Boston Consulting Group has forecast substantial increases in the investable wealth of the world’s ultra-rich. ‘Ultra High Net Worth’ individuals are defined as those with a wealth of at least $100 million. When it comes to the places where this is expected to happen to the greatest extent, Germany tops the list where a 100% rise has been forecast from 2020 to 2025. As this infographic shows (Figure 8), the largest absolute total is expected to be seen in the United States, where $7.8 trillion will be in the hands of the ultra-rich there.
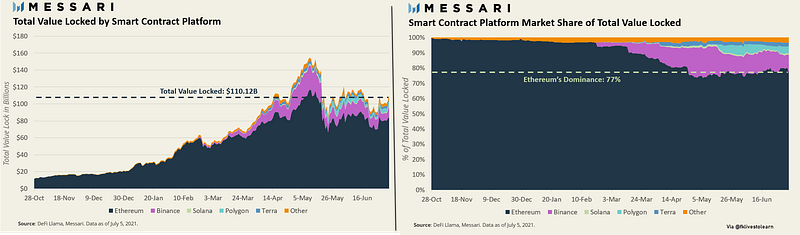
Smart Contract Platform’s TVL
In a relatively short period of time, total value locked (TVL) in smart contracts went parabolic. Since October 2020, a mere seven months ago, assets flowing in different smart contract platforms increased tenfold from $10 billion (almost all locked in Ethereum) to over $100 billion across several scaling solutions and Layer-1s. The growth is nothing short of extraordinary. Although the growth of the Layer-1 and Layer-2 sectors could ultimately benefit Ethereum, its dominance in the space is beginning to shrink. Of the $110 billion dollars in TVL, Ethereum controls roughly 77%, a drop of more than 20% when compared to its dominance five months ago (Figure 9).
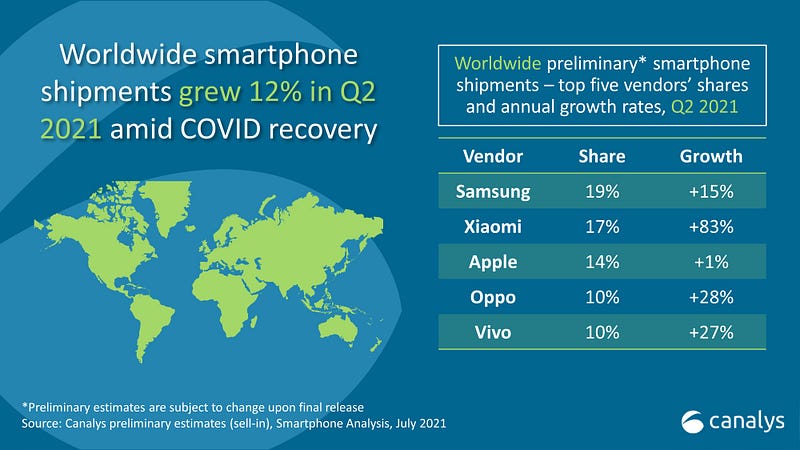
Largest Smartphone Makers
According to technology market analysis firm Canalys, Apple is no longer the second-largest smartphone maker in the world. That distinction now goes to China’s Xiaomi, Canalys said in the second quarter that Xiaomi had 17% of the global market share of smartphone shipments, while Apple was at 14%. Samsung remained the leader with 19% (Figure 10). Oppo and Vivo rounded out the top five. Canalys pointed out that Xiaomi’s move past Apple was helped by rapid growth in its overseas business, including Q2 increases in shipments of more than 300% to Latin America, 150% to Africa, and 50% to Europe.
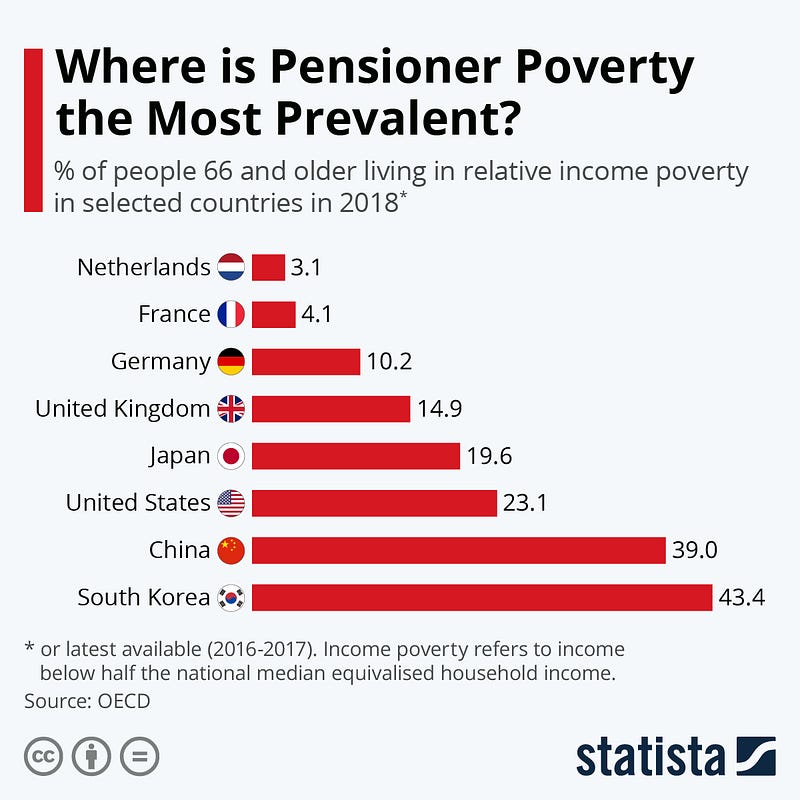
Pension Poverty around the Globe
According to an OECD report, more than a third of people aged 66 and over are living in relative income poverty. This applies to Estonia, Latvia & South Korea as well as for China, which is not a member, but was included in the report. The term is defined as an income below half the national median equivalised household income. The situation was most dire in South Korea where more than 43% of retirees are living in poverty (Figure 11). The report cites a pension system that has not fully matured as one of the reasons for this alarmingly high figure. Australia and the United States also have high levels of poverty among pensioners — 23.7 and 23.1% respectively. The Netherlands is at the very opposite end of the scale with only 3.1% of its retirees struggling financially.
Market Humor: Will the Inflation be Transitory?
Previous Edition of GBW
