
WEEKLY BUSINESS ROUNDUP
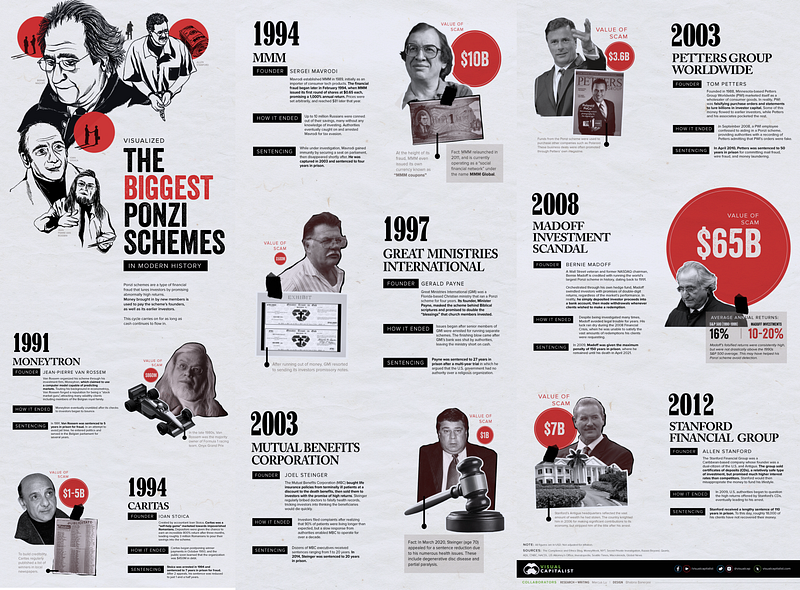
Global Business Week: Biggest Ponzi Schemes in Modern History
The state of Financial markets & Economies, Weekly Charts, Business Trends & Statistics
A volatile week ended on Wall Street with the major indices flip-flopping between gains and losses on Friday. The Evergrande’s fallout prompted traders to pull $28.6 billion from U.S. equity funds over the first three days of the week, the most since February 2018. However, the U.S equities bounced back with a strong two-day rally Wednesday and Thursday after the Federal Reserve signaled no removal of its easy money policy, at least for now. On Friday, the Dow and S&P 500 rose 0.1%, while the Nasdaq fell slightly.
All three averages finished the week higher. Investors continued to pull money out of Treasurys, with the yield on the 10-year note rising five basis points to 1.46%. That’s the highest it’s been in almost three months. The worst-performing stock in both the Dow and S&P 500 was Nike. Shares fell 6% after the athletic shoe and apparel maker warned supply disruptions related to the COVID-19 pandemic are hurting sales.
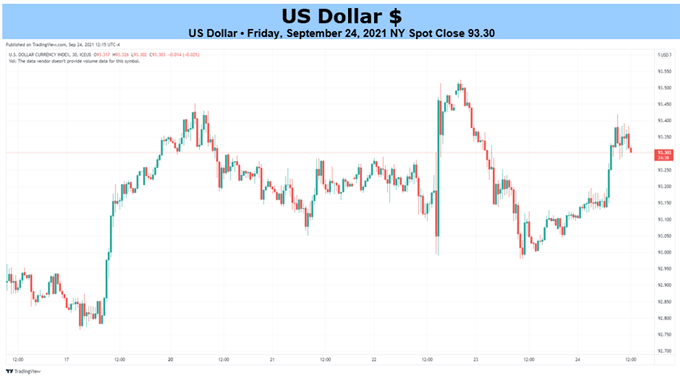
Fresh data prints coming out of the US may prop up the dollar index (DXY) over the remainder of the month as the Federal Reserve appears to be on track to change gears later this year. DXY posted a fresh monthly high of 93.52 following the FOMC interest rate decision as the central bank laid out a tentative exit strategy, and signs of stronger growth along with indications of sticky inflation may prop up the Greenback as it fuels speculation for an imminent shift in Fed policy. A busy week ahead on the U.S data front with GDP, CPI, Durable goods & consumer confidence all due.
Cryptocurrencies dropped after China’s central bank posted an announcement on its website saying all crypto-related transactions are illegal. The nation’s economic planning agency said that it is an urgent task to root out crypto mining and the crackdown is important to meet the country’s climate goals. In the aftermath of this announcement Bitcoin fell 5% and so did the other cryptos. Although the digital assets have regained some of the losses at the time of writing, the bearish pressure is evident — BTC is trading around $42.6k while ETH is close to $2900.
Today’s featured infographic (above) listed the biggest Ponzi schemes in modern history. It is a type of financial fraud that lures investors by promising abnormally high returns. Money brought in by new members is used to pay the scheme’s founders, as well as its earlier investors. The scheme is named after Charles Ponzi, an Italian who became infamous in the 1920s for claiming he could double his clients’ money within 90 days. Since then, numerous Ponzi schemes have been orchestrated around the globe.
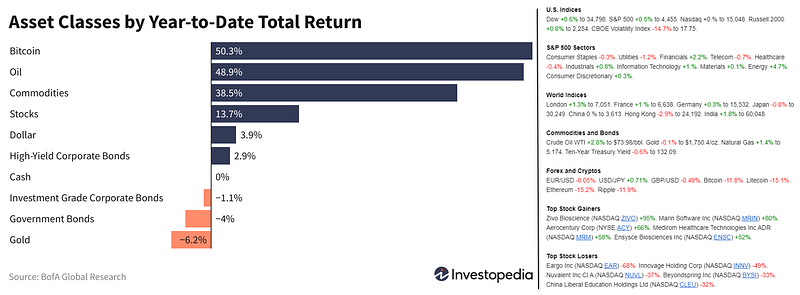
And finally, before moving on to some other statistics, here are the weekly & YTD numbers from various markets and different assets (Figure 1).
Most Hated Brands in Every Country
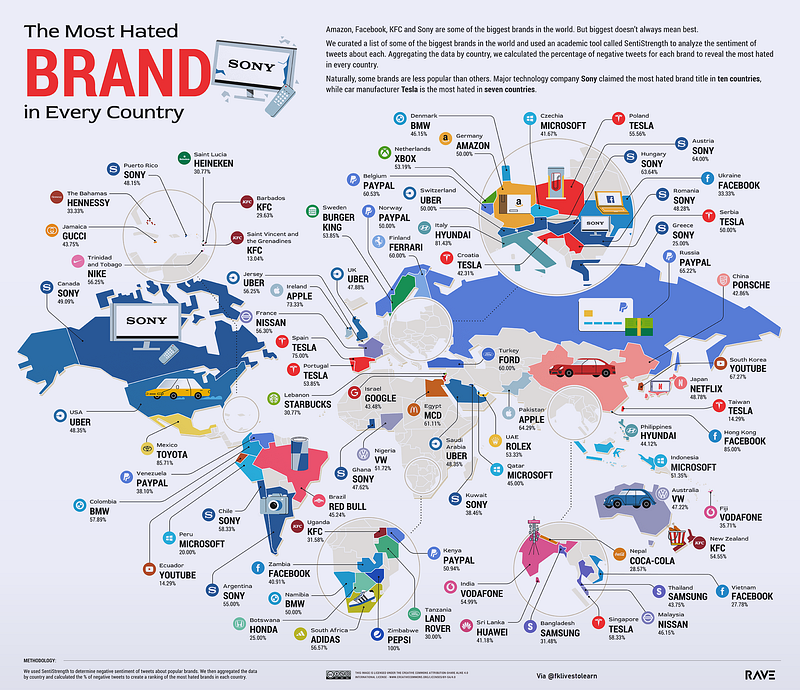
A new infographic (Figure 2) has revealed the most hated brands in every country. Examining over 1M tweets. Rave Reviews used the research tool SentiStrength to assess over a million brand-related tweets for positive or negative content. It seems the most hated brand in both the US and UK is Uber, while Tesla is the least popular brand in a whopping 7 countries. But what is the world’s most hated brand? According to this infographic, it’s Sony.
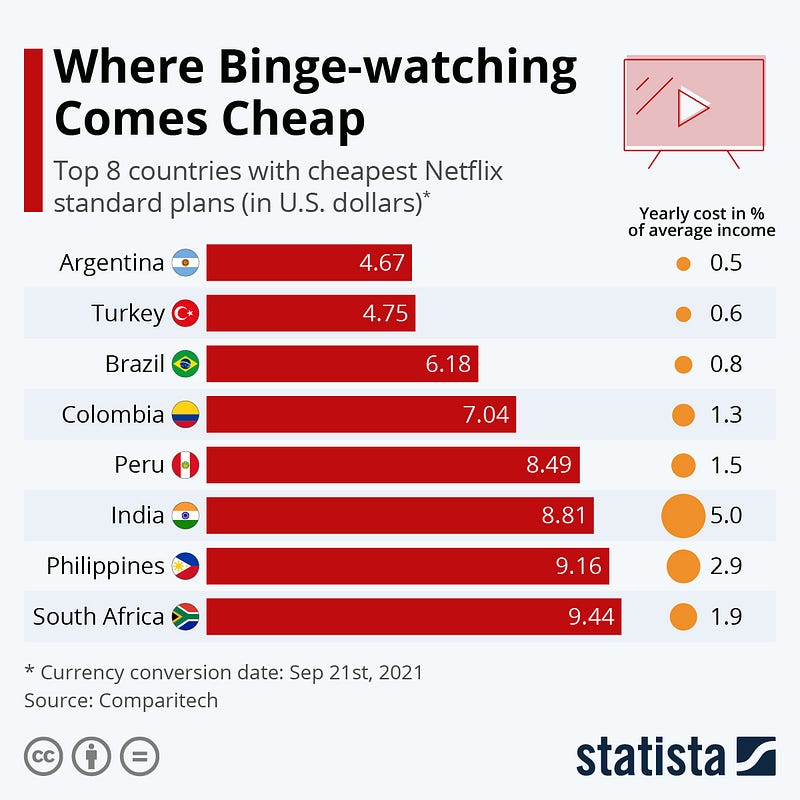
Cheapest NetFlix Around the Globe
Although the video streaming service Netflix is available in over 190 countries, many markets are still underdeveloped. To further push acceptance in African countries, the streaming giant recently announced a free version of its app for Android users in Kenya to test the waters there and branch out from oversaturated markets like the U.S. and Europe. The pricing model for the future full version remains unclear, though it will likely be in the realm of the countries featured in the chart below (Figure 3). When it comes to the cheapest Netflix standard plans, Argentina and Turkey are the most affordable in monthly fees as well as yearly costs in relation to the average resident’s income, coming in at just under five U.S. dollars. However, this figure can only serve as an approximate due to the wealth gap in the Asian country with 1% of the richest Indians accumulating 73% of the wealth generated in 2017.
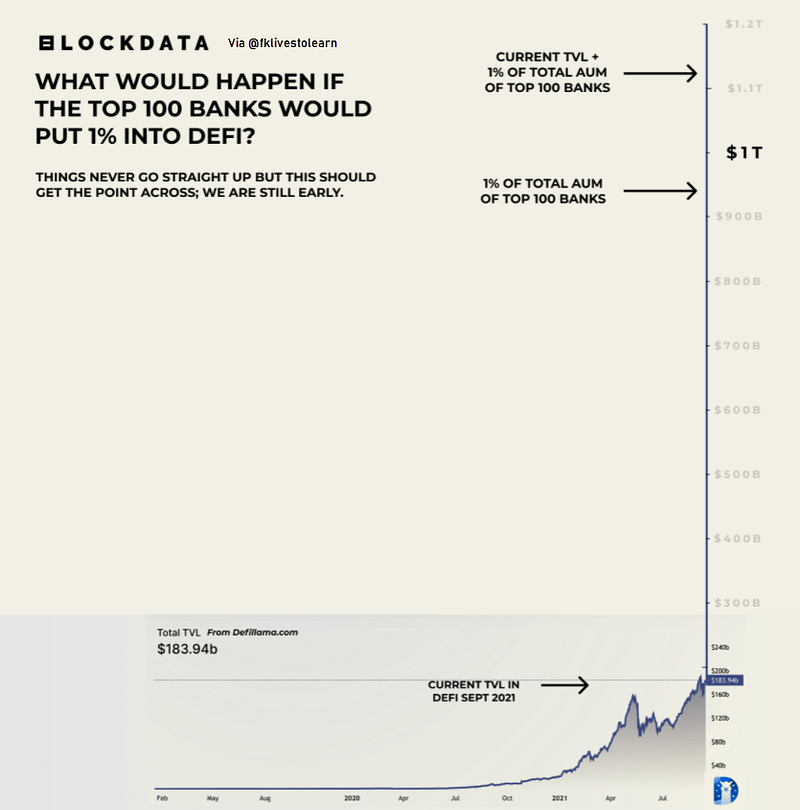
DeFi Rise if Top 100 Banks Invest 1%
Looking at the potential path for institutional DeFi, it is not beyond the realms of possibility that a cohort of banks, hedge funds, pensions funds and an array of other such funds would start experimenting in the space with some of their own assets. Currently, the TVL in DeFi is attempting to break the $200 billion mark thanks almost entirely to retail investors. But, if we theorize that the top 100 banks by AUM (Assets under Management) would consider investing with DeFi in the coming years, and invest as little as 1% into the space, we can see its impact on the graph below (Figure 4).
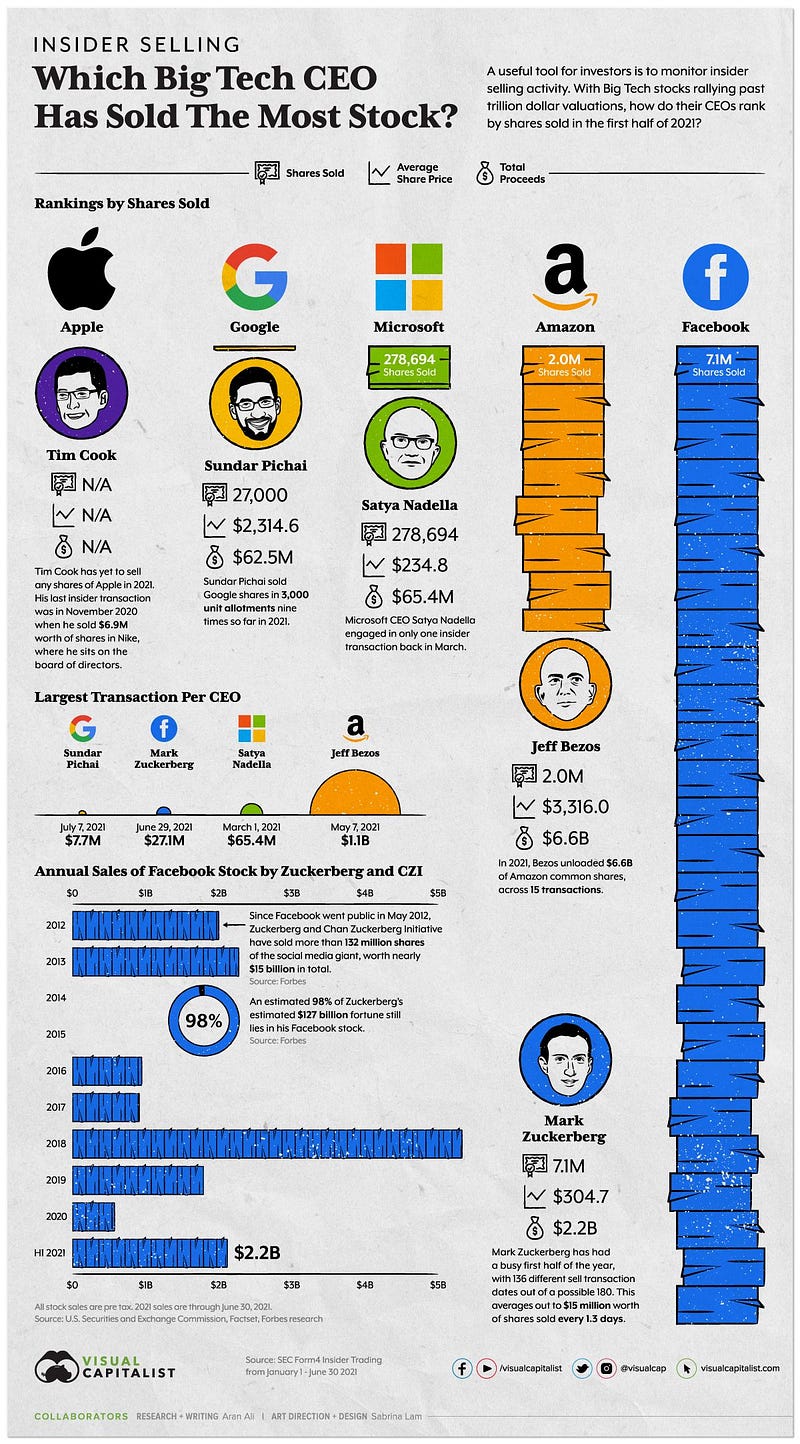
Most Active Big Tech Stock Seller CEO
When CEOs of major companies are selling their shares, investors can’t help but notice. After all, these decisions have a direct effect on the personal wealth of these insiders, which can say plenty about their convictions with respect to the future direction of the companies they run. Considering that Big Tech stocks are some of the most popular holdings in today’s portfolios, and are backed by a collective $5.3 trillion in institutional investment, how do the CEOs of these organizations rank by their insider selling (Figure 5)?
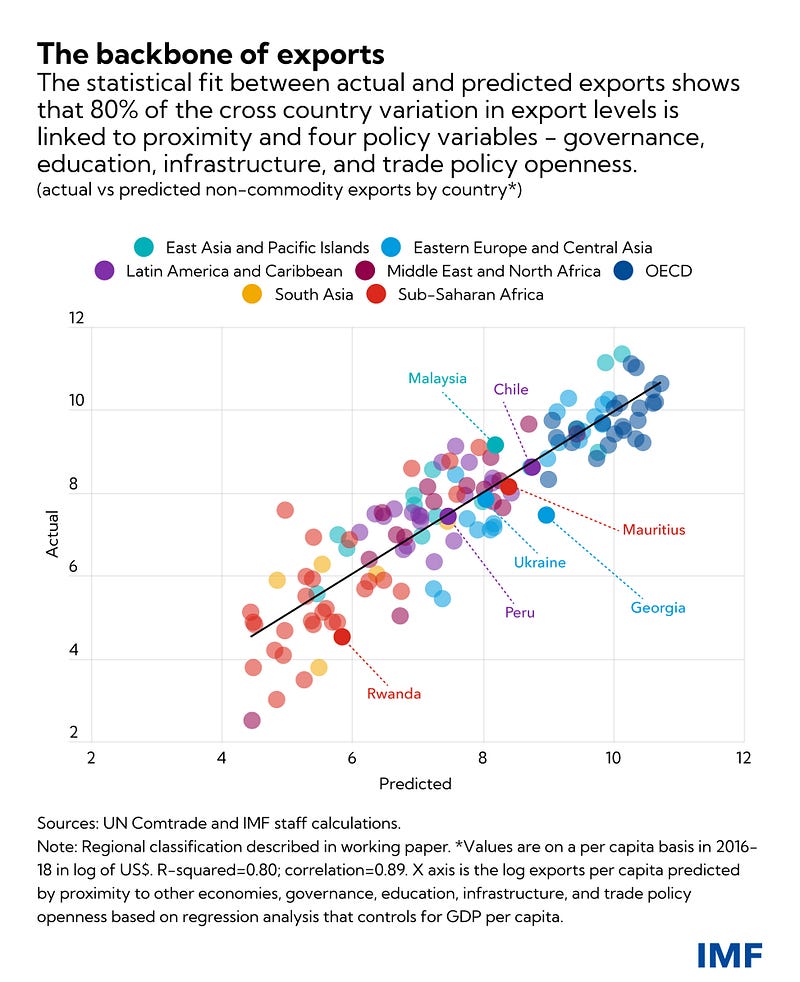
How Can Countries Diversify Exports?
The IMF methodology shows a clear link between the non-commodity exports that aid diversification and complexity and four economy-wide variables that help support them: governance, education, infrastructure, and open trade. Improving those areas helps to diversify by creating conditions that make it possible to boost complex or higher-value-added exports. This is significant because demonstrating how economy-wide policies do explain diversification challenges the belief that industrial policies, meant to support specific industries, offer the best way to broaden trade.
The analysis shows (Figure 6) that, except for abundant copper reserves, Chile’s economic profile, surprisingly, resembles Malaysia’s. The Asian nation has similarly strong education and institutions, but it benefits from being much closer to the major global supply-chain hubs of China, Japan & Korea. Prominent Asian and European exporters, from Hong Kong and Singapore to Ireland and Denmark, have among the most diverse and complex shipments and the strongest horizontal policies.
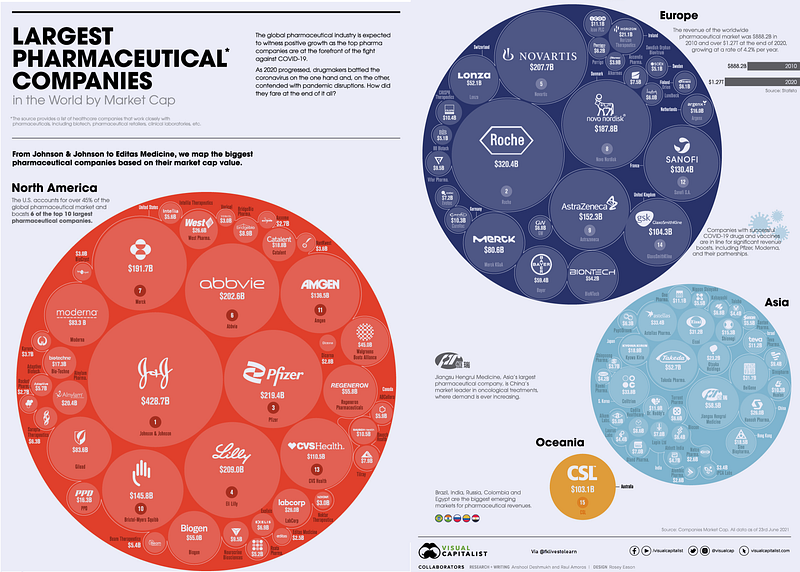
Largest Pharmaceutical Companies
Some of the world’s biggest pharmaceutical companies have played a central role in the COVID-19 pandemic. However, it’s likely no surprise that the pandemic has also been great for many healthcare businesses. In fact, in 2020 alone, the world’s 50 largest pharmaceutical companies still combined for a whopping $851 billion in revenues. In this visualization (Figure 7), using data from Companies Market Cap, VC lists the largest pharmaceutical companies in the world by market capitalization. It’s worth noting this list also includes healthcare companies that work closely with pharmaceuticals, including biotech, pharmaceutical retailers, clinical laboratories, etc.
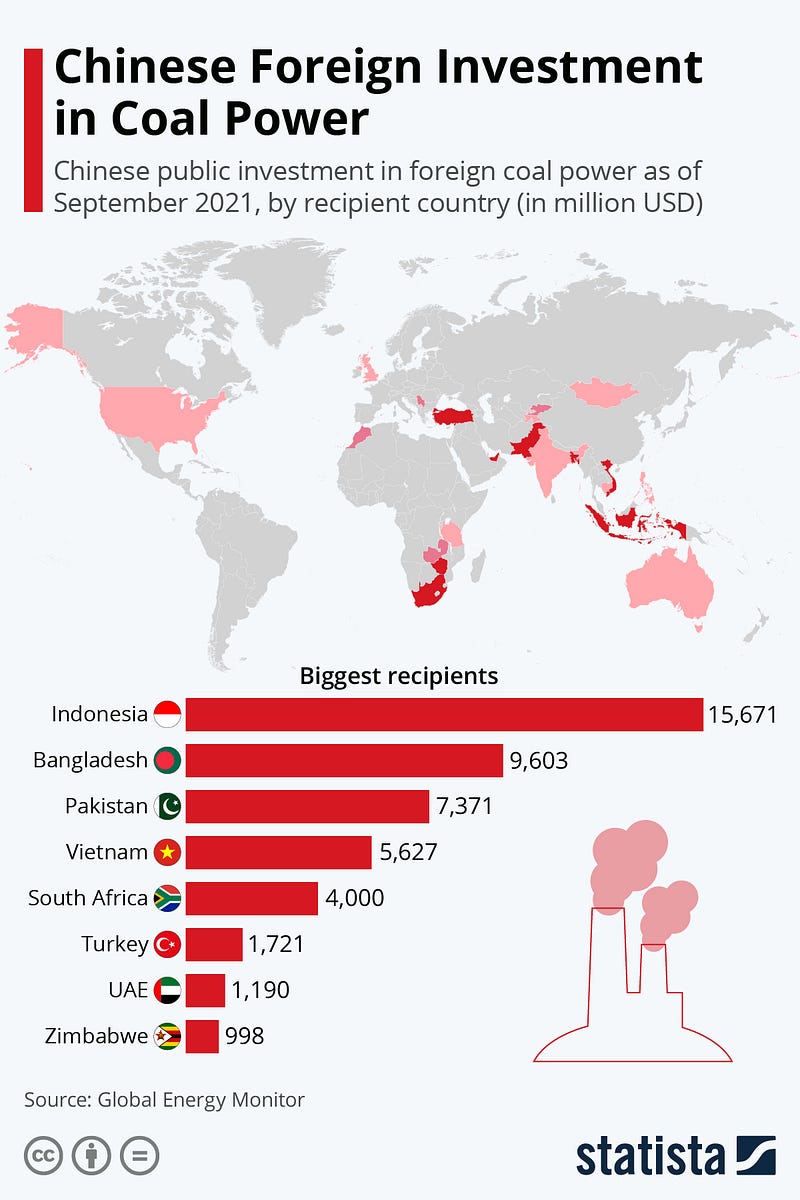
China’s Foreign Investment in Coal Power
China plans to cease its investment in foreign coal power plant projects as previously implemented largely under the banner of China’s Belt and Road Initiative. As this infographic using Global Energy Monitor (Figure 8) data shows, China has been especially active in Indonesia where $15,671M worth of coal power projects have been financed, equating to a total plant capacity of 9,724 megawatts. Investment hasn’t been limited to developing economies, however, with the UK’s Drax Coal Power Plant receiving $36m in financing from the Industrial and Commercial Bank of China in 2015, as well as the $200m refinancing of the United States’ Sandy Creek power plant in 2013.
Market Humor: Market Volatility Picks Up Amid Fed Tapering Plans, Debt Ceiling Deadlock, China Fears
Previous Edition of GBW
