WEEKLY BUSINESS ROUNDUP
Global Business Week: 15 Countries to sign the World’s biggest free trade deal
The state of Financial markets & Economies, Weekly Charts, Business Trends & Statistics
Even as the COVID-19 cases topped 150,000 per day in the U.S and accelerated at a frantic pace across the globe, the financial markets in the U.S saw some energetic buying to end the week on Friday — driving the DJIA and S&P 500 up nearly 1.4% and the Nasdaq higher by 1%. Seems like the encouraging vaccine news has lit up the stocks as investors put their money to work. It has been a strange year in so many ways and it seems it is going to end that way.
The Greenback rout continued as risk currencies made further inroads against the Greenback this week. With the medium-term trend firmly in place, the dollar index made another lower high as it poses to chart a new low. Further monetary easing by the Fed and passing of another stimulus package may reinforce this bearish trend.
Bitcoin stole the headlines again last week with its push over $16k, reaching as high as $16.5k before retreating a little. At the time of writing the premier digital asset is trending just below $16k. Macroeconomic instability, increasing institutional interest & a maturing digital asset market continues to drive the crypto bull market, led by Bitcoin.
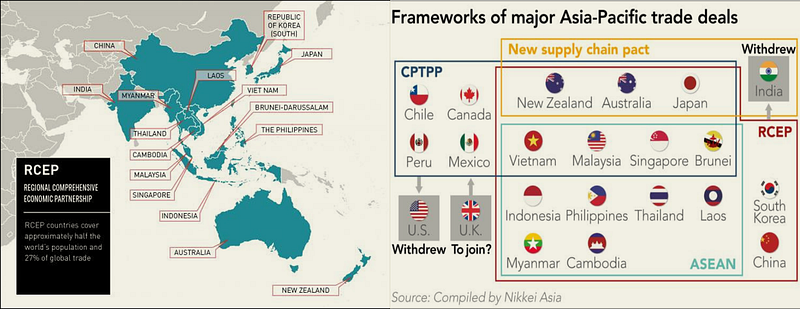
Today’s featured chart (above) comes from the world’s biggest free trade deal, signed by 15 countries over the weekend. These member nations have a combined GDP of $26.2 trillion. The treaty is known as the Regional Comprehensive Economic Partnership (RCEP) and took eight years of negotiations. It includes 10 members of the Association of Southeast Asian Nations (ASEAN), along with Australia, China, Japan, Korea, and New Zealand. These countries together account for about a third of both the world’s GDP and population.
India withdrew in November last year over fears of being flooded with cheap consumer goods from China, but it is being granted special permission to join whenever it chooses to under a clause. The trade agreement comes at a time when the U.S has increasingly moved towards isolationist trade policies — pulling out of a similar Trans-Pacific agreement.
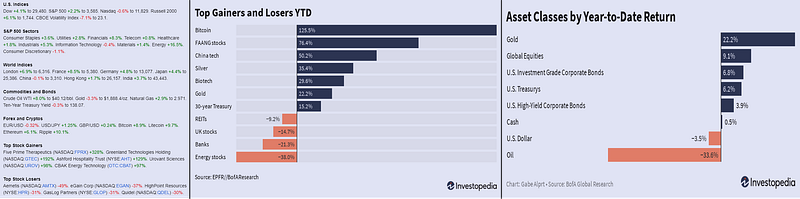
Here are some numbers for you to ponder (Figure 1 below) before we move on to some other statistics.
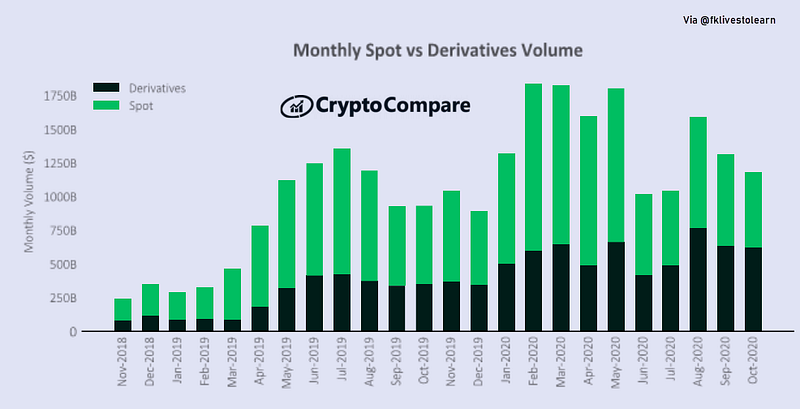
Crypto Trading Volumes
Trading volumes of digital assets have continued to gain traction in the past two years. Although the Derivatives volumes decreased by 2.4% in October to $619.9 billion and the total spot volumes decreased by 17.6% to $557.7 billion, the bigger picture portrays a healthy growth. The monthly trends indicate that the derivatives continue to take a bigger share of the total trading volume (Figure 2).
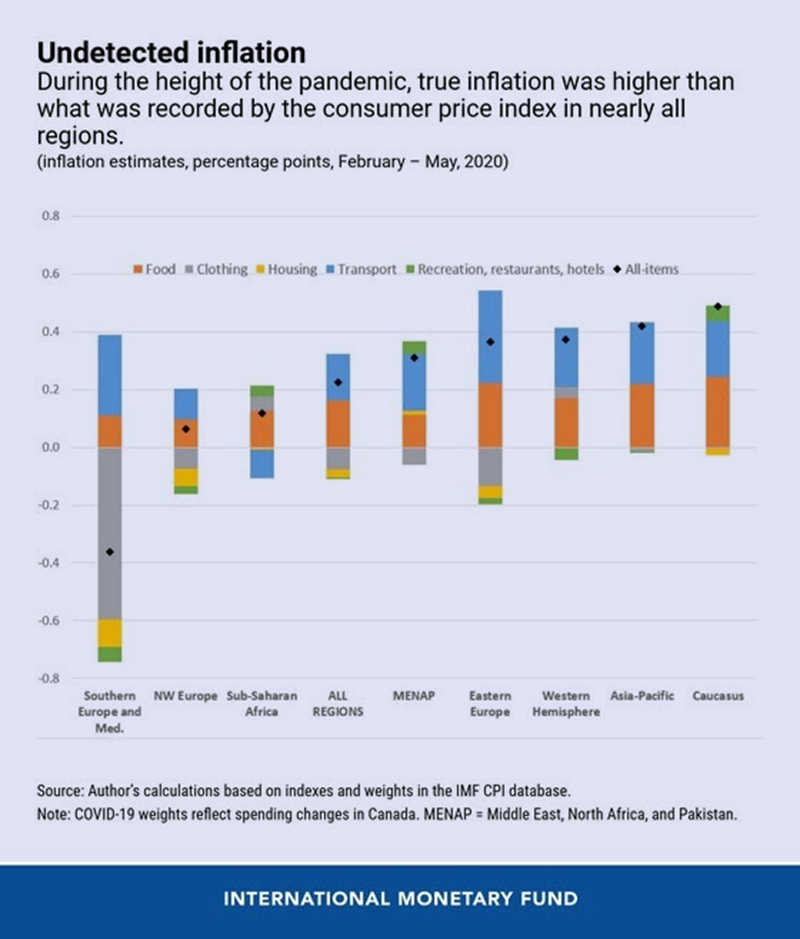
Undetected COVID-19 Inflation
The following chart (Figure 3) looks at the difference over the February–May timeframe between a COVID-19 price index that adjusts the CPI weights based on the impacts of COVID-19 on spending in Canada and an index with unchanged CPI weights. The diamonds in the chart show the difference between the two indexes by region. In seven of the eight regions shown, the CPI is below the COVID-19 index. Looking at the average for all regions combined, the gap is 0.23 percentage points.
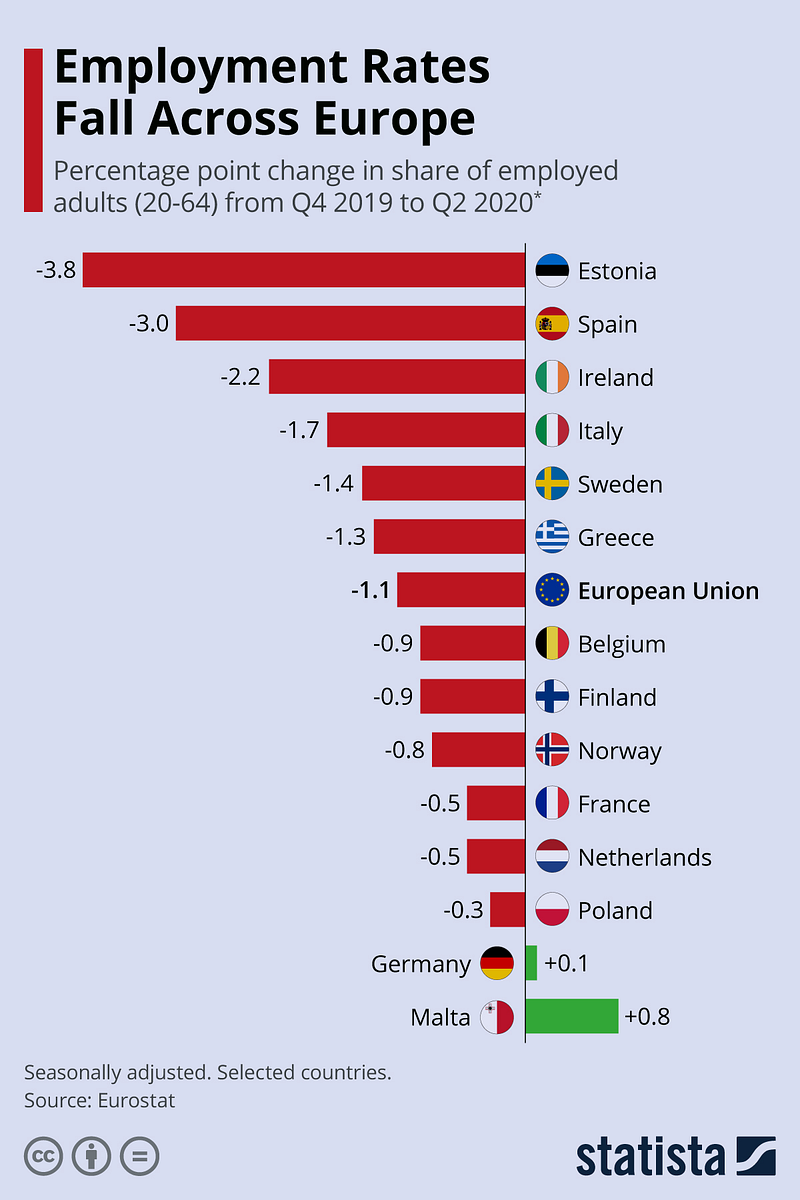
Employment Rates Fall Across Europe
Data released by Eurostat highlights the extent to which the coronavirus pandemic has affected the jobs across the European continent as of Q2 2020. As this infographic shows (Figure 4), Estonia is one of the hardest-hit countries in this regard — recording a fall of almost 4 percentage points compared to Q4 2019. Overall the European Union saw a drop of 1.1 points, with Germany and Malta bringing up the average slightly with the growth of 0.1 and 0.8 percentage points, respectively.
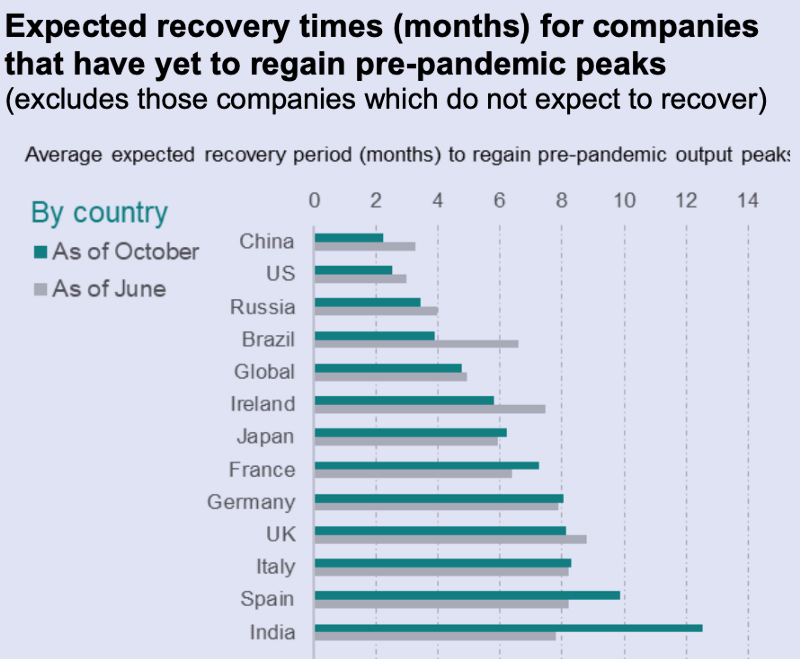
Fastest & Slowest Business Recoveries
According to a survey by IHS Markit with 6,653 companies in 12 countries, businesses in China and the U.S. anticipate the fastest recoveries from COVID-19. India reports the slowest recovery prospects, followed by Japan. (Figure 5) All countries became more upbeat about recovery progress since the prior survey conducted in June — with the exceptions of India, Spain & France. Sector-wise, hotels, restaurants and other consumer-facing services are anticipating the longest recoveries. Food, drink and vehicle makers are the most upbeat.
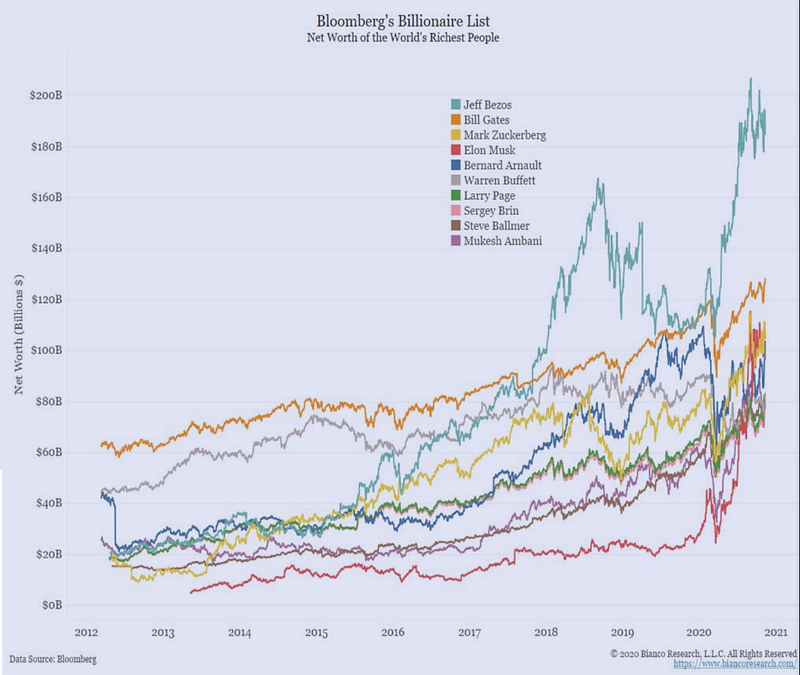
Billionaires get Richer in 2020
Not that there is ever a bad time for billionaires, 2020 has been especially kind to the high rollers as their fortunes skyrocket amid the pandemic. According to the Bloomberg Billionaires Index, five of the world’s billionaires are now worth over $100 billion each. Jeff Bezos leads the groups with $179 billion. He alone has added $64 billion to his account this year as Amazon has dominated amid the pandemic. The top 10 billionaires (Figure 6), except for Warren Buffett and Bernard Arnault, have all had a very good year.
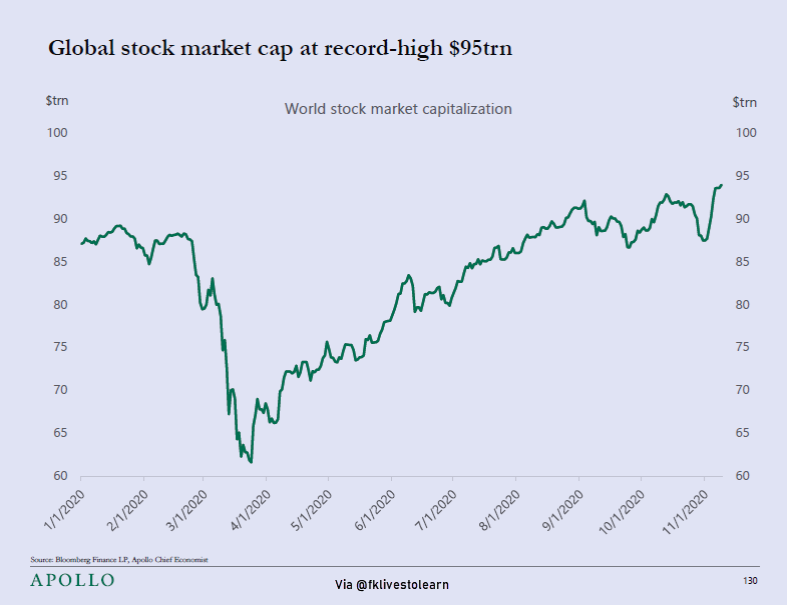
Global Stock Market Cap at a Record High
The global stock market’s value hit a record-high of $95 trillion this week, according to Torsten Slok at Apollo Global Management (Figure 7). This is despite a deadly pandemic that has already claimed more than 1.3 million lives, upturned most economies, and left governments with massive debts. You can say your thanks to the ultra easing measures by the central banks and massive stimulus packages by the respective governments.
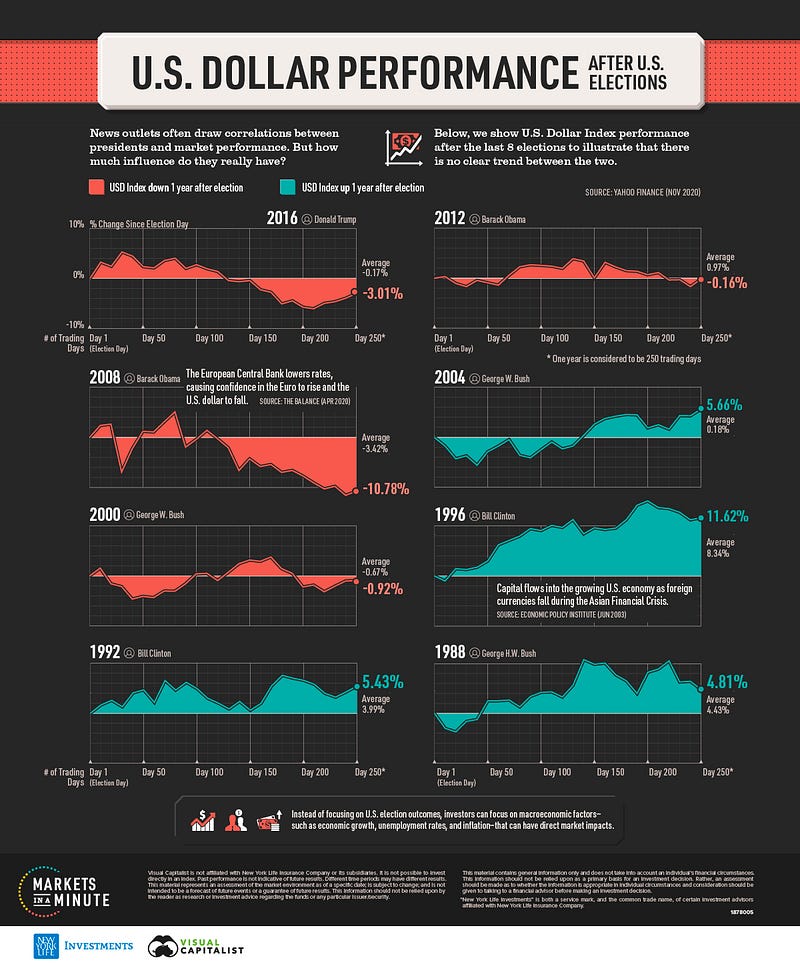
U.S. Dollar Performance After U.S. Elections
In this Markets in a Minute from New York Life Investments, you can see the U.S. dollar performance after the U.S. elections to illustrate that there is no clear trend between the two. For each U.S. election from 1988 to 2016, the U.S. dollar index’s percentage change was calculated since election day. Changes were then tracked over the course of a year or 250 trading days (Figure 8). As evident, there is no clear trend in U.S. dollar performance after U.S. elections.
Market Humor: The Vaccine Euphoria