
WEEKLY BUSINESS ROUNDUP
Global Business Week: 126 successful companies that started during a recession
The state of Financial markets & Economies, Weekly Charts, Business Trends & Statistics
As U.S markets closed slightly higher to end the week, investors are showing more signs of optimism — pouring $58.1 billion into equities for the week that just ended. This is in fact the largest weekly inflows into stocks in history, according to EPFR Global. Another record was created by the Tech stocks and ETFs that took in $5.4 billion. As S&P 500 posted nine all-time closing highs in the last six weeks, $10.6 billion came out of cash.
So far the major indices, The Dow the S&P 500, and the Nasdaq have gained 4.7%, 5.4%, and 7.1%, respectively in February. The S&P 500 has had nine record closes in 2021. The rally is pretty broad-based as Energy is up more than 12% month-to-date, while financials have climbed 8.4%, Russell 2000 is up 10% in 2021, while small caps continue to make record highs as well. The equity rally is not an American story only, rather it is a global phenomenon. The MSCI World Index has been positive for 10 straight days — its longest win streak since Jan. 2018.
Dollar Index’s rebound in recent weeks has been more consolidative — not being able to take out any medium-term technical levels. Net-short US Dollar futures positioning remains near its highest level since March 2011, helping feed the nascent narrative that a short-covering rally may soon emerge. If there is any financial asset that needs a short-covering rally, it is the Greenback. For now, the dollar index stays pinned in a bearish trend.
The cryptos rage ceases to subside as Bitcoin inspired rally continues to march forward. At the time I am writing this, the premier digital currency almost touched the hugely psychological level of $50k — missing it by a razor-thin margin. As BTC continues to get expensive for many small investors, the money has started to pour into Alt. coins, led by Ethereuem. This is evident from the BTC dominance which has just slipped below the significant 60% level. Still no signs of any significant correction, especially in Bitcoin. Constrained supply & peaking interest by the big investors is keeping BTC on the move.
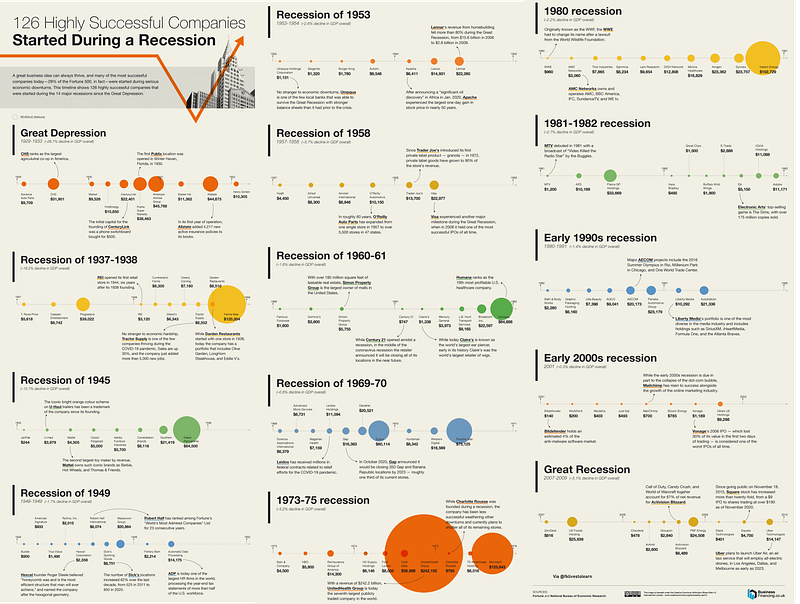
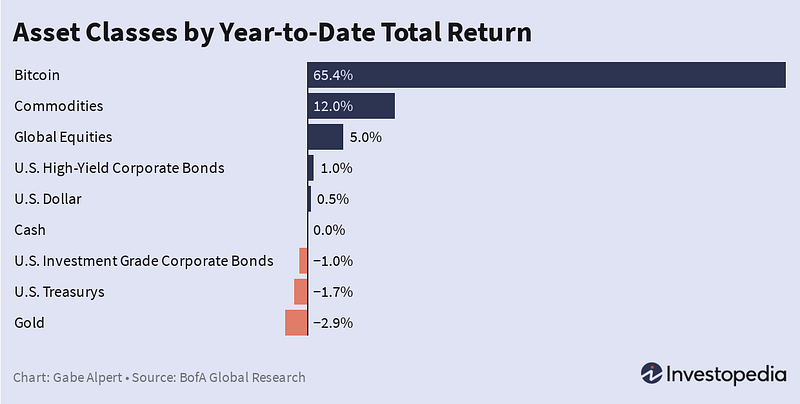
Today’s featured infographic (above) highlights how many successful business ideas emerge & develop in the most difficult times — the timeline above shows that 126 of the most successful companies were started during the worst economic downturns. These account for 29% of the current Fortune 500 companies. And as usual, here is the YTD total return of various asset classes (Figure 1), before moving on to some of the other interesting stats of the week.
2020 Stocks Recovery after the COVID-19 Outbreak
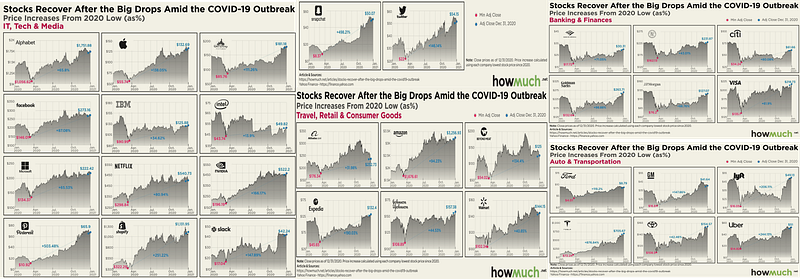
For the data compiled in this infographic by Howmuch.net, they first identified 32 well-known companies representing a cross-section of the economy, including tech, travel, retail, banking, and transportation. They then figured the lowest closing price in 2020 for each company according to Yahoo Finance. For the majority of the companies, prices bottomed around mid-to late-March. The overall difference from the low point until December 31, 2020, was then calculated by drawing a straight line with a percentage change called out (Figure 2). The result is a snapshot of a rapidly recovering and now expanding stock market, despite the enduring challenges of COVID-19 to the broader economy.
Global Stocks Outperforming U.S Equities
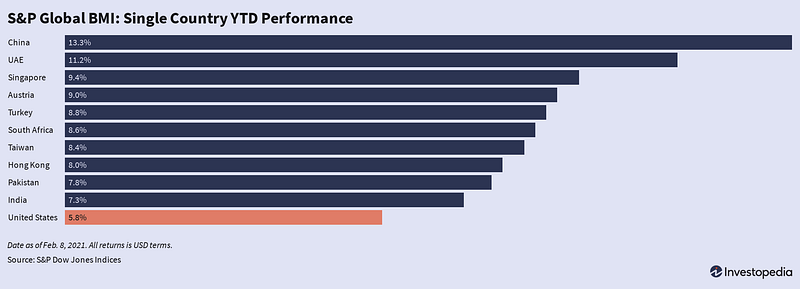
For all the hype about the U.S. stock market and all its record highs, it is by no means the best-performing country for equity returns in 2021. As discussed earlier, record amounts of money are being poured into Global stocks and countries of all sizes are posting gaudy returns so far this year. China leads the way with its Benchmark Index (BMI), posting a 13.3% return so far this year. The UAE is next, with an 11.2% return as the rise in oil prices is lifting the markets of petrostates. The U.S. has the 13th best returns of all countries, with a 5.8% return year-to-date, but it trails Egypt, Pakistan, and the Netherlands, among others. Colombia has the worst returns with a -8% drop so far (Figure 3).
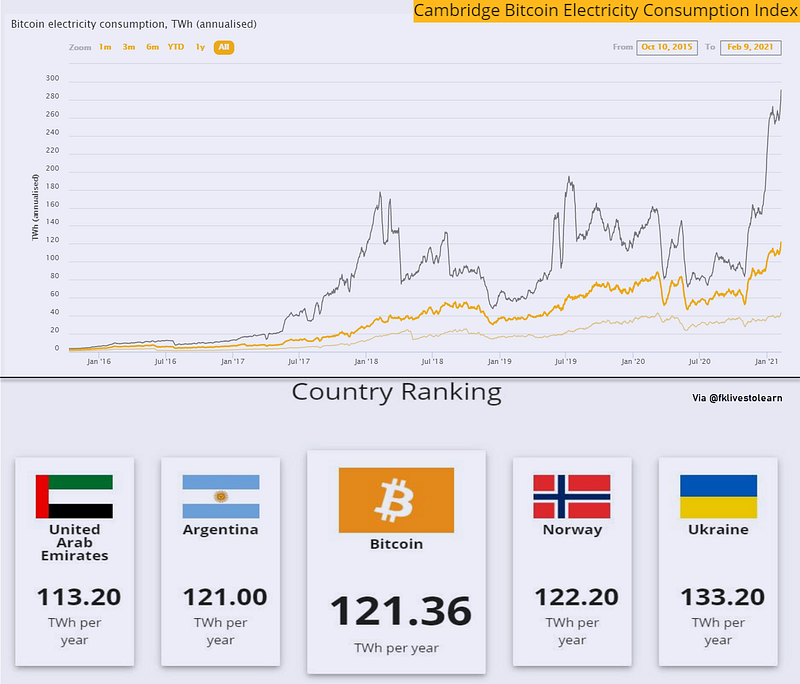
Bitcoin Electricity Consumption at its Highest Level
Bitcoin electricity consumption is the highest it has ever been at 121.36 TWh annualized, according to the University of Cambridge’s index. Mining activity for the cryptocurrency, which takes place largely in China, increases as the price rises — no wonder then that the level is so high right now. The power required by the network is more than what is used by whole countries, like the Netherlands or Argentina, in a year. As seen in the chart below (Figure 4) are estimated consumption, upper bound consumption, and lower bound consumption over time.
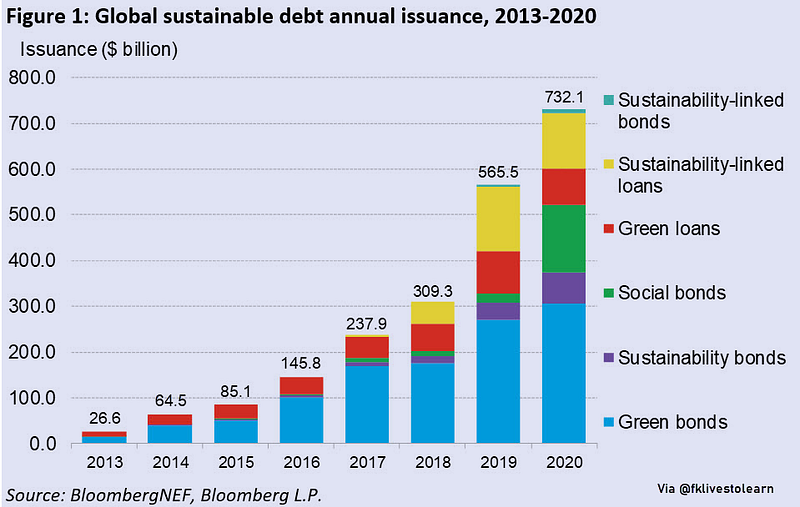
Global Sustainable Debt Issuance continues to Rise
Although the pandemic has taken center stage over the last year, it has exacerbated various inequalities and shone a spotlight on things like company redundancy and worker safety policies. Countries began planning job creation and economic recoveries with climate change goals in mind. All of this contributed to Environmental, Social, and Governance (ESG) awareness among investors. Advancements in ESG reporting, scoring, and standards are helping investors develop a better understanding of the risks related to these factors. This has led to a sharp rise in the global sustainable debt issuance over the years and 2020 was no exception (Figure 5).
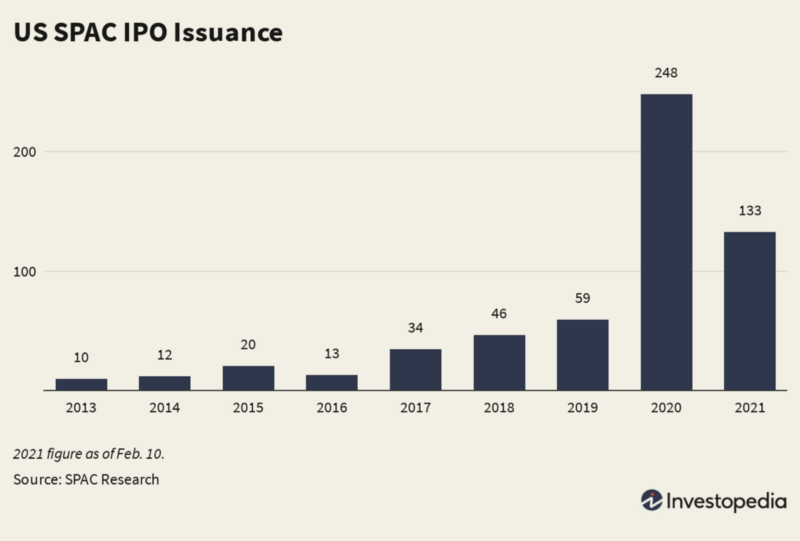
US SPAC Frenzy Gathers Pace in 2021
The SPAC frenzy continues to shoot up exponentially, after gaining momentum in 2020. News of Kaepernick’s SPAC comes as Shaquille O’Neal’s Forest Road Acquisition Corp. announced a merger with Beachbody Co. Group in a deal valuing the fitness-and-nutrition business at $3 billion. Meanwhile, former Yankees star Alex Rodriguez said in a regulatory filing that he is raising $500 million for a SPAC called Slam Corp. targeting a company in the “sports, media and entertainment, technology, and health and wellness industries.” As shown in the chart below (Figure 6), the first few weeks of 2021 alone have seen more than half of the SPAC issuance of 2020.
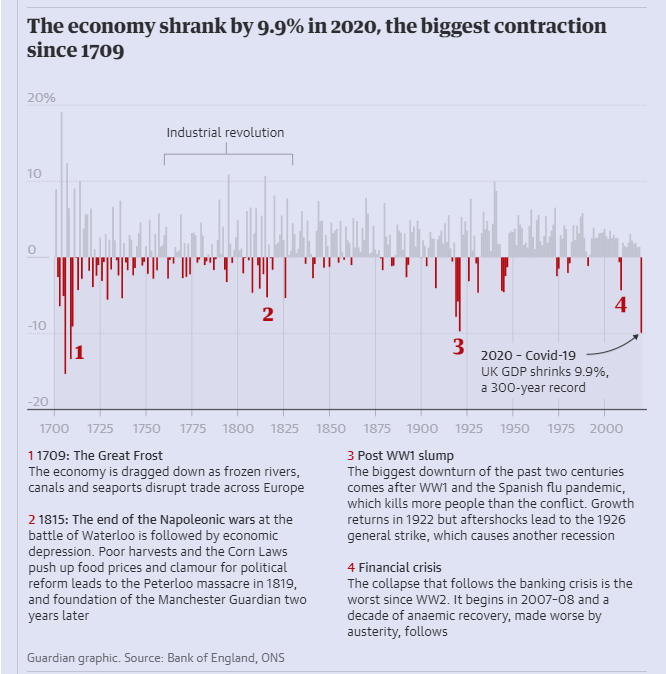
UK Economy sees the Biggest contraction since 1709
Although the U.K.’s GDP grew by 1%, according to the Office for National Statistics, the reimposed nationwide lockdown measures in a bid to combat a resurgence of Covid cases bid a bad blow to the economic recovery. The U.K. economy contracted by 9.9% in 2020, its largest annual contraction in more than 300 years — since the Great Frost of 1709 (Figure 7). The 9.9% annual contraction is more than twice that seen in the last global financial crisis of 2009, and narrowly worse than the 9.7% slump during the crisis of 1921.
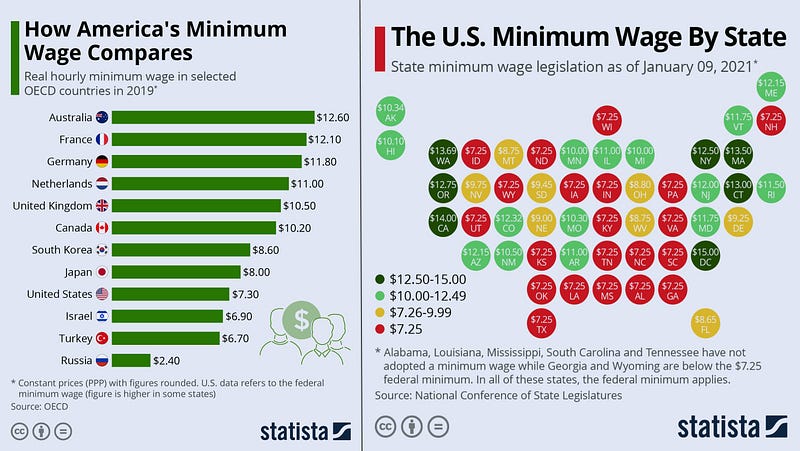
Comparing America’s Minimum Wage to OECD
The charts below (Figure 8) shows how the U.S’s minimum wage of $7.25 compares to some of the other OECD countries. It has to be mentioned that some U.S. states have moved to introduce even higher minimum wage thresholds with California and Washington notable examples where minimum hourly pay is higher than $13. According to the OECD data, the U.S. trails many developed countries in the minimum wage league such as Australia where the rate of pay was $12.60 in 2019 constant prices at purchasing power parity. While France and Germany are also ahead of the current U.S. federal minimum wage, more than doubling it to $15 per hour would catapult the U.S. to the very top of the OECD’s ranking. The logistics for such a bold financial move are still being worked on.
Previous Edition of GBW
