
Explainable AI (XAI) — A guide to 7 Packages in Python to Explain Your Models
An introduction to various frameworks and web apps to interpret and explain Machine Learning (ML) models in Python

Over the last few years, there has been significant progress on Explainable AI. The pursuit of converting these black box models into transparent and interpretable algorithms has gained traction in both the academic and business world. Many articles, publications and open source contributions have now made it easy to decrypt these complex models and turn them into white boxes especially for business users, managers and domain experts. Today’s analytics projects involving productionizing ML models have this explainable AI as a key component of delivery to support user requirements for understandability and transparency.
A While Back
Before methods such as SHAP and LIME became popular, the standard model explanations, with some interpretability (at a global-level), included methods such as Variable Importance (different methodologies based on the ML algorithms), Decision trees, Partial Dependence Plots (PDP), Individual Conditional Expectation plots (ICE) and Classical Regression Coefficients. It is nothing but a human need to understand how something works before we gain comfort and trust in it. The classic trade-off of higher model complexity leading to less interpretability is now being contained. These new methodologies apply approaches such as creation of replicating models, which mimic the behaviour of the original models at a local scale and help explain how a certain prediction was made.
New Era of XAI
While many packages/methodologies have developed in the recent years, this article aims to give a brief guide across some popular packages/ frameworks available in Python for XAI, covering their basic features and specifications. Code snippet examples and visualizations are also given below to provide a gist of the outputs. Note that these packages carry different dependencies and may create conflicts in the Python environment. It is recommended to set up different environments to run these codes and avoid version conflicts. Also note that I am not advocating for any of the packages here and some comments below are my personal opinion based on usage and experience. Multiple references and links to articles are provided under each section for further reading on these packages as this article only provides a introductory overview.
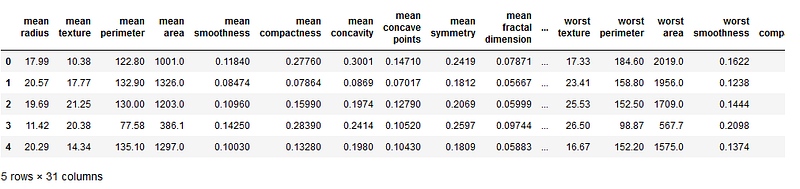
For this article, we are going to use the Breast Cancer dataset as an example to depict some of the outputs from various packages. In this dataset, features are computed from a digitized image of a Fine Needle Aspirate (FNA) of a breast mass. They describe characteristics of the cell nuclei present in the image. The task is a binary classification to predict.
Let’s get started!
First let’s set up the dataset.
Let’s build a basic Xgboost model which we will be using going forward across the various packages.

Now we begin our analysis to breakdown this model and make it transparent in its functioning.
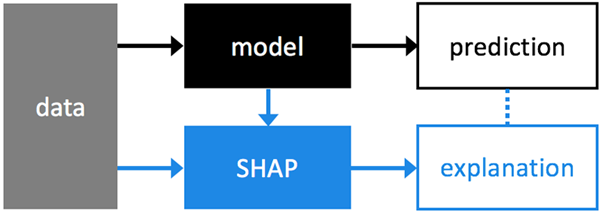
1. SHAP
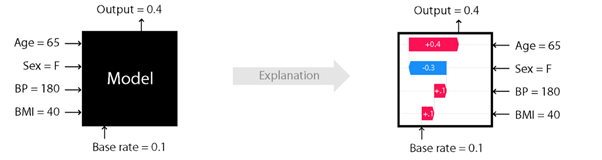
One of the most popular methods today, SHAP (SHapley Additive exPlanations) is a game theory based approach to explain the output of any ML model. It connects optimal credit allocation with local explanations using the classic Shapley values from game theory and their related extensions.
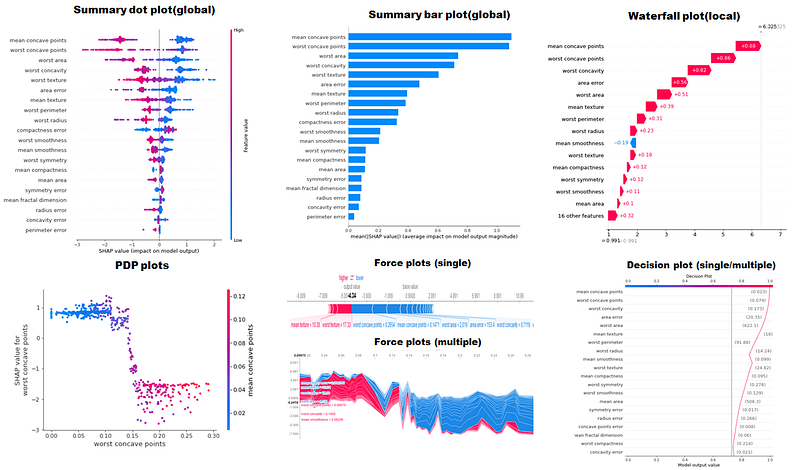
SHAP helps you understand the magnitude of impact (length of the bar) and direction(colour) below.
SHAP is a model agnostic framework. More details on the methodology can be found on their page and in papers such as the one by Lundberg and Lee . Another good article to understand the math with an example oriented explanation by Ula La Paris can be read here. This package which is now easily one of the most popular choices has evolved over the last few years with intuitive and engaging visualizations across various aspects of model explainability. Some visualizations are given below followed by the code to generate these.
This is a great starting point for data scientists. The creative aspects around using these values to generate more engaging visualizations and insights lies with the data scientist. An example would be the article below.
This package acts as a base for many dashboard and app based frameworks which are covered later in this article.
2. Lime
Lime was one of the first techniques to gain some popularity in the explainability domain. Lime stands for Local interpretable model agnostic explanations. The methodology behind Lime is covered in this paper. Currently, Lime helps explain predictions for tabular data, images and text classifiers.
Lime basically tries to give a local linear approximation of the model’s behaviour by creating local surrogate models which are trained to mimic the ML model’s predictions locally. While global importance shows an average effect across the whole data set, a local-level observation may be influenced in different ways from each variable. This surrogate model could be anything from GLMs to decision trees which try and understand how local importance may differ. The general framework as mentioned in interpretable-ml-book by Christoph Molnar is:
- Select your instance of interest for which you would like to have an explanation of its black box prediction
- Perturb your dataset and get the black box predictions for these new points
- Weight the new samples according to their proximity to the instance of interest
- Train a weighted, interpretable model on the dataset with the variations
- Explain the prediction by interpreting the local model
But there are certain limitations to Lime and it should be used with caution (refer to this article for more details). Interesting experimentation and further references are given in this article for individuals who want to deep-dive into Lime.
On our dataset we explain observation 79.
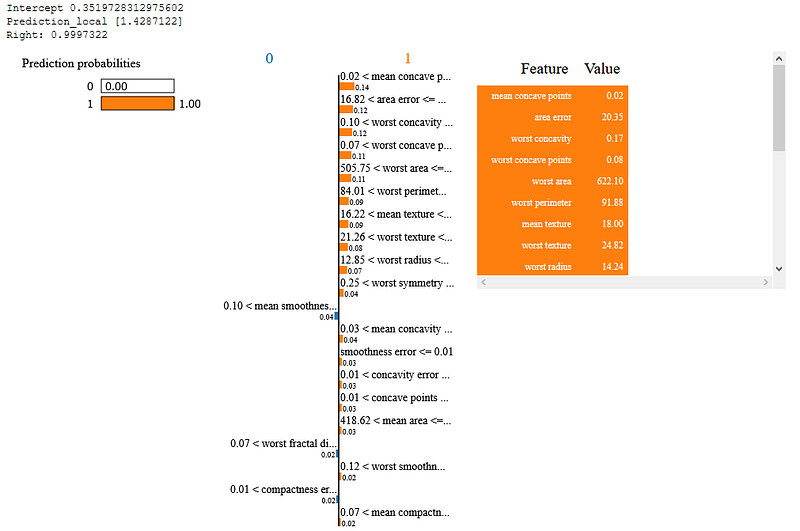
3. Shapash
Interactivity and engaging visuals are key to convey data stories, insights and model results. Compiling these into a notebook or a web app represents the ideal way forward on how business and data scientists/analysts should present and interact with AI/ML outcomes. Shapash takes a step in that direction. It is a Python library built by data scientists of a French insurer, MAIF. This package compiles various visualizations around SHAP/Lime explainability and publishes an easy to use interactive dashboard as a web app.
It uses Shap or Lime backend to compute contributions. Shapash relies on the different steps necessary to build a ML model to make the results understandable.
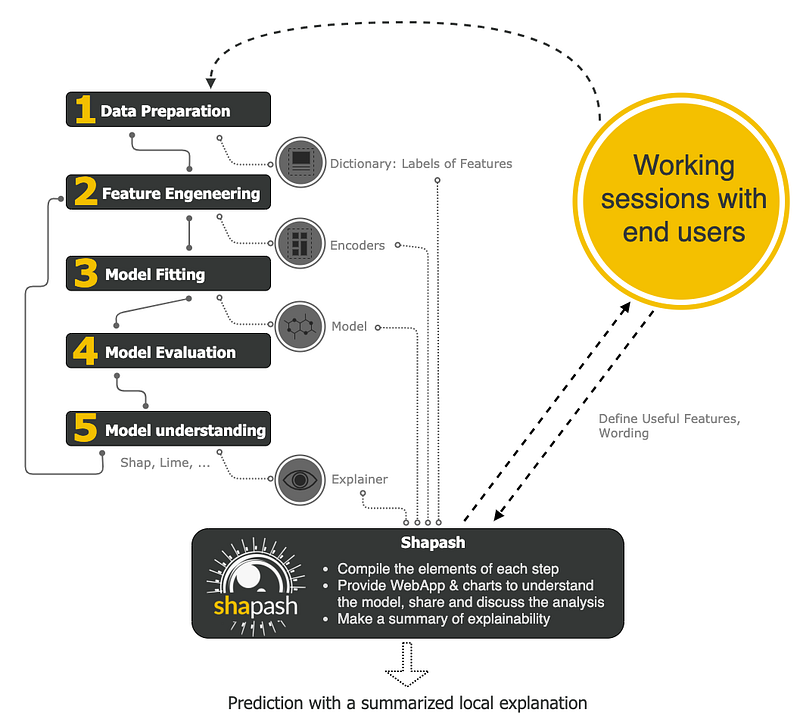
It works for regression, binary classification or multiclass problems and is compatible with many models: Catboost, Xgboost, LightGBM, Sklearn Ensemble, Linear models and SVM.
Some visualizations on our dataset and relevant code is shared below. We continue to use our Xgboost model as an example which is compatible with this package.
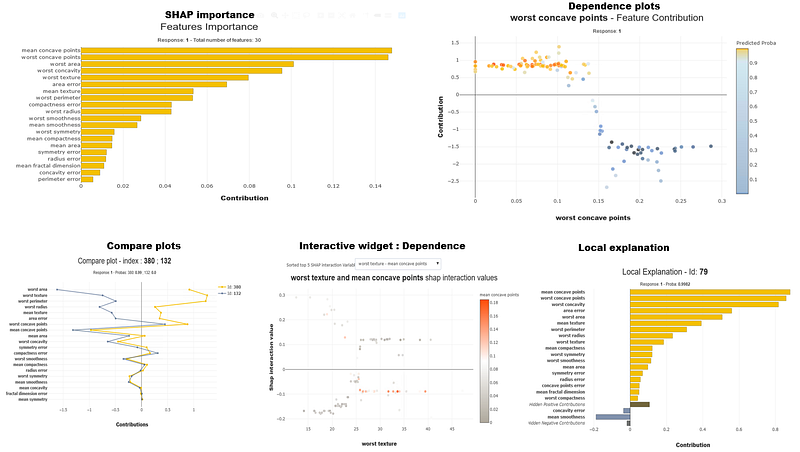
Shapash has recently also added report and documentation features to the package which is covered in more detail in this article. This package is gaining a lot of popularity and is covered across many Medium articles and YouTube videos.
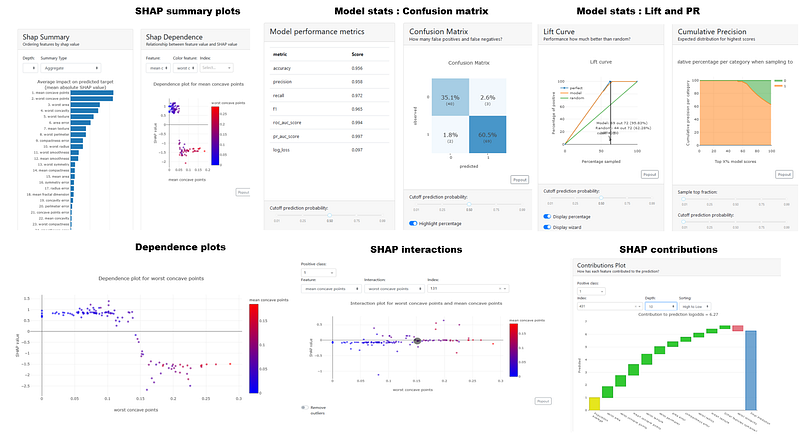
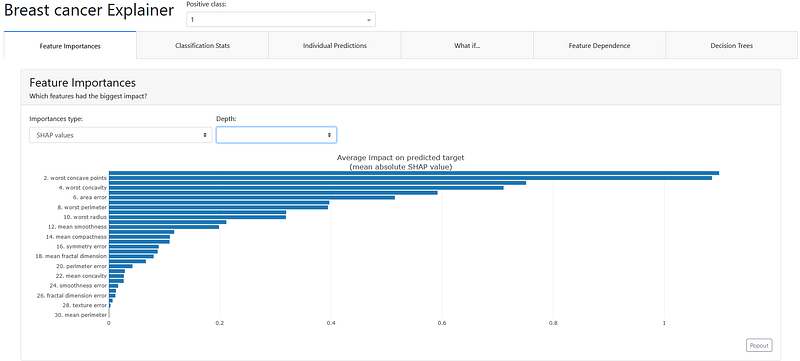
4. ExplainerDashboard
ExplainerDashboard built by Oege Dijk is a an extensive and engaging interactive dashboard library to explain ML models across various spectrums and methodologies. This is a lot more detailed compared to Shapash, i.e. not limited to just SHAP or Lime.
This dashboard covers various aspects of ML explainability such as :
- Feature importance
- Metrics and evaluation
- Local prediction explainability
- What if analysis
- Decision trees
- Feature dependencies
- Interactions
A Medium article by the author covers details on the package and various outputs.
There is also a PyData GLobal 2020 talk by the author.
While this package has many visualizations and outputs. This dashboard can get a bit overwhelming with the various components however it is modular and allows great flexibility and customization on creating your own preferred version of the dashboard. There are also inline explainers to look at individual components. Some examples of visuals are given below followed by the code.
You can create the pre-built dashboard with one line of code below. You can toggle and switch on/off various tabs as required.
A more detailed guide on this package can be found in this Medium article by Ravi.
5. Dalex
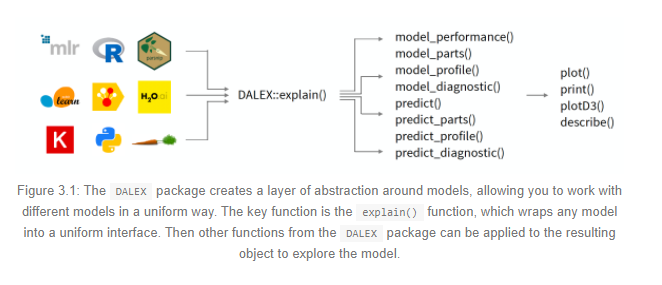
Part of DrWhy.AI, Dalex is a popular library which providers wrappers around various ML frameworks. These wrappers can then be explored and compared with a collection of local and global explainers.
This ebook explains the philosophy and methodology details of Dalex. It covers various aspects of model explainability as shown in the image below.
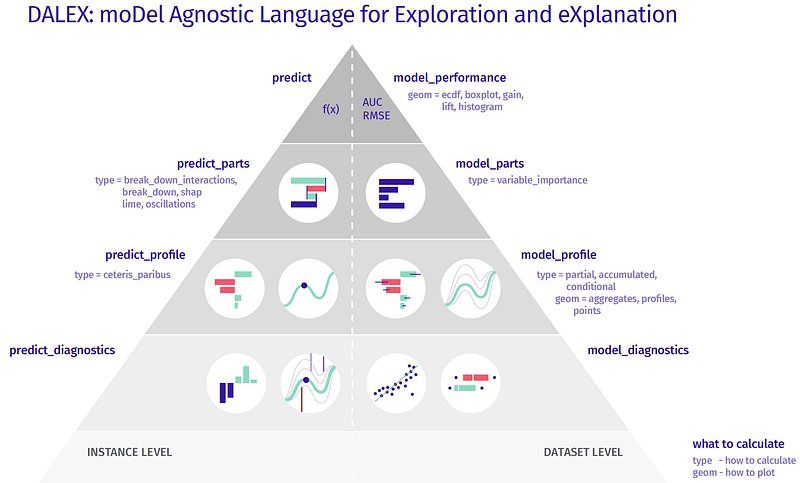
The package available both in Python and R covers variable importance, PDP & ALE plots, Breakdown & SHAP waterfall plots. It also contains a neat wrapper around the native SHAP package in Python. This package works with various ML frameworks such as scikit-learn, keras, H2O, tidymodels, xgboost, mlr or mlr3.
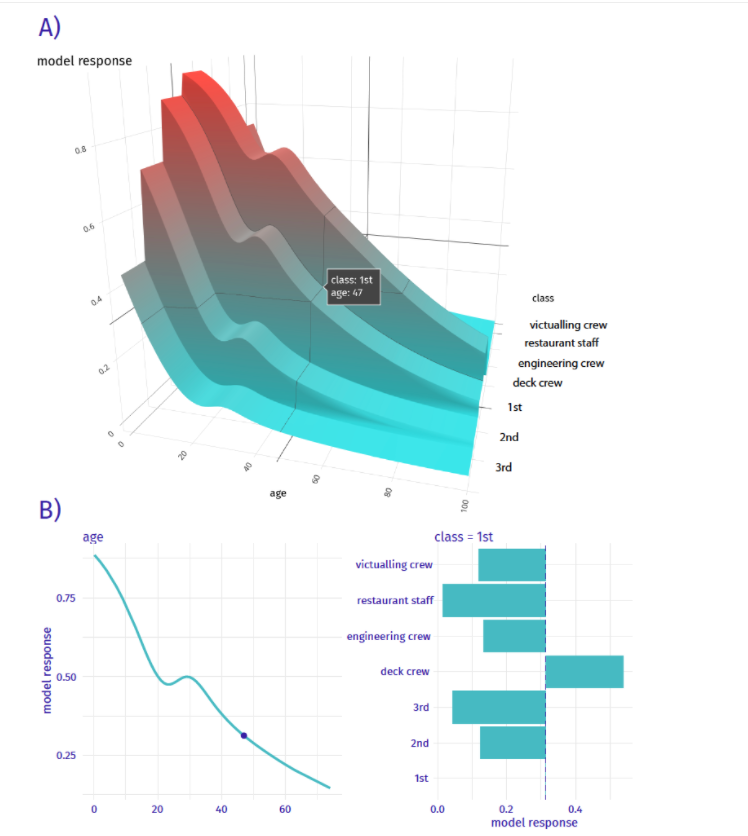
Covered in the e-book, the breakdown and live methodology is further explained in this paper is unique to this package. This is different from usual SHAP and Lime methods. This package is one of the few which also has a fairness module. An example notebook can be found here. Some modules such as Ceteris paribus have some engaging visuals such as the one below.
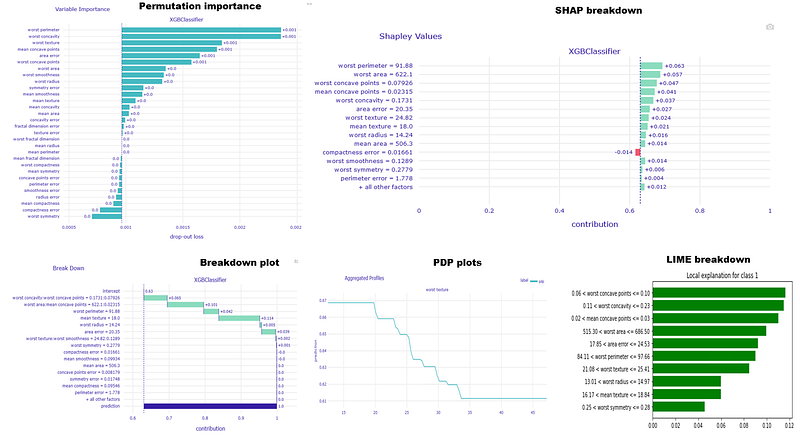
Utilizing this package on our data set, we generate a few visuals with code snippets given below.
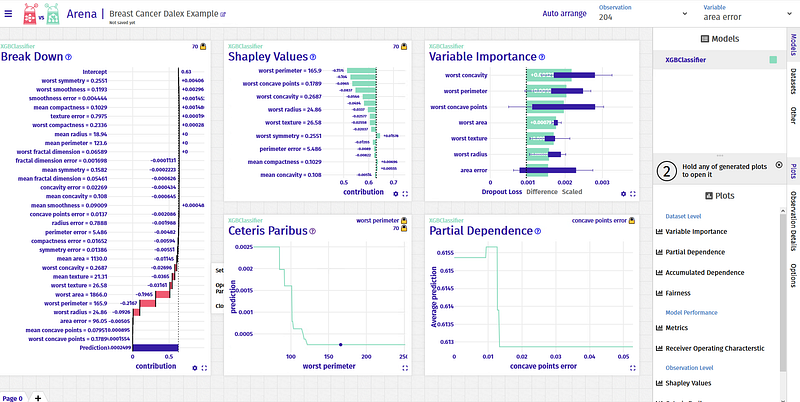
All plots are interactive, have a neat integration with Plotly and can be saved easily. Dalex doesn’t get left behind in the dashboard space either. Arena is Dalex’s interactive drag and drop dashboard. The visuals are quite good and the interface is neat. A snapshot below from our dataset gives you a glimpse of the dashboard. Code snippet is just a few lines and is given below.
6. Explainable Boosting Machines (EBM)
This is the new kid on the block. Created by Interpret ML, Interpret is an open source package from Microsoft that has a module of “glass-box” models which enable explainability. This doesn’t imply a loss in performance as EBMs are shown in a few datasets to perform at par with other boosting methods.
Based on the idea of additive models, this approach changes the training process from training a decision tree on all features to a decision tree with one feature at a time. Multiple trees are constructed per feature with small depth and in boosting fashion. Based on the summation of all its trees, we can estimate the function (f) of the input variable with the output variable. There are some good videos by the authors here . The paper can also be accessed here. Contribution of each feature to a final prediction can be understood by its f . Since EBM is an additive model, each feature contributes to predictions in a modular way that makes it easy to reason about the contribution of each feature to the prediction.
The code architecture is quite simplistic. The below image from the official paper gives a glimpse.
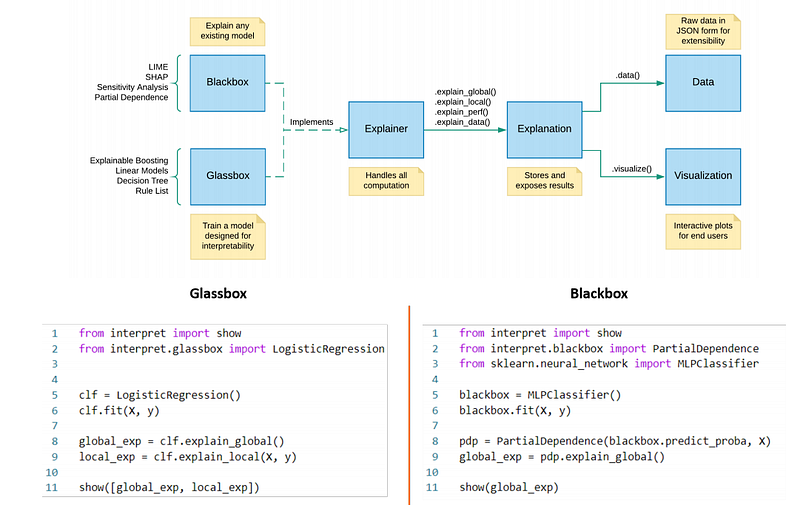
Apart from the glass box models, one can also use the usual SHAP, Lime, PDP and sensitivity components of the package. This is also compatible with scikit-learn . This Medium article gives a good example of using this package for SVM and Xgboost. This package also allows you to compile various interactive widgets into a neat dashboard. Many examples are there in their github page. However I found the package still in its early stages and limited in terms of general things for example, model metrics, etc. The visualizations also aren’t as engaging relative to the other packages. The methodology however holds promise with comparable performance.
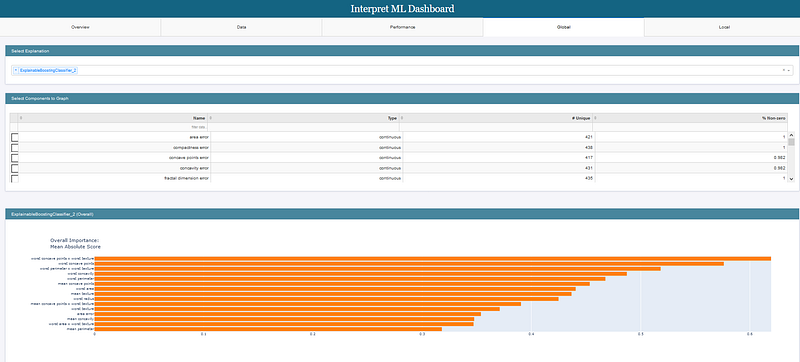
On our dataset, some visualizations and codes are given below.
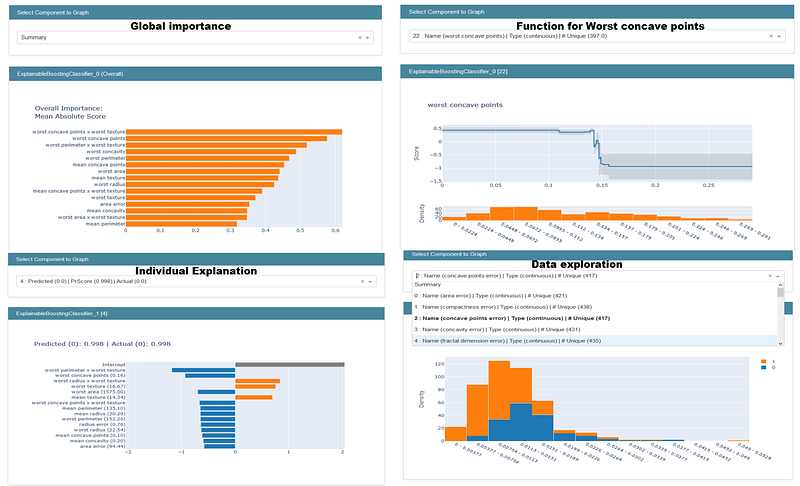
This can all be packaged into a dashboard as well.
7. ELI5
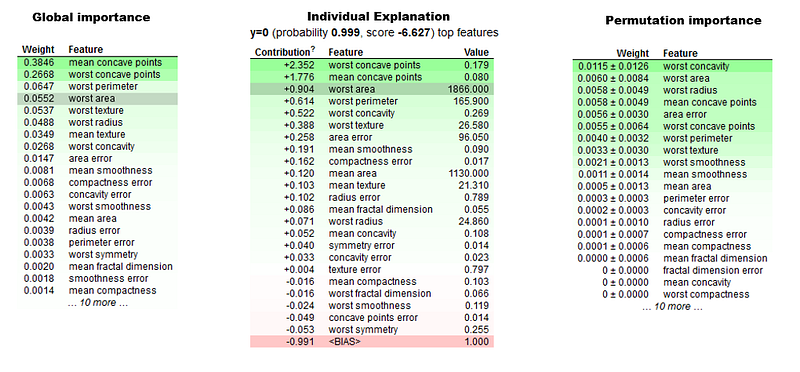
ELI5 is yet another explainability package by MIT supporting ML frameworks and packages such as Scikit-learn, Keras, Xgboost, etc. With a unified API, comparing models here becomes easier across packages and frameworks. There are many other components such as Text-explainer for which it uses Lime algorithm and permutation importance. This package neatly categorizes the explanation into two parts :
- Global which is
show_weights()in which you can provide required parameters to specify type of global importance you wish to see (e.g. ‘gain’, ’weight’, ‘gain’, ‘cover’, ‘total_gain’, ‘total_cover’) - Local level explanations are given by
eli5.show_prediction()which explain the local level predictions
Other functions such as eli5.formatterscan be used to get HTML,text,JSON or PIL image, etc. representation of the explanation.
There are no engaging visuals that I could spot in this package. It’s mostly the unified platform across various ML packages/frameworks that is its main highlight. Some outputs are given below with code snippets.
8. That is not all!
While this article covers the most popular options out there to make your model transparent and explainable, there are other packages which can be explored further such as Alibi covering some different methods such as Anchors. Skater is yet another package which started off as a fork of LIME but then broke out as an independent framework. There are other interesting projects worth exploring such as EhticalML , Aix360 by IBM, Diverse Counterfactual Explanations (DiCE) for ML, which comes from interpret ML that we covered above for EBMs, ExplainX.Ai, etc. For R enthusiasts out there, a similar curated list of packages on XAI can be found in the article Landscape of R packages for eXplainable Artificial Intelligence.
Conclusion
This field of study & open source contributions are evolving at a rapid pace which is in line with how essential it is to explain, debug and validate our model decisions especially when there is an upward trajectory of actual AI model deployments and how influential these algorithms are becoming in our day to day lives. The above packages are just a starting point and something to leverage and build upon further for data scientists, engineers and analysts. This will boost the trust in AI based solutions which will in turn speed up its adoption.
References :
[1] https://towardsdatascience.com/tagged/xai
[2] https://towardsdatascience.com/unboxing-the-black-box-using-lime-5c9756366faf
[3] https://www.kdnuggets.com/2021/04/shapash-machine-learning-models-understandable.html
[5] https://pypi.org/project/explainerdashboard/
[6] https://readmedium.com/making-ml-transparent-and-explainable-with-explainerdashboard-49953ae743dd
[8] https://dalex.drwhy.ai/python-dalex-xgboost.html
[9] https://uc-r.github.io/dalex
[10] https://towardsdatascience.com/decrypting-your-machine-learning-model-using-lime-5adc035109b5
[11] https://towardsdatascience.com/explaining-machine-learning-classifiers-with-lime-def5adaacfea
[12] https://towardsdatascience.com/whats-wrong-with-lime-86b335f34612
[13] https://towardsdatascience.com/the-explainable-boosting-machine-f24152509ebb
[14] https://towardsdatascience.com/interpretml-analysis-of-svm-and-xgboost-models-e68062f7299f
[15] https://www.analyticsvidhya.com/blog/2020/11/demystifying-model-interpretation-using-eli5/
[16] https://eli5.readthedocs.io/en/latest/overview.html#features
[17] https://readmedium.com/why-should-i-trust-your-model-bdda6be94c6f
[19] https://awesomeopensource.com/projects/xai?categoryPage=7


