
Evidently — Monitor Machine Learning Systems
This article is about monitoring machine learning models and Evidently which is an open source python module that targets ML engineers and data scientists.
The development of a model is not an easy task but can be done quickly especially if the problem is simple. In a real-world situation, the idea behind using machine learning is to create value and enable the company using it to grow. The value doesn’t necessarily have to be delivered by the model but the idea is that through machine learning and data science, the products or services offered by the company should benefit.
Let’s take the well-known example of the mobility company as a service Uber. Machine Learning models are used, among other things, to estimate the travel time from one location to another. Uber does not directly derive any value from this model, but it does provide a better experience for the customer and thus gives them a good impression.
Once the models are in production, it becomes a priority to ensure that there are no problems that hinder their performance and proper functioning. This is where monitoring comes in. This is another process that belongs to MLOps and allows machine learning pipelines to operate in a more secure environment.
Monitoring can be considered the last piece of the puzzle in the machine learning life cycle, but it is the one that monitors all the others. I described a bit of ML pipelines in my article about Prefect and Workflow Orchestration if you are interested.
What are the risks of letting a model run by itself ?
- The first one concerns the deployment of the model and the way predictions are made. As in the development of any product or service, deployment must be maintained and accounted for because it is the piece that holds everything together. If the REST API service that supports the model is not responding, even if the model is perfect (which is never the case), the clients themselves will no longer have access to it. Without monitoring, the time spent troubleshooting the problem will increase because there will be no alerts in place. A lot of different metrics can be used to be aware of how the deployment is going.
- The second risk is from the data. It is important to know that data is the backbone of a good model. With good data, well structured and understood, the model will perform well. However, good training data is one thing, but when the model actually produces results, the input data or new training data can change and create complete chaos. As you know, models use inputs to make predictions. What happens if an input is no longer available? The model will not be able to predict anything because one of the features it uses is missing. This is one of many examples of bad data. Checking the data is called Data Validation.
- The third risk is about the model itself and better known as Model Drift. This issue can be divided in 2 types : Data Drift and Concept Drift. The first one corresponds to the appearance of completely new input data in the model. Thus, these new data cannot be understood by the system and the predictions are of poor quality. Concept Drift is slightly different because it is not new data but new relationships between the features and the target. For example, the onset of the pandemic had caused many models to drift, such as one that predicted real estate prices. Indeed, the relationship between the features and the price of houses changes radically and the model could not anticipate this (the story of Zillow is an example). Like the two previous risks, using metrics is the best way to get alerted from drifting.
Now that we see the importance of monitoring, let’s look at Evidently and how it makes it really helpful.
Create Dashboards with Evidently
As I said before, Evidently is a Python library for monitoring Machine Learning Systems. It uses pandas dataframes with all the necessary data inside as the inputs and returns a dashboard according to the report objects with which it has been initialized.
Report objects are composed of charts/tables created with the dataframes imputed in the dashboard and representing different types of monitoring. A dashboard can have multiple reports.
Here is the reports included in Evidently :
- Data Drift Report : measures features drifting with various metrics and statistical tests.
- Data Quality Report : measures data itself, distribution, statistics and more. It becomes useful when the reference dataset and the actual one is compared, that performs data validation.
- Numerical and Categorical Target Drift Report : depending on the target type, it reports the difference between training target and production target. It uses also metrics and statistical tests to detect drift.
- Performance Reports (Regression, Classification or Probabilistic Classification) : they measure how well a model is performing by looking at predictions (in comparison with actual targets). Those reports has the ability to compare two models (the reference one and the one in production) and express a potential Model Drift.
Let’s see how a report looks like in an Evidently dashboard.
I used Scikit Learn Boston dataset to perform the following examples. First of all, I created a dashboard composed of a data drift report and a target drift report. It is important to know that the data used to build reports are necessarily dataframes with only numerical columns. However, categorical columns can be encoded as numerical and specified in what Evidently calls, column mapping.
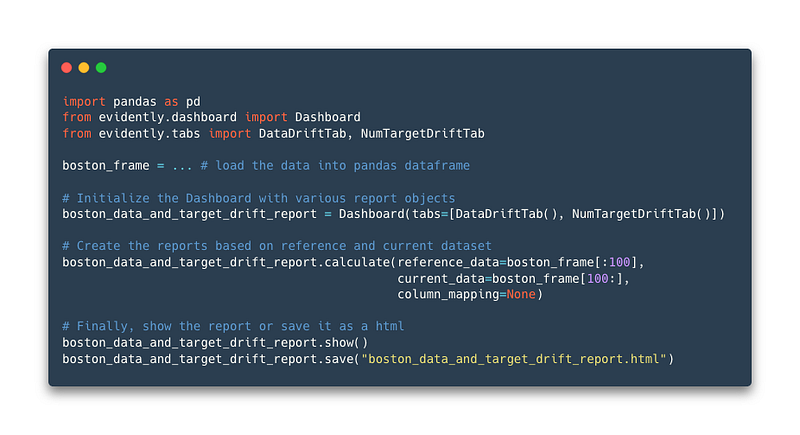
As you can see in the Dashboard, I referenced 2 types of report. For the example, I divided the dataframe to simulate a reference and a current dataset.
Here is what the dashboard looks like :
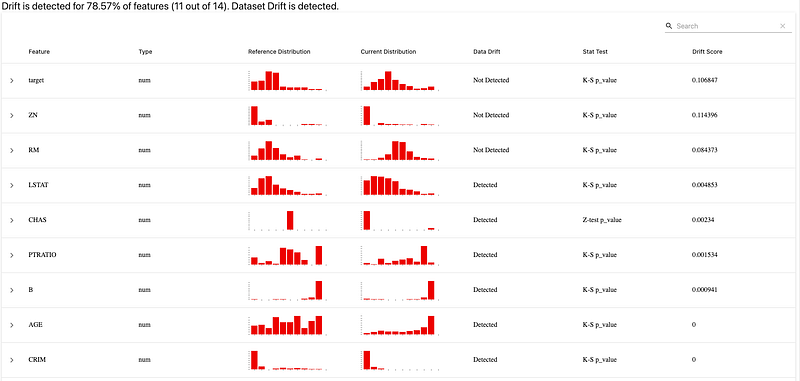
This is the part about data drifting :
And this is an example of what target drifting report is displaying :
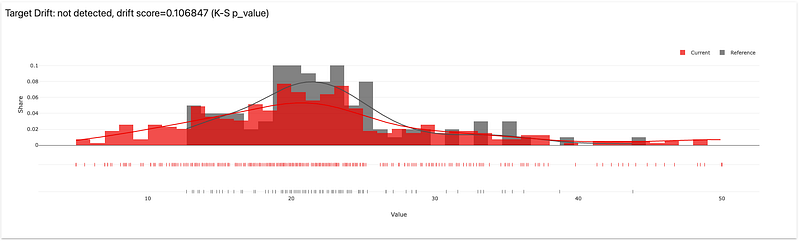
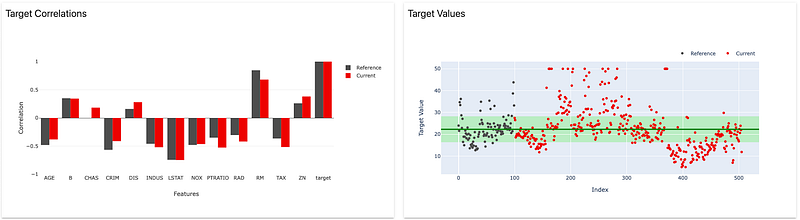
You get a lot of information about tests results, distribution, statistics and many more metrics. If you are interested, here is the documentation of Evidently.
The second dashboard I built is about model performance. I created a linear regression model and got some predictions. To perform the reports calculating, I was obliged to use column mapping. As I said before, column mapping aims to define the columns of the dataframes passed into the dashboard because Evidently needs some precise columns. For example, to build the performance dashboard, I needed the test dataframe to have a target column and one with the predictions.
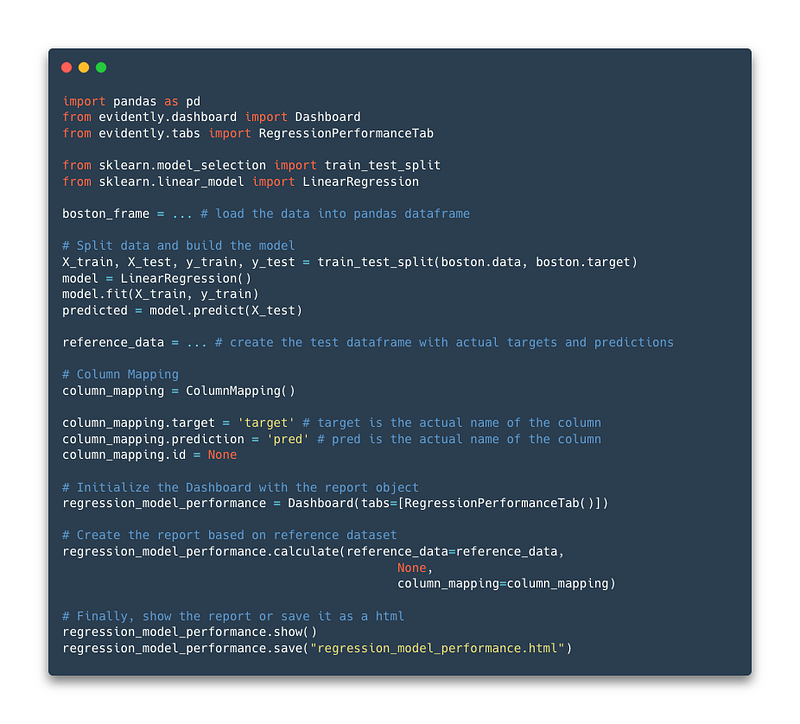
I did not specify a current dataset because the goal was to see the model performance of the reference data only.
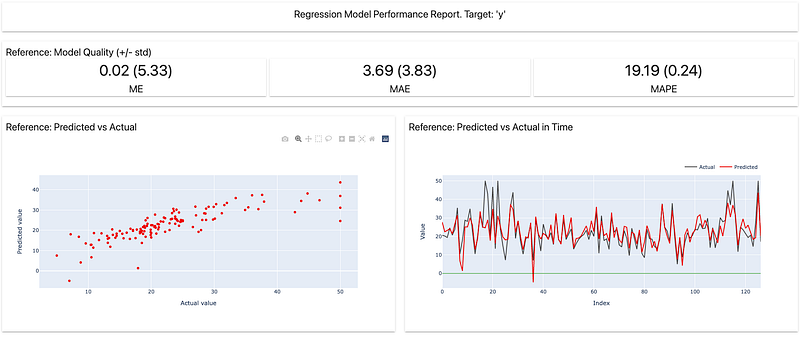
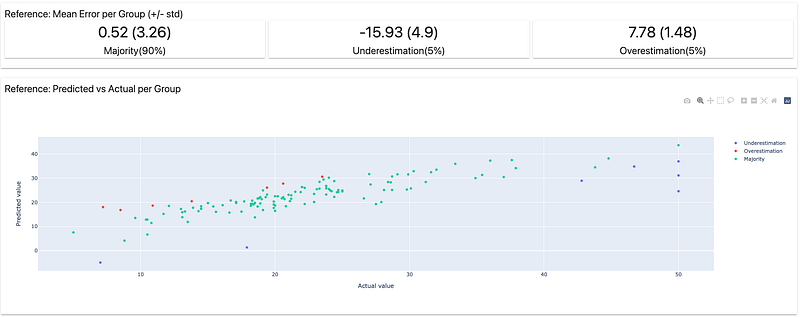
Here is examples of what the report looks like :
Dashboards can be saved as HTML pages but it is also possible to create what Evidently calls profiles and get the calculation results from reports into a JSON file.
Conclusion
Monitoring is a key stage of any machine learning pipeline. It is a thing to build a model from preprocessed data and deploy it anywhere to make predictions. However, real problems evolve and require the entire pipeline of the model that tries to solve it to be maintain. Risks such as model drifts can appear and change the performance of the service or product using the model. This is where Evidently arrives with all its pre-built reports allowing to monitor with statistical tests and more.
Thank you for reading the article, I hope that you learned something !