
Student Loan Forgiveness
Everyone is Wrong About PSLF
A correct reading of the updated data shows the program is hugely successful.

I might sound like a broken record, but the Public Service Loan Forgiveness (PSLF) program is not broken. Sure, it had a terrible, horrible, no good, very bad decade, but it has started to fulfill the loan forgiveness promises that were made back in 2007.
Adding to the rancor is the newest batch of data showing the approval rates of PSLF applications, with most media outlets howling about the abysmal 2% approval rate.
Here’s the problem: everyone is wrong about PSLF.
The numbers don’t show a completely broken program that has duped borrowers into a hopeless situation.
Rather, they show a program that has dealt with logistical nightmares and political malfeasance, all while growing more more successful with each passing month.
A Brief History of PSLF
The PSLF program was created in 2007 with the goal to attract highly educated graduates to otherwise lower paid industries (e.g. government and non-profit) with the promise to pay off their student loans.
The premise was simple enough:
- Make sure your student loans are Direct Loans
- Get on an income-drive repayment (IDR) plan
- Work at a qualifying employer
- Make 120 monthly loan payments (10 years)
After that, submit your application and viola! your loans are forgiven. Unfortunately, the program had a few snafus, to say the least.
- Only one little known IDR plan was available until 2009
- Direct Loans were not standardized until 2010
- The Employer Certification Form did not exist until 2011
- Student loan servicers were criminally misinformed about what loans and employers qualified
All of this has led to article after article written year after year about the abject failure of the PSLF program.
For example, take this story from Forbes.
Here’s a quote from someone I would consider an expert (albeit a political one) on student loans.
Student loan borrower advocates slammed the Biden administration for the ongoing failures of the PSLF program.
“We are six months into Joe Biden’s presidency and the Public Service Loan Forgiveness program continues to fail teachers, nurses, and millions of other public service workers on the front lines of our pandemic response,” said Seth Frotman, Executive Director of the Student Borrower Protection Center and the former Student Loan Ombudsman at the Consumer Financial Protection Bureau.
“Yet again, 98 percent of those who applied for PSLF were rejected, forcing us to ask — what has this administration done to help public service workers with student debt?”
I’m surprised that Seth Frotman actually gave this quote. He’s been working on student loan issues for years, particularly the PSLF debacle.
Either he doesn’t fully grasp the numbers after all this time (highly unlikely) or he’s playing politics (most probable).
The problem with the doomsday howling is that it is hurting the very population these people are trying to help: student loan borrowers.
The more the naysayers claim that PSLF is an abject failure, the fewer borrowers will take advantage of the program, thereby saddling them with a lifetime of student loan payments for a debt that would otherwise be forgiven in just 10 short years.
But enough of the politics. Let’s dive into the numbers.
The Raw Data
The Department of Education recently updated the PSLF forms, combining the Employment Certification form, which verified employer eligibility and payment count, with the Loan Forgiveness Application, which is your formal application for PSLF loan forgiveness.
This new form was released in November 2020, and it took until June 2021 to update the data. Even then, it was only through April 2021.
Here are the top line numbers from the most recent report.
- Forms submitted and processed with all information: 168,702
- Forms that met the employer, loan, and IDR equirements: 168,197
- Forms that met the 120 payments: 3,458
Total approval rate = 3,458/168,702 = 2.05%
Not good.
However, let’s take a look at those numbers with a critical eye.
The Adjusted Data
Under the forms that did not meet the 120 payment criteria are three categories, all of which mean different things.
1 — Payment Count Requests: Newer Graduates
The first category is for applicants who just want to know how far along they are on the PSLF journey.
a) No open Direct Loans in repayment for at least 120 months at the time of submission (Note: These figures include some borrowers who have been in repayment for at least 120 months due to having loans from the Federal Family Education Loan Program.): 135,514
Over the years, people who are gunning for PSLF have created a wonderful community across Facebook, Twitter, Reddit, etc. and the biggest piece of advice they all suggest is to recertify your employment every single year.
Why? Because FedLoan has made so many mistakes.
Horror stories abound of applicants who submitted their very first PSLF paperwork after working for 10 years, only to be informed they were denied due to some minor misunderstanding of the program.
These stories, while heartbreaking, served as a stark realization that borrowers who are working towards PSLF need to take matter into their own hands, annually ensuring their employment successfully counts towards the 120 payments.
My guess is that 90% (and probably higher) of these “applicants” aren’t really applying for forgiveness. They’re just certifying their employment and verifying their payment count, knowing full well they are not at 120 payments yet.
Updated figure: 135,514 * 10% = 13,551
2 — Payment Count Requests: Older Workers
The second category is for applicants who have had loans for 10 years but haven’t worked at the right job for long enough.
b) Has open Direct Loans in repayment for at least 120 months, but has less than 120 months of qualifying employment at time of submission: 22,596
This group mostly consists of original applicants who were paying off qualifying loans but who did not consistently work for a qualified employer.
Again, they are working towards forgiveness, but even with a repayment time greater than 10 years, they still are just looking for updated info for their current count of qualified payments.
A second, smaller group is the older workers who tried their hand at the private sector, discovered they weren’t making a dent in their student loan debt, and decided to pursue forgiveness later in their career.
I would also peg this overall category as only being 10% genuine in applying for loan forgiveness.
Updated figure: 22,596 * 10% = 2,260
3 — TEPSLF Applicants
The third category is the group of borrowers who have worked their butts off, only to be told that they don’t qualify, due to the wrong loan type, payment plan, or employer.
c) Has open Direct Loans in repayment for at least 120 months, has at least 120 months of qualifying employment at time of submission, but has less than 120 PSLF Qualifying Payments at time of submission. (Note: These applications will be reported in TEPSLF section since the form met all other PSLF requirements except the number of qualifying payments.): 6,629
This group almost exclusively consists of the first cohort that was eligible in 2017 — 2019, who are fighting for loan forgiveness under a good faith effort.
As a result of the negative backlash these people brought to the program, the DOE created Temporary Expanded PSLF, or TEPSLF, allowing otherwise disqualified borrowers to receive forgiveness.
In a government-originated twist, to receive forgiveness through TEPSLF, one must first be denied through PSLF. That means that all of these applications can be ignored due to their full expectation of denial.
Updated figure: 0
Putting It All Together
Why am I so confident in the adjusted data? Mostly because the reasons for PSLF rejection are now quantified by the DOE report.
Below are a list of reasons that many pundits say are the main drivers behind the “massive denial” of PSLF applicants, along with their actual numbers.
- No Direct Loans: 194
- Employer not eligible: 62
- Employment date error (e.g. prior to 2007): 233
- Loans in default or otherwise ineligible: 16
That is a grand total of 505 forms that were outright rejected out of 168,702.
Said another way, only 3 out of every 1,000 PSLF forms were denied due to outright misunderstanding, misinformation, or misleading direction by the student loan servicers.
That leaves 99.7% of the forms submitted by borrowers who understand the program and are on track for successful forgiveness in the next few years.
So what is the actual success rate of PSLF, now that we have adjusted the data?
- Forms that met the employer, loan, and IDR equirements: 168,197
Of those forms, only
- Newer graduate applications: 13,551
- Older graduate applications: 2,260
- TEPSLF applications: 0
Total actual applications for forgiveness (i.e. not merely payment count requests) is now just 15,811, which is much lower that the “total” figure given the government.
Given the 3,458 forms approved for forgiveness, the actual PSLF success rate is now 21.9%
Much different from the headline news, but it tracks with what I’ve been writing about for the past few years.
Using the old data from the old forms, I had estimated that the success rate was hovering between 8% and 16%.
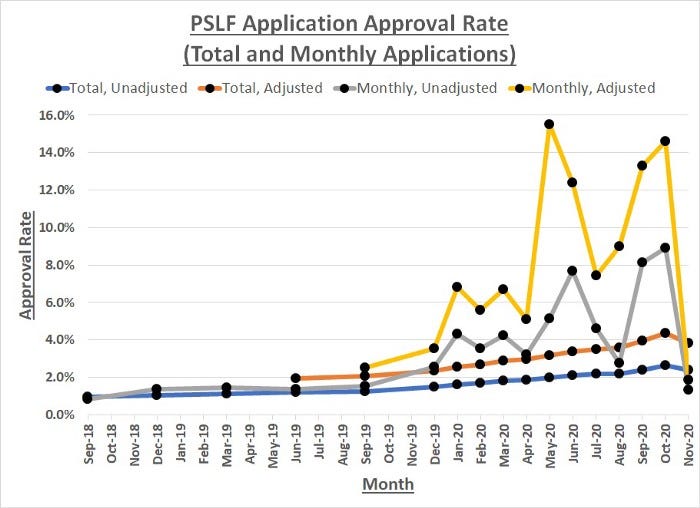
The methodology for getting these numbers can be found in a previous PSLF article.
What I want you to focus on is the yellow line, which is the month-over-month PSLF approval rate. The program was a disaster in 2018 (the first month data was available), but it has been steadily getting better.
PSLF turned a corner in spring 2020. The rest of 2020 data was processing late 2019 and early 2020 applications, so the numbers were still good. Then the pandemic and the new application form happened, which completely tanked the data.
The updated number of 21.9% falls in line with where the program was a year ago, and it will only get better.
Don’t believe me?
In the six months since the new PSLF form was released, the total amount forgiven is has been $162,295,196, with an average balance of $95,976.
You could also check out the recent success stories, with $4.5 million in PSLF loan forgiveness during the last two weeks in June.
The Takeaway
If you are pursuing loan forgiveness through PSLF, I would be heartened to see the reported numbers.
Don’t listen to the naysayers. Most of them don’t fully understand the program, it’s history, and the idiosyncrasies of dealing with FedLoan.
Make sure you have your 4 qualifications, then keep toiling away for those 120 payments. You’re going to have to pay them anyways, so why not make them count for something.
Lastly, be sure to add 1/10 of your forgiveness amount to your annual salary when looking for a job. It may just tip the scales in favor of a lower salary but higher total compensation.
Take me, for example.
I have $135,000 in student loans. The simple math, ignoring accumulating capital due to interest, is that I can add $13,500 to my salary.
That was 10 years ago.
I’m now 5 years in, and any private sector job I might take now needs to add an additional $27,000 to my salary to make it worth my while.
Add on my government pension, and I think I’m sticking it out for the next half decade.
The Latest Stories From Money. Daily.
- The Dangerous Path of Second Guessing Your Truth
- The FED Doesn’t Have Skin In The Game
- My Biggest Writing Mistake (So Far)
- The Ten Most Useful Finance Apps
- Building Your Financial Future as a Teen
Don’t miss my next article! Click here to get notified when I publish new material.
If you love the articles published in Money. Daily., then become a member of the Medium community and get full access to our full archives.
This article is for informational purposes only, it should not be considered Financial or Legal Advice. Not all information will be accurate. Consult a financial professional before making any major financial decisions.


