
ETHEREUM RALLY
Ethereum strongly moves North on diverse use cases
The second-largest crypto is outperforming its peer Bitcoin, as it shows its utility as a much more diverse digital asset
It has been an impressive rebound for the digital assets after their winding down in the middle of the summer. However, unlike most of the previous cases where Bitcoin is the main driver, the bullish case this time has been largely dictated by Ethereum. Earlier, the second-largest crypto crossed $4k in more than three and a half months. Although it has slipped a little bit from this recent peak, the momentum remains strongly bullish — trending close to $3,960 at the time of writing.
From the lowest point recorded in mid-July (around $1,730), ETH has posted an impressive growth of over 130% so far. This dwarfs the 70% gains of the premier digital asset Bitcoin for the same period. Having said that BTC is taking another stab at the psychological barrier of $50k as we speak — trading at $50.4k. A convincing break here for the top crypto might open doors for bigger gains ahead, but for now, ETH is taking the lead.
This begs the question, what are the factors driving the massive growth in Ethereum. I have discussed this one on more than one previous occasion that Bitcoin is, by and large, considered as a digital store of value and therefore a passive investment tool. On the other hand, Ethereum exhibits a diverse set of use cases — dApps, smart contracts, Stablecoins, Decentralized Finance (DeFi), Non-Fungible Tokens (NFTs). With the recent explosion of NFTs & DeFi, Ethereum has benefited greatly.
Although NFTs have cooled off somewhat recently, total value locked (TVL) in Stablecoins and DeFi has continued to soar, owing to increased mainstream adoption. Previous surges in TVL were in large part due to increases in Bitcoin and Ether prices, but the current push comes as both tokens trade below their 2021 highs, indicating that the rise in TVL has more to do with the rising value of DeFi tokens and the increased use of stablecoins.
With that out of the way, let’s look at some of the quantitative factors (total value locked, transaction volume, transaction fees, etc) to see how far Ethereum has come over the past year or so. Metrics provided in the charts below by Messari Research & Chainalysis Market Intel will give you an idea.
Transaction Volume Comparison
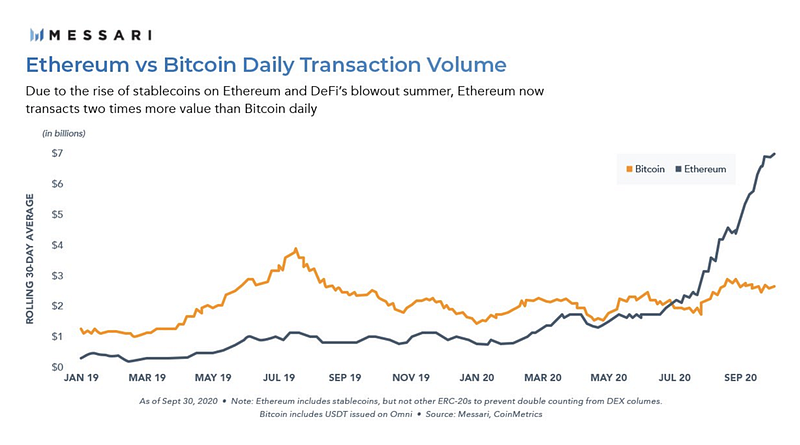
This first chart (Figure 1) provides a transaction volume comparison between the top two cryptos. As you can see, for the most part since early 2019 Bitcoin transactional volume far outpaced ETH — reaching a peak of about $4 billion in Jul/Aug. 2019. And then the volumes start to converge and right at the time in the summer of 2020 when DeFi was taking off, the transaction volume of ETH overtook BTC, and never looked back. The exponential growth we have seen in Ether ever since has taken it to a volume of over $6 billion — increasing almost sixfold, while Bitcoin has plateaued around $2 billion. The growth in Ethereum can be attributed to its burgeoning ecosystem.
Price Comparison (BTC/ETH)
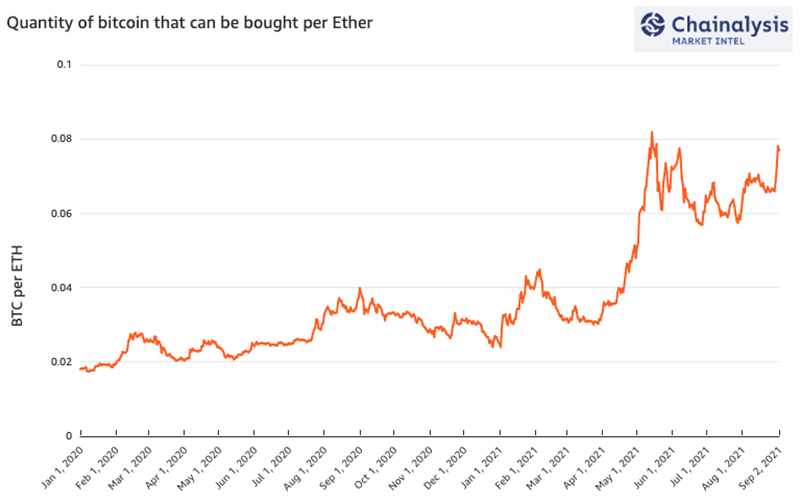
And as the second chart shows (Figure 2), Ethereum has become increasingly valuable relative to Bitcoin over time, with one ETH currently buying 0.077 BTC (close to the previous high reached in May). The increase in Ethereum’s relative value has been significant since the Ethereum price rose above $2k in April 2021 and largely remained above this level even as prices fell from mid-May.
Analyzing it a little further, Ether’s current price floor (or support) stands at $1.9k — the cost of Ethereum currently held that was acquired by investors in the last 12 months. The same for Bitcoin comes in at $39k. So the relative price floor is likely to be 0.049 BTC per ETH ($1.9k/$39k). As obvious, the relative price is currently much higher than this — dictating the fact that the market is currently reaching for the price ceiling rather than falling to the floor. It also indicates ETH’s robust growth over BTC.
Ethereum Flows (Source & Destination)
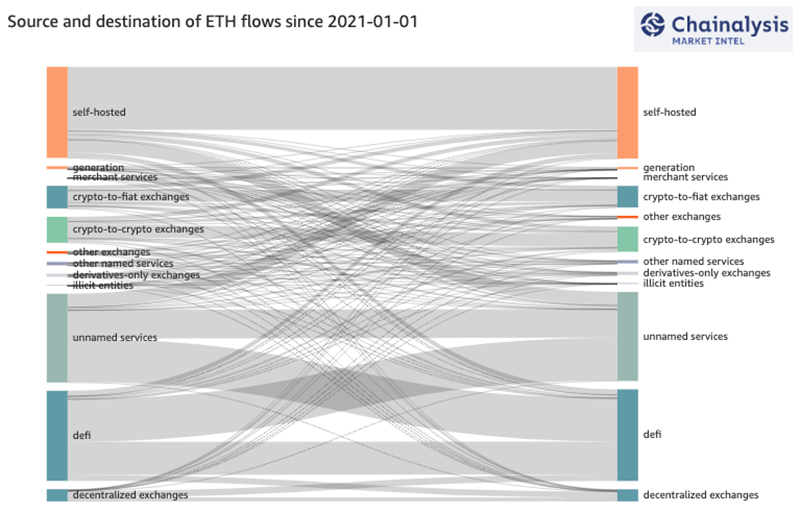
The next chart (Figure 3) provides a little more clarity on the divergent use case narrative of Ethereum. You will notice multiple sources and destinations for the second-largest crypto. Apart from the known entities like crypto exchanges and DeFi, you will also notice unnamed services. These are entities on the Ethereum blockchain where people can send their Ether in exchange for goods and services, but which have developed so fast that we have not got around to naming them all yet.
Needless to say, that a plethora of use cases for ETH is generating strong demand for this digital asset. At the same time, it invigorates further speculation for future demand as well. Such massive growth and innovation have also given rise to some healthy competition. Promising projects like Binance Smart Chain & Solana are already taking some business away from Ethereum as we will see in the next chart.
Weekly ETH Blockchain Transfers
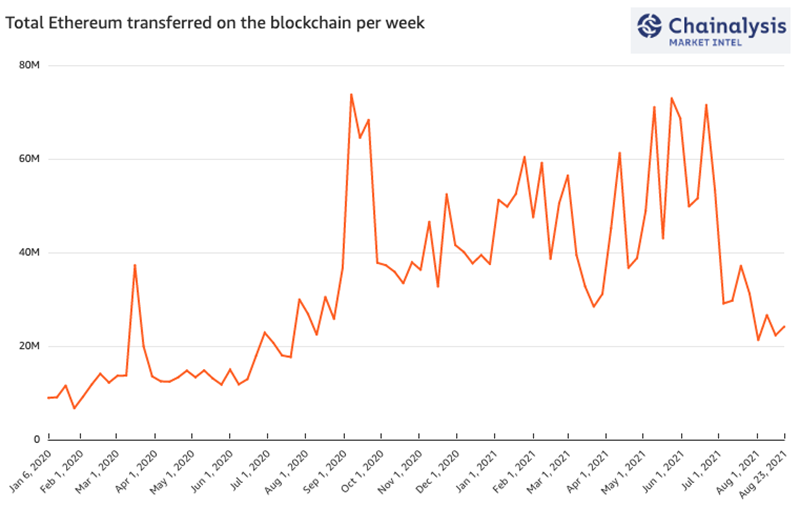
Not necessarily a huge worry for ETH right now, but the final chart above (Figure 4) highlights ETH volume transferred has declined considerably from May and June levels, from 50 to 70 million Ethereum transferred per week, to 20 to 25 million Ethereum transferred per week in August. However, stiff competition might not be the major reason here. It might very well be the fee to process transactions on the ETH network, which has skyrocketed since the beginning of the year — as the blockchain got busier.
As seen in the chart, the decline in ETH transferred suggests that people are willing to pay as much now to move half the volume as they were earlier in the year. It also reiterates the fact that the excess demand is being met by other blockchains. While Ethereum has a long road ahead with emerging competition, continued improvement & innovation would mean that Ethereum remains one of the major winners.
