
Essential SQL Queries That Data Analysts Shouldn’t Have Missed — Part 2
SQL analysis of some common cases in business

Introduction
In my previous post, Essential SQL Queries That Data Analysts Should Have Known, I wrote about some basic cases and functions that save analysts a little time doing their tasks. In this article, I will continue to share such more cases, but at an intermediate level. To note, throughout this article, SQLite is the primary language for usage.
Identifying active customers
When working with user/customer analysis, the number of active customers is one of many important metrics we care about.
In this case, I will define an active customer as the one who has purchased a company’s product once before and has returned to make another purchase within 7 days.
But first, I will create a simple data table containing information about a company’s orders: order number, customer id, item description, and date of order purchased. The order number is the primary key of this table.
DROP TABLE IF EXISTS `orders_data`;CREATE TABLE `orders_data` (
`ORDER_NO` INTEGER(5) NOT NULL,
`CUSID` INTEGER(4) NOT NULL,
`ITEM` varchar(30) NOT NULL,
`ORDER_DATE` date NOT NULL,
`TOTAL_AMOUNT` FLOAT(10) NOT NULL,PRIMARY KEY (`ORDER_NO`)
) ;INSERT INTO orders_data VALUES(10,1203,'apples','2022-01-04',60);
INSERT INTO orders_data VALUES(11,1204,'oranges','2022-03-28',103);
INSERT INTO orders_data VALUES(12,1205,'apples','2022-05-06',140);
INSERT INTO orders_data VALUES(13,1203,'pie','2022-05-10',120);
INSERT INTO orders_data VALUES(14,1203,'juice','2022-05-14',111);
INSERT INTO orders_data VALUES(15,1205,'phone','2022-05-12',1050);SELECT * FROM orders_data;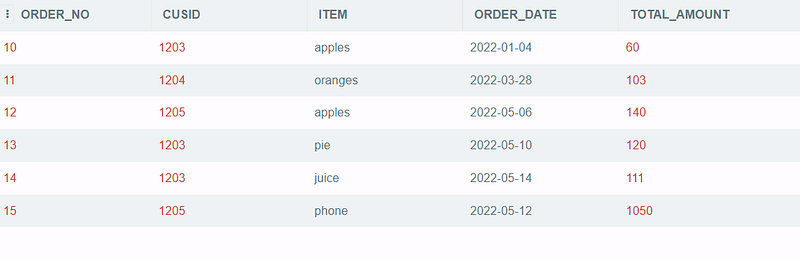
The idea is, that we will find the gap between the maximum order date and the previous nearest purchased date of each customer. If this gap is shorter or equal 7, this means the customer is still active. In my previous article, I mentioned a way to find the nearest previous value by using lag() function. We can also use the function to apply in this case.
SELECT cusid, max(order_date), Previous_purchase
FROM
   (SELECT *,
    LAG(order_date,1) OVER (PARTITION BY cusid ORDER BY  order_date) AS previous_purchase
    FROM orders_data)
Output:
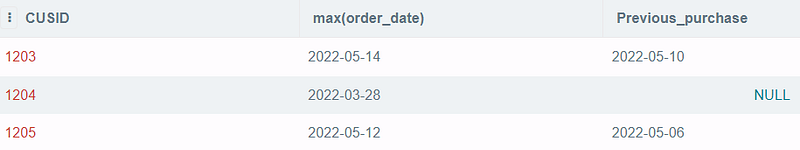
With the output above, we can quickly get the days apart between the newest purchase date and the nearest previous order date of each customer. Then, the customers with data gap of ≤7 are the active customers.
SELECT distinct cusid,
(julianday(newest) - julianday(Previous_purchase)) AS gap_between_orders
FROM date_gap
GROUP BY cusid
HAVING julianday(newest) - julianday(Previous_purchase) <=7
Output:
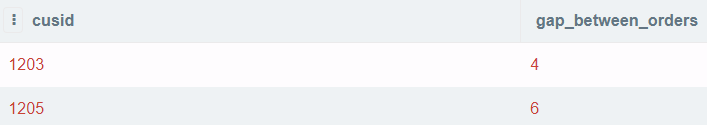
In the end, only 2 customers, 1203 and 1205, are still active.
There is a shorter solution than the one above, with the same logic but more straightforward. We can use inner join() to get the order dates to calculate the gap for each customer. Here is the code for your reference, and of course, the result is the same as the previous solution.
SELECT DISTINCT(a.cusid)
FROM orders_data a  INNER JOIN orders_data b ON a.cusid = b.cusid
AND a.cusid = b.cusid
AND a.order_no <> b.order_no
AND julianday(b.order_date) BETWEEN julianday(a.order_date) AND julianday(a.order_date)+7
Finding the most frequent items bought each day
Sometimes, store owners want to find the store's favorite items to give more inventory to those products.
The table below contains a list of dates and items purchased. We need to write a query to return the most frequent items ordered daily.
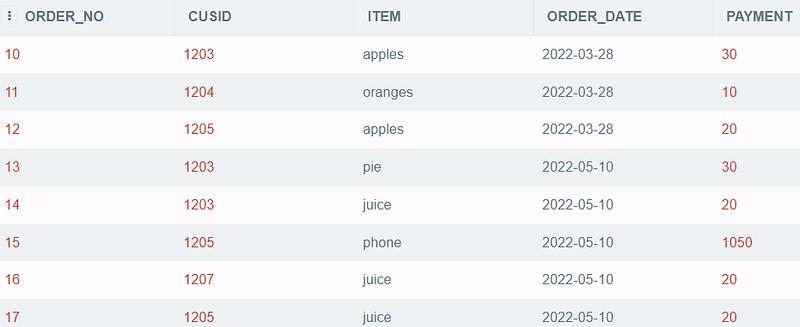
We will calculate the total number of units sold for each item each day and compare those amounts. To note, I will use dense_rank()function in this case to make the comparison. You can read my post: Distinguish 4 ranking functions for more references to different ranking functions.
The idea is written in a SQL code as below:
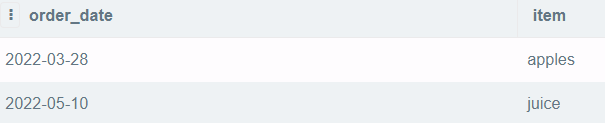
--Select item whose rank = 1
SELECT order_date, item
FROM (
--Rank total numner of each item
SELECT order_date, item, count_item,
DENSE_RANK() OVER(PARTITION BY order_date ORDER BY
count_item DESC) AS denserank
FROM ( --Count items and group by date
SELECT order_date, item, count(*) AS count_item
FROM store_data
GROUP BY 1,2))WHERE denserank = 1Output:
Defining the date when users become platinum or gold
Different categories of customers have different needs. For instance, churn customers need incentives to come back, but regular customers do not need those incentives to make a purchase. They may favor promotions on products that they often buy.
In short, particular programs need to be customized for specific groups of users. That’s why analysts or strategists often divide the customer portfolio into smaller categories for easier management.
In this example, I want to specify the date when customers move from one category to another. The customer whose category is Silver would be changed into Gold if they made at least three purchases in the last three months. The current date is supposed to be 2022/06/10.
The data table is as follows:
DROP TABLE IF EXISTS `category_data`;
CREATE TABLE `category_data`
(`CUSID` INTEGER(4) NOT NULL,
`TRANSACTION_DATE` date NOT NULL,
`ITEM_CODE` INTEGER (30) NOT NULL,
`CATEGORY` CHAR (10) NOT NULL) ;
INSERT INTO category_data VALUES(1011,'2022-03-28','apples','Silver');
INSERT INTO category_data VALUES(1011,'2022-03-29','juice','Silver');
INSERT INTO category_data VALUES(1011,'2022-03-21','apples','Silver');
INSERT INTO category_data VALUES(1011,'2022-06-10','juice','Silver');
INSERT INTO category_data VALUES(1022,'2022-05-10','apples','Silver');
INSERT INTO category_data VALUES(1033,'2022-05-11','phone', 'Silver');
INSERT INTO category_data VALUES(1033,'2022-05-12','apples', 'Silver');
INSERT INTO category_data VALUES(1033,'2022-05-20','oranges','Silver');
SELECT * FROM category_data;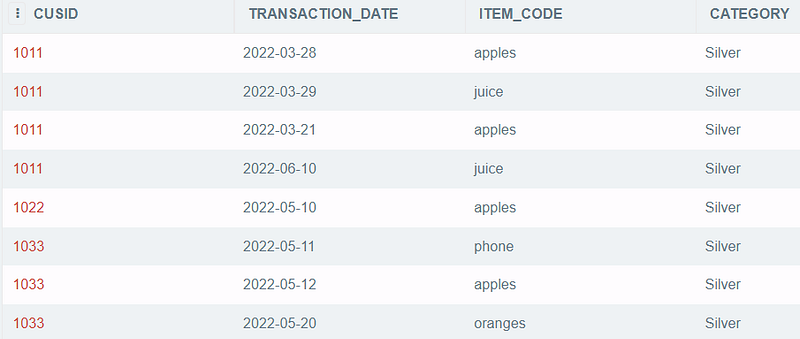
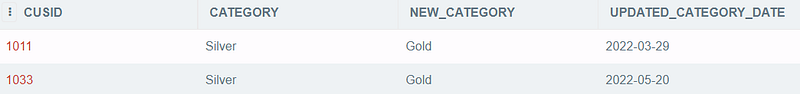
I will select the transactions that happened within three months from the current date. Then, I can use function row_number() to get each customer's transaction number and the date of users becoming gold users when the transaction numbers reach 3.
-- Select cusid whose transaction number = 3 and convert those users to gold with corresponding transaction dateSELECT cusid, category, 'Gold' as NEW_CATEGORY, transaction_date as UPDATED_CATEGORY_DATE
FROM (-- Mark transaction number of each cusid
SELECT *, ROW_NUMBER() OVER (PARTITION BY cusid ORDER BY transaction_date) AS TRANSACTION_NUMBER
FROM (
-- Select transaction period <= 3 months
SELECT *
FROM category_data
WHERE
julianday('2022-06-10') -
julianday(transaction_date) <= 90 ))WHERE TRANSACTION_NUMBER = 3Output:
Selecting products that are frequently purchased together
Suppose we have a list of items sold for each order; we want to find which products are usually bought together so that we can adjust our system to have more suitable user recommendations.
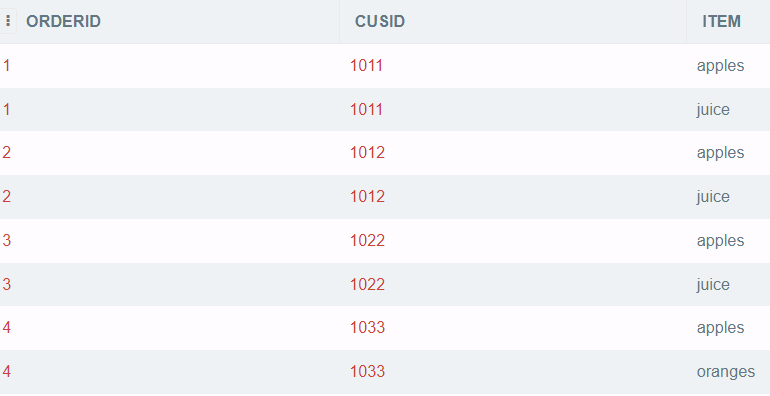
The method is simple, as you can concatenate the items, group them by each order id and then calculate the frequency of pairs of products.
--Count the frequency of each pair
SELECT *,
COUNT(*) AS frequent_pair
FROM (
-- Pair the products from same order
SELECT item1 || ' & ' || item2
FROM (
-- Get unique product pairs from the same order id
SELECT t1.item AS item1,
t2.item AS item2
FROM data t1
JOIN data t2 ON t1.orderid = t2.orderid
AND t1.item < t2.item ))GROUP BY 1
ORDER BY 2 DESCOutput:
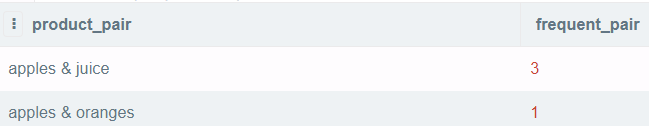
As a result, we can see that apples and juice are the two products people often buy together. By knowing people purchasing habits, we can adjust the recommendation system to increase product sales.
Converting negative numbers to positive and vice versa
The following two sections will be like a fun and quick transformation.
First, I will create a simple data table pos_neg with negative and positive values.
DROP TABLE IF EXISTS pos_neg;
CREATE TABLE pos_neg(number int, value int);
INSERT INTO pos_neg VALUES (1, 3);
INSERT INTO pos_neg VALUES (2, 7);
INSERT INTO pos_neg VALUES (3, 200);
INSERT INTO pos_neg VALUES (4, -90);
INSERT INTO pos_neg VALUES (5, -89);
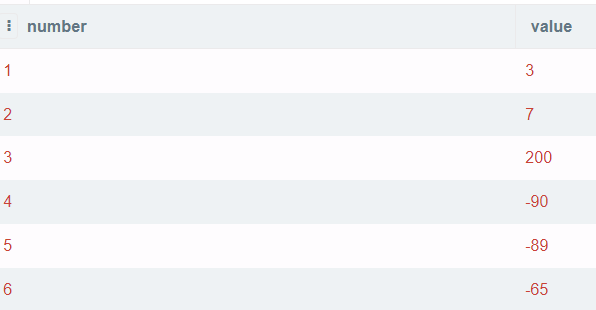
INSERT INTO pos_neg VALUES (6, -65);select * from pos_neg;So here is what our data looks like:
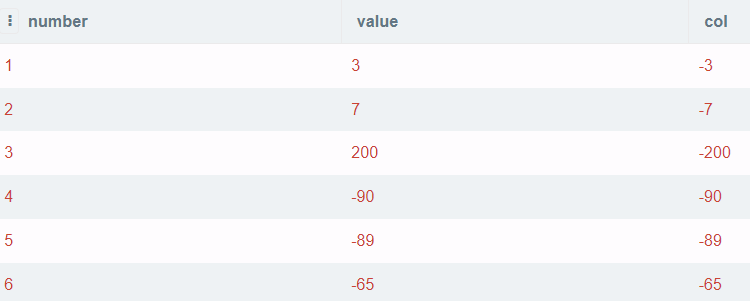
In case you want to convert positive values to negative values and keep the negative ones the same, I suggest using case when function to specify your targets.
SELECT number,
       value,
       CASE WHEN value > 0 THEN -value ELSE value END AS col
FROM pos_neg
Output:
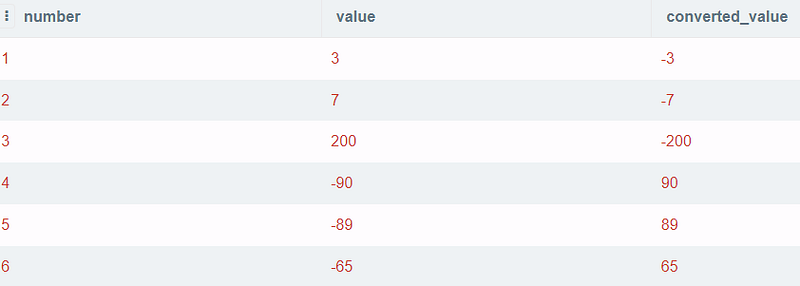
The query will be much simpler if you want to convert all values to the opposite signs. You can do it as follows:
SELECT *,
       value*-1 AS converted_value
FROM pos_neg
Output:
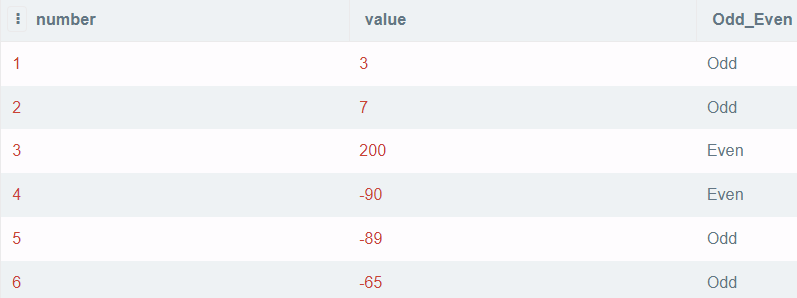
Finding the even or odd values
Continue to use the data table pos_neg; the idea of finding odd or even values is very straightforward. Values are divisible by 2 are even numbers or else odd ones.
SELECT number, value,
   CASE WHEN value%2=0 THEN 'Even'
        WHEN abs(value)%2=1 THEN 'Odd' END as Odd_Even
FROM pos_neg
Output:
Conclusion
Above are some common questions I found in some SQL interviews. I want to share some of these and my approaches to these problems. If you have any interesting sources or questions, do not hesitate to let me know.
Thank you for reading until the end.