
Essential SQL Queries That Data Analysts Should Have Known

Introduction
SQL is a well-designed and vital language to help us explore and understand the data. Long story short, instead of processing massive datasets in Python or R, the first step in analytics should be to extract helpful information from our data using SQL
As you may see, there has been a lot of discussion on how important it is to acquire and master SQL as one of the essential skills for any data analyst or data scientist. Therefore, in this article, I will not again mention or emphasize the usefulness of SQL but will introduce you to a list of SQL queries widely used and helpful in different analytic tasks. To note, throughout this article, SQLite is the main tool for usage.
Find duplicated rows in a table
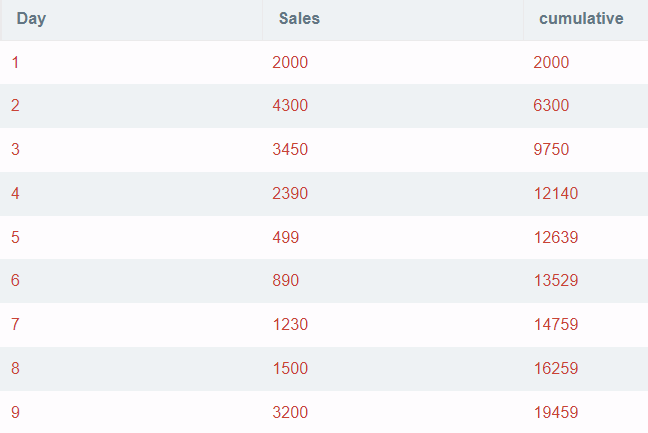
Often, when starting doing an analysis, I want to check if there are any duplications in my dataset that may affect my analysis. For example, I have a simple table of sales data of a store as below:
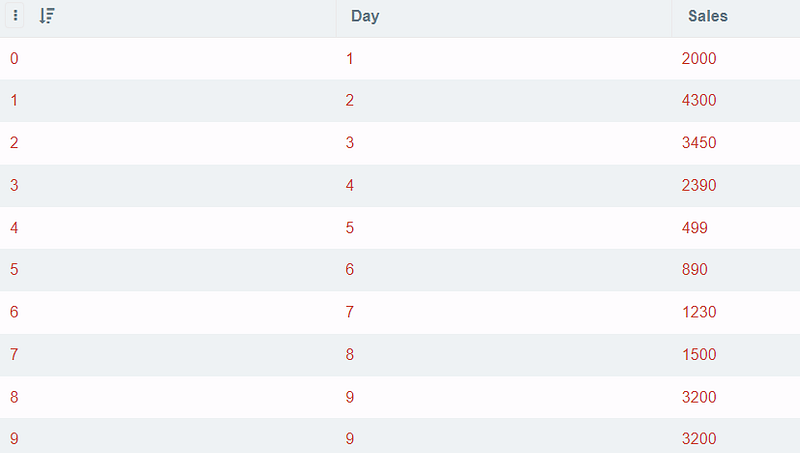
As you can see, the sales are duplicated for day 9. However, it will be hard for you to see the duplications in a more massive dataset. Therefore, this SQL command below can help you check and see where the duplicated rows are.
SELECT Day, Sales, COUNT(*)
FROM df2
GROUP BY Day, Sales
HAVING COUNT(*)>1
Output:

Avoid duplicates and select unique rows
After finding out the duplicated rows, we may only want to select the unique rows to continue with the above example. In my case, I will keep one row of Day 9 as follows:
SELECT Day, min(Sales)
FROM df2
GROUP BY Day
Display Nth rows in the data table
If you want to select a specific row in the dataset, you can use offset() function to fetch the data row you want. In my example below, I want to fetch the record of the 6th row.
SELECT * FROM df LIMIT 1 OFFSET 5Output:

Return the first N rows for each group and order by a custom column
My dataset now has one more column section_id to keep track of sales for different products.
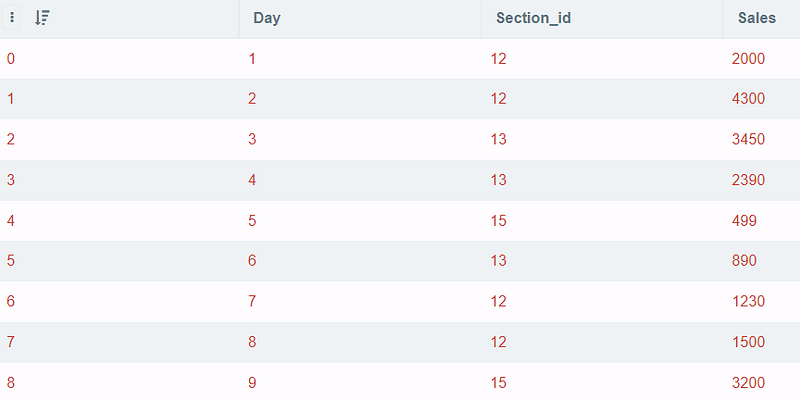
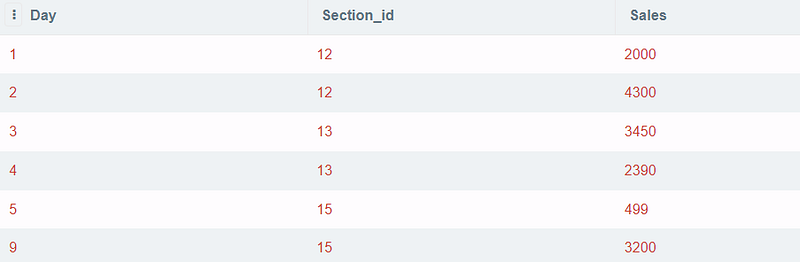
So, if I only need to study the first 2 rows (ordered by Day) for each section_idI can use row_number()for each second_idand then select the first 2 rows in each section.
SELECT
Day, Section_id, Sales
FROM (
   SELECT ROW_NUMBER() OVER (PARTITION BY section_id ORDER BY Day)
AS rank,tbl.*
   FROM df2 tbl) tbl2
WHERE
tbl2.rank <= 2
Output:
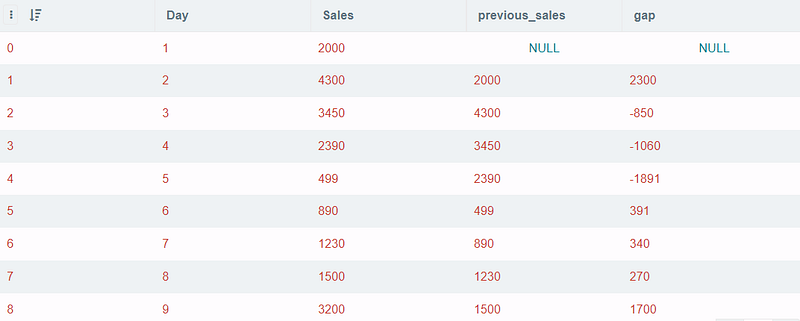
Find the sales difference compared to the previous day using Lag
Suppose you want to see if the sales today are increasing or decreasing compared to the last day, you can find the sales gap by using lag() function.
This example with lag() function returns the previous day's sales and the difference by subtracting the last day's sales from the current one.
SELECT *, Sales - previous_sales AS gap
FROM
(SELECT *, LAG(Sales, 1) OVER(ORDER BY Sales ASC) AS previous_sales
 FROM df)
Output:
To talk a little bit about the lag() function, it is very useful in making comparisons between the current row and previous ones. offset states the number of rows back from the current row where data can be accessed. The default value of offset is 1. So, that means if I want to compare the present day with the day before yesterday, I can use offset = 2. The parttition by clause will help to divide rows into partitions to apply lag() function. In case, the parttition byis removed, the whole set will be considered as a single partition.
In contrast to lag(), we also have lead() function, which allows you to return values from the next row in the table. The syntax of lead() is actually similar to lag().
LEAD ( scalar_expression [,offset] , [default]) OVER ([ partition_by_clause ] order_by_clause)Compute the cumulative sales after each day
The cumulative sum is another crucial metric to track if the KPI has been met. In this example, the cumulative sum of sales is easily calculated as:
SELECT *, sum(Sales) OVER (ORDER BY Day) AS cumulative
FROM df
ORDER BY Day
Output:
Combine two text columns
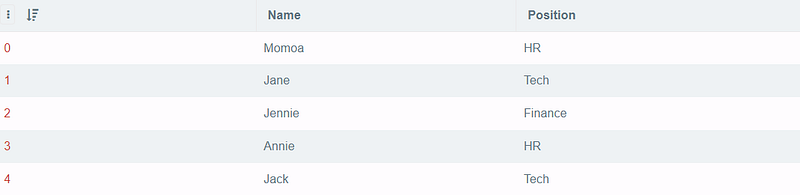
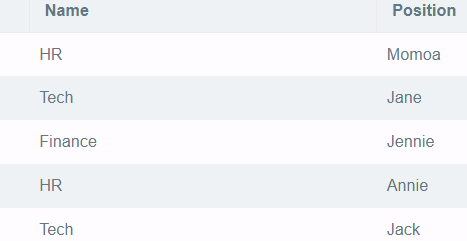
Suppose there is a table consisting of two columns, nameand position. I want to retrieve the result of all the names followed by the first letter in the position column enclosed in parenthesis. For example, if the person named Annie is working in the HR function, I want to see the result Annie(H) after querying.
SELECT *,
Name||'('||SUBSTR(Position, 1, 1)||')' AS Short_name
FROM df4;
Output:
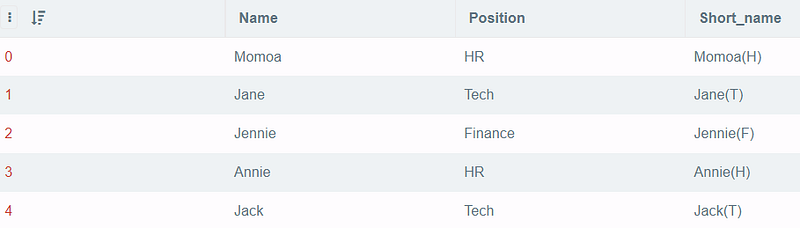
I use || to concatenate the words, and SUBSTR to pass the column name with the start index and end index. Since only the first letter is needed, I went with 1,1(notice that the start index is inclusive and the end index is not inclusive).
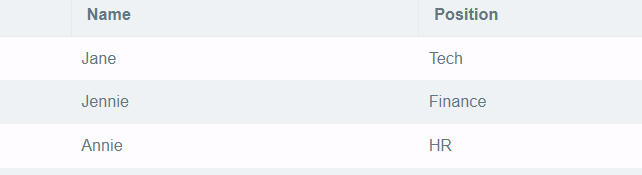
Select words where the Nth letters are equivalent to some specific letters
From Employee Data in Figure 3, I want to select the employee’s name whose 3rd character is “n” The command is simple with LIKE ‘ — n’
SELECT *
FROM df4
WHERE Name LIKE '__n%'
Output
Swapping values of two columns
Lastly, I suppose this command is as not as necessary to know, but I think it’s interesting to know how to switch values between columns :D. For example, let’s try to swap two columns, Name and Position, in Employee Dataset.
UPDATE df4 SET Name = Position, Position = NameOutput:
Conclusion
Above are some SQL questions that I found interesting when doing reviews for my interviews. I know there is a lot more to cover, and I will try to continue reviewing them in my future posts. You can find part 2 of this post at the following link.
If you have any other sources to learn and practice SQL for interviews, please do not hesitate to make a suggestion.
Thank you for reading.
In order to receive updates regarding my upcoming posts, kindly subscribe as a member using the provided Medium Link.


