
Elon’s Golden Gift: Predicting The Stock Price Of Tesla With Twitter And Machine Learning
The complete guide on predicting the price of Tesla with more than 80% accuracy using NLP and Machine Learning
“ What if public sentiment for Elon Musk can be used as a primary indicator for forecasting future prices of Teslas’ stock?”
Announcement: After many requests, I have made a Telegram Groupchat where I will be sharing weekly signals for FREE. You can instantly join from THIS link.
Predicting the markets is undeniably one of the biggest challenges in the world of machine learning and finance. Despite the difficulty of the task, this endeavor is undeniably on the top list of every Data Scientist out there. The problem, though, is that it is nearly impossible… or at least that's what they say.
In the majority of cases, it is true. It is impossible to be able to accurately predict the movements of the financial markets, as they are simply unpredictable. A practical way to view the markets is as a living organism. Just like humans, they are asked to make a multitude of decisions each day. The problem is that most of the time, they do not know what decision they are going to make beforehand. If the markets themselves do not know the decisions they make in the immediate future, how can we?
Having the aforementioned in mind, I personally try not to make frivolous assumptions concerning the markets and price forecasting in general.
At the same time though, I can not stay idle when a golden opportunity such as this one is presented to me.
Elon Musk — A Global Phenomenon
Elon Musk is one of the most influential figures of the 21st century. The tail of his success is undeniably breath-taking and demonstrates how the digital era has transformed the nature of entrepreneurship forever.
All of this fame and success has created an unprecedented phenomenon. In the eyes of the populous, he has become a real-life Tony Stark. I can not think of a mainstream public figure with a fanbase more fanatic than that of Elon Musk. This is mostly due to the fact that many see him as a mentor and aspire to become like him in the future.
In other words, he has become what is known as a “Cult of Personality”. His actions directly reflect on the lives of millions of people across the globe.
This “Cult of Personality” is partly the reason for which his side-ventures (supposing that Space-X is his primary objective) have managed to become so successful. In a sense, the success of his companies is directly related to Elon as a persona.
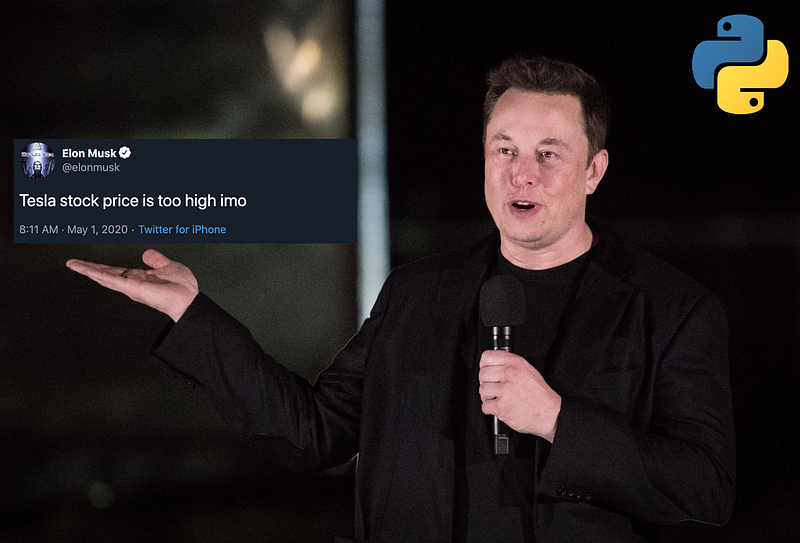
This was further proven on May 1st, 2020 when Musk decided to go on a twitter rampage, where among other tweets, he posted:
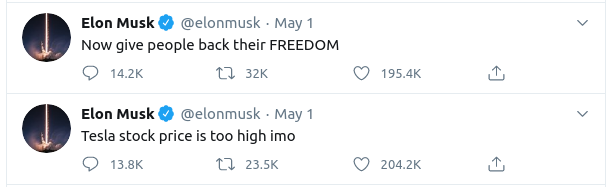
That last tweet cost Tesla a staggering $14 bn of its value.
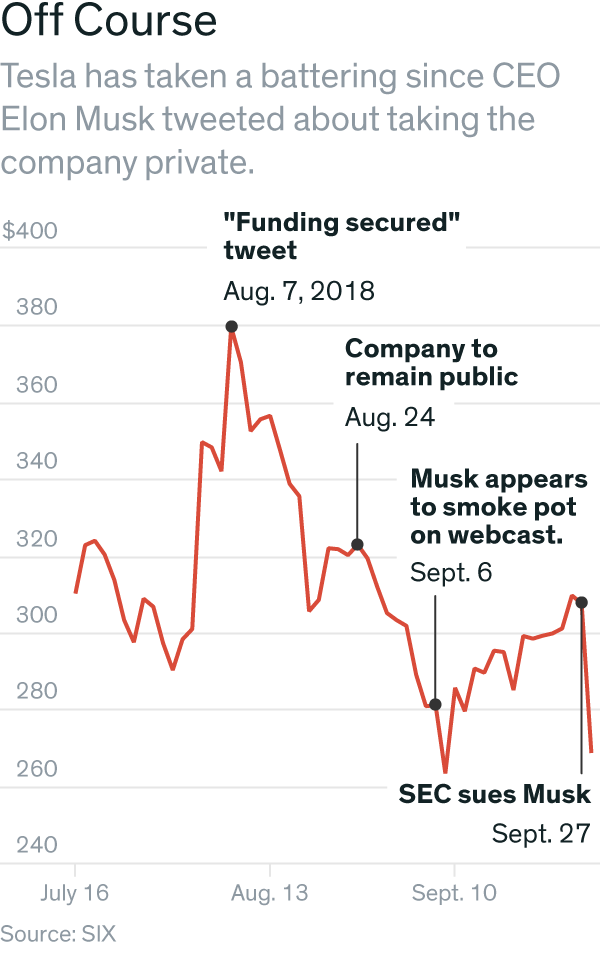
This is nothing new for Tesla. On September 7th, 2018 Tesla’s stock plummeted uncontrollably. Why? It was a direct consequence of Elon smoking marijuana live on a Joe Rogan podcast.

Again, this is a mere example. There are many more such happenings that have started to showcase a clear trend. An illustration of the immediate consequences of Musk’s actions on the stock price of Tesla can be seen below.
For more information on Elon’s tweets I recommend the following article:
If you like this article and are interested in receiving exclusive monthly content for free, subscribe to my exclusive mailing list at the end of this article (can be also accessed directly from here).
The Golden Opportunity
It must have become apparent by now that the stock price of Tesla is directly connected to Elon Musk. The question is, “what can I gain by knowing this?”.
As highlighted in the introduction, the stock-market is at-best described as unpredictable, due to the harsh reality that much of its movements are random.
Another way of viewing the stock market is as a map. A map that provides insights into the societal trends of all areas of the world. If people like something, they will buy it. If, on the other hand, they dislike it, they will want to have nothing to do with it and, hence, sell it.

By knowing that the price of teslas’ stock is directly connected to Elon (as well as the above) a question arises:
What if public sentiment for Elon Musk can be used as a primary indicator for forecasting future prices of Teslas’ stock?
Project Blueprint

Before being able to lay out a blueprint, a concise objective is needed.
The objective is clear, I will be building a Machine Learning model that will automatically decide when to buy/sell/hold stocks of tesla, by identifying the public sentiment for Elon Musk on Twitter.
The steps I will be taking are the following:
- Fetch as many tweets as I can that contain the keywords “Musk” and “Elon Musk”.
- Fetch as many tweets as I can that contain the keyword “Tesla”.
- Combine all of the tweets for each day into one huge string.
- Add the daily price of Tesla’s stock to the dataframe.
- Perform sentiment analysis on the tweets of each day and assign a sentiment score that corresponds to public opinion for Elon.
- Train machine learning models to combine time-series and sentiment analysis, as a means of predicting the closing price of the next day (by finding the sentiment score of the previous day).
The goal is not to forecast the exact market price at a specific time-stamp, but to identify whether the closing price of the next day is going to be higher/lower/equal to the closing price of the previous day.
In order for the model to be considered accurate, I will set an artificial threshold of 45% accuracy.
(The entirety of the code will be uploaded on GitHub once the official research-paper has been published)
Dataset
Having the right dataset is undoubtedly one of the most important aspects of any data science project. In this case scenario, four different datasets are required:
- The historical closing price of the Tesla stock since 2015/12/31.
- Top 300–500 daily tweets containing the key-word “Tesla” since 2015/12/31.
- Top 300–500 daily tweets containing the key-word “Musk” since 2015/12/31.
- Top 300–500 daily tweets containing the key-word “Elon Musk” since 2015/12/31.
Fortunately, acquiring historical prices for a stock is not that difficult. Yahoo Finance and iexfinance are both great ways to retrieve financial information in python, using their respected APIs. For this instance, I will be manually installing the CSV file of the data from the Yahoo Finance website.
The tweets, on the other hand, require a completely different approach. Unfortunately, twitter’s API allows the retrieval of tweets that are up to one week old. In order to bypass the limitations of the Twitter API, I made a small scrapper with the capability of fetching all of the information I need.
(I will be soon creating a Kaggle dataset, where I will publish the entirety of the CSVs)
Performing The Analysis
The first step is to import all of the required libraries. The majority of them will be either of two types: Natural Language Processing (NLP) libraries or Machine Learning libraries.
The libraries are the first step, importing the data is the second. The problem is that the twitter data by itself is categorized into 39 different CSV files with around 14,000 tweets each. It is important that somehow all of the data is concentrated into a single file.
Preparing the data
To tackle this, I will be importing each dataset separately into a different pandas dataframe. As a result, there are now 39 dataframes with the names “df1” up to “df39”.
The end-goal is to combine them into one, so I will be making a list called “frames” to which I will be assigning the entirety of the datasets. After that, pandas’ “concat” function will be used, to combine them all into a new pandas dataframe called “df”.
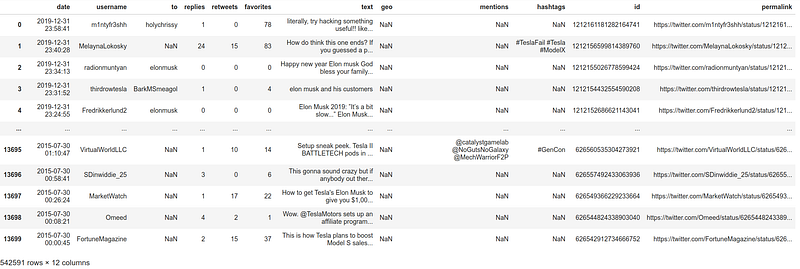
Perfect! All 542,591 tweets have been now combined into one dataframe. As expected though, there are many problems with the data-types and format. In addition to that, the dataset includes some columns that are of no interest in this project.
To start with, I will be sorting the tweets by chronologically ascending order.
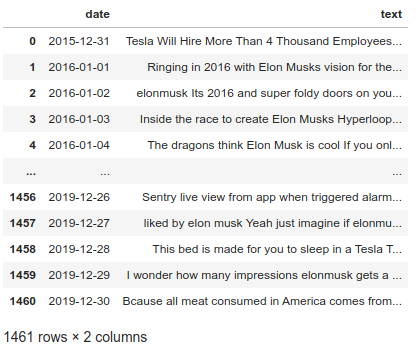
Now that the tweets have been sorted appropriately, the non-relevant columns must be dropped. Upon inspection of the different features, the ones that are deemed to be of value are “date” and “text”.
As you may have noticed in the figure above, there are multiple rows corresponding to the same day. This is obviously expected, as there are around 300–500 tweets for each day of the year. The best approach I came up with, is to combine all of the tweets belonging to a certain date into one big string. This way, sentiment analysis will be conducted with ease. Another issue that has to be addressed is the existence of special characters in the tweets. Such characters may include emojis, hashtags e.t.c. Although they are common in tweets, they present an obstacle for successful sentiment analysis.
As you can see, the data has not only been sorted in ascending date-wise order, but there is also one entry for each date, and all special characters have been removed (it is important that the date column is converted into python “datetime” format).
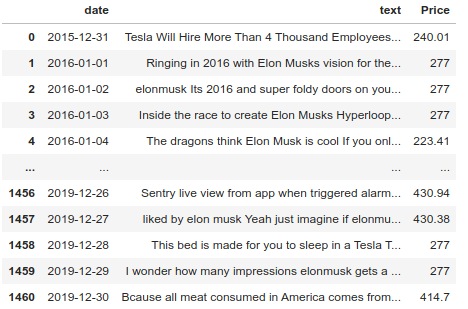
Adding Tesla historical stock prices

Importing the tesla historical-price dataset is now in order. After performing the appropriate tweaking of the dataset, a new column will be added to “df” called “Price”. The reason behind this is to merge the two datasets and have the closing price of each day as well as the tweets of that day together (the newly created column is simply a copy of the “Close” column of the tesla historical prices dataset).
The end-goal is to be able to predict the price according to the general sentiment of the previous day. A new dataframe will be thus created which is going to contain the:
- Date
- Price
- Sentiment
The default “Vader” lexicon provided by nltk will be used (custom lexicons with economic key-words can also be used).
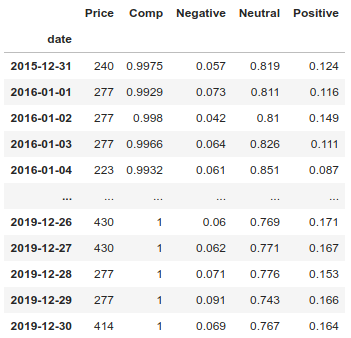
(The scores assigned to the “Comp”, “Negative”, “Neutral”, and “Positive” columns are numerical indicators used by the model to identify the sentiment of the tweet when it was written.)
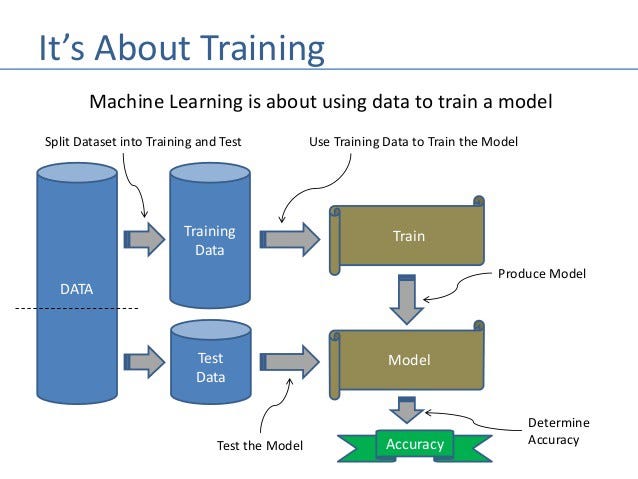
Training
With the final dataframe set-up, it is time to create a testing and training set. I will be assigning 80% of the data for training and the remaining 20% will be used for testing.
Results
Training a model is now in order. As I do not yet know which Machine Learning technique is best suited for this problem, I will be testing a plethora of models with the intention of evaluating which one is the most accurate. At this point, the goal is to reach an accuracy of 40%. The main techniques tested are:
- Decision Trees
- Random Forest
- Logistic Regression
- Artificial Neural Networks
After much testing, I came to the conclusion that the best possible course of action would be to utilize the benefits provided by Ensemble Learning (combining different machine learning techniques to reach more accurate results).
Not only was it more accurate, but it enabled me to reach a staggering accuracy of 82.39%!

By itself, this is not the most reliable indicator of a model’s accuracy. When making the predictions, I created smaller copies of the initial dataframe consisting of 73 days of predictions each, with the intention of performing easier visualization of the data.
In order to validate the accuracy of the real-time results, I will be manually creating a confusion matrix for one of the prediction dataframes.
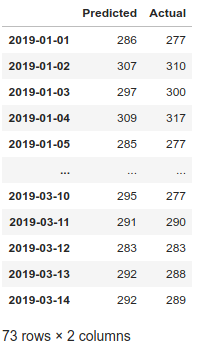
The image above depicts the predicted closing price and the actual closing price for the timespan of January 1st, 2019 — March 14th, 2019.
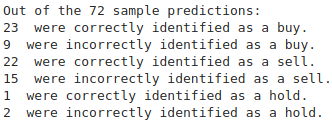
In order for the prediction to be considered successful, one of the following must be true:
- The predicted price of the next day was correctly identified as a “buy” (Predicted(n+1) > Predicted(n) && Actual(n+1) > Actual(n)).
- The predicted price of the next day was correctly identified as a “sell” (Predicted(n+1) < Predicted(n) && Actual(n+1) < Actual(n)).
- The predicted price of the next day was correctly identified as a “hold” (Predicted(n+1) == Predicted(n) && Actual(n+1) == Actual(n)).
This can be easily emulated by performing the following:
Results-Conclusion
The model presented an extraordinary accuracy of 82.39%.
Two main conclusions can be drawn from the aforementioned findings:
- The model can be used to chart a reliable trading strategy and possibly bring enormous returns to investors.
- Public opinion for Elon Musk plays a huge role in dictating the price of Tesla.
It is important to understand that applying the same strategy to predict the price of another stock/commodity, would not bring the same results. The reason for which there is such high accuracy is the correlation between the price of the stock and Elon Musk.
Self-improvement
We have now reached an accuracy of 82.39%. Although this number can be ameliorated even further from my side, I will not be doing so.
On the contrary, I will be providing you, the readers, with a short statement that can be used as grounds for improving the model.
The prediction’s accuracy can increase by adding more variables to the features (historical prices, daily sentiment). The nature of the variables may vary, but a safe bet would be :
- Technical indicators
- World economic data
- Supplementary industries
Thank you for reading and do not forget to leave constructive feedback!
Do you want to learn more?
If you want to advance your knowledge and are interested in making money using Machine Learning I highly encourage you to follow me and read the articles listed below:


