
ELK By Karthic Dkk
ELK Multi-Node Architecture: How to Go From Logs to Insights Like a Pro!- (Part2)
From Single Node to Multi-Node: Building a High-Availability ELK Setup
Breaking Down the ELK Stack Architecture for Large-Scale Deployments
What is ELK?
ELK is a set of tools that work together to help you collect, search, analyze, and visualize large amounts of data, such as logs and events. Think of it as a supercharged detective kit for understanding what’s happening in your systems or applications.
If you’re not a member of Medium, Please check here
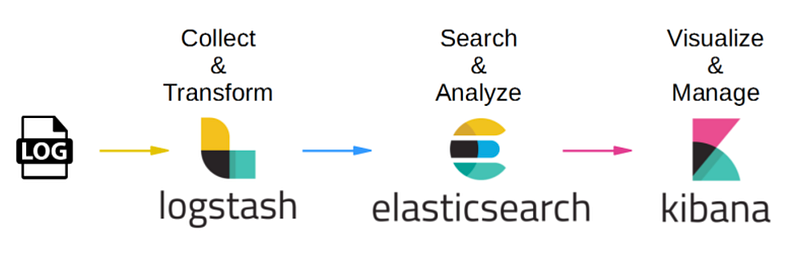
Here’s a simple breakdown:
E: Elasticsearch
- What it does: It’s like the brain of the system. Elasticsearch stores all your data in an organized way so you can search through it super fast.
- Example: Imagine you have thousands of WhatsApp messages, and you want to find all the ones where someone said “birthday.” Elasticsearch helps you find those messages instantly.
L: Logstash
- What it does: Logstash acts like a filter or translator. It takes messy data from different sources, organizes it, and sends it to Elasticsearch.
- Example: Let’s say you receive messages in different languages (English, Spanish, etc.). Logstash translates and organizes them so you can search or analyze them later.
K: Kibana
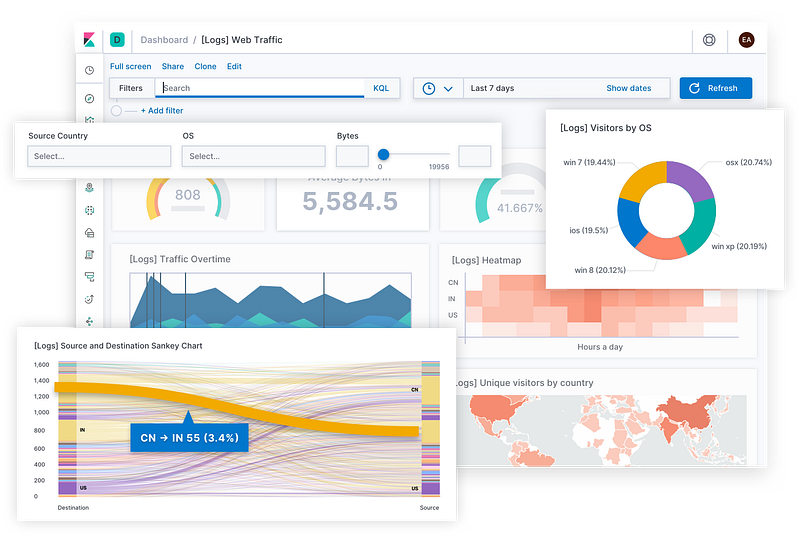
- What it does: It’s the visual tool. Kibana lets you see your data through colorful graphs, dashboards, and charts.
- Example: Instead of reading thousands of messages one by one, Kibana shows you patterns. For example, “Most messages were sent at 9 AM on Mondays.”
What Problem Solves by ELK?
Let’s say you’re running a café, and you want to know:
- When most people visit.
- Which drinks are most popular?
- If there are any issues with your coffee machines.
Here’s how ELK works in this café scenario:
- Elasticsearch: Stores all the information (orders, time of purchase, feedback, machine logs).
- Logstash: Organizes the incoming data (grouping orders by time or filtering complaints about machines).
- Kibana: Shows a dashboard that reveals:
- The busiest hours.
- The most popular drinks.
- When and why coffee machines need fixing.
Why is ELK Useful?
- For Problem Solving: Helps find the root cause of errors in systems quickly.
- For Tracking Trends: Shows patterns in your data to help improve decision-making.
- For Visualization: Converts raw data into easy-to-understand graphs and charts
In Simple Words:
ELK is like a detective, translator, and artist working together:
- The detective (Elasticsearch) finds clues (data) super quickly.
- The translator (Logstash) organizes the clues to make them understandable.
- The artist (Kibana) paints a picture of what’s happening, so everyone can see it clearly.
Let’s dive into Real-world practical…
Requirements:
Five Linux Servers.
- Elasticsearch 3 nodes — t2.xlarge
- Kibana UI (dedicated server) — t2.medium
- Logstash (dedicated server) — t2.micro
- With space of 50 GB [minimum]
For Testig Purpose you can Run Elasticseach,Kibana,logstash in a Single machine.
Note: Server Specifications vary depends on Log Volume and Usage of the servers.
Sample Elasticsearch configuration:
Sample Configuration: /etc/elasticsearch/elasticsearch.conf
cluster.name: my-cluster   #<-- Cluster name
node.name: node-1          #<-- Node name
network.host: 192.168.11.1 #<-- Current ES Node IP
http.port: 9200            #<-- ES port

# Nodes IP for discover
discovery.seed_hosts: ["192.168.11.1","192.168.11.2","192.168.11.3"]

# Assign Master: 192.168.11.1 , data:192.168.11.2 , ingest: 192.168.11.3
cluster.initial_master_nodes: ["192.168.11.1","192.168.11.2","192.168.11.3"]
node.roles: ["master","data","ingest"] # Specify node Role

path.data: /data/Elasticsearch/data  # Custom path for ES
path.logs: /data/Elasticsearch/logs  # Custom path for Logs
path.repo: /mnt/backup_storage       # Repo(backup) path

xpack.ml.enabled: false
1. Cluster Name
cluster.name: my-cluster- Purpose: This sets the name of the Elasticsearch cluster.
- Why it matters: All nodes in the same cluster must have the same
cluster.name. It ensures they can join and work together.
2. Node Name
node.name: node-1- Purpose: This assigns a unique name to the node within the cluster.
- Why it matters: Helps in identifying each node during debugging, monitoring, or performing specific tasks.
3. Network Host
network.host: 192.168.11.1- Purpose: Specify the IP address that this Elasticsearch node will bind to and listen on.
- Why it matters: Ensures the node is accessible over the network. Setting this to
192.168.11.1makes the node reachable at this IP.
4. HTTP Port
http.port: 9200- Purpose: The port on which Elasticsearch listens for HTTP requests (like REST API calls).
- Default:
9200is the default Elasticsearch HTTP port. You can change it if required.
5. Discovery Seed Hosts
discovery.seed_hosts: ["192.168.11.1","192.168.11.2","192.168.11.3"]- Purpose: Defines the list of IP addresses of nodes in the cluster that a new node should contact to discover and join the cluster.
- Why it matters: When a new node starts, it uses these seed hosts to find the rest of the cluster.
6. Initial Master Nodes
cluster.initial_master_nodes: ["192.168.11.1","192.168.11.2","192.168.11.3"]- Purpose: Informs Elasticsearch which nodes can participate in the initial cluster formation as master-eligible nodes.
- Why it matters: Used during the first cluster startup to elect the master node. Without this, the cluster cannot form properly.
7. Node Roles
node.roles: ["master","data","ingest"]- Purpose: Assigns roles to the node. Each role defines specific responsibilities:
- Master: Manages the cluster state (e.g., creating/deleting indices, managing nodes).
- Data: Stores data and handles search/query operations.
- Ingest: Processes data before indexing (e.g., applying pipelines).
- Why it matters: Proper role distribution improves performance and reliability. In this case, the node is assigned all three roles.
8. Custom Paths for Data and Logs
path.data: /data/Elasticsearch/data
path.logs: /data/Elasticsearch/logs
- Purpose: Specifies custom directories for storing:
- Data: Elasticsearch indices and shard data.
- Logs: Logs generated by the node.
- Why it matters: Helps in organizing and managing storage more effectively (e.g., using dedicated disks for data).
9. Backup Repository Path
path.repo: /mnt/backup_storage- Purpose: Sets the location for the Elasticsearch snapshot repository.
- Why it matters: Snapshots allow backing up and restoring data. You must configure this directory for Elasticsearch to recognize it as a valid repository.
10. Disable Machine Learning
xpack.ml.enabled: false- Purpose: Disables the Machine Learning (ML) feature in Elasticsearch.
- Why it matters: Disabling ML reduces resource usage on nodes that don’t require it, such as those used only for data or search.
Example Use Case:
Let’s map out the configuration to the cluster setup:
- Master Node (
192.168.11.1): Manages the cluster state. - Data Node (
192.168.11.2): Stores data and serves search/index requests. - Ingest Node (
192.168.11.3): Processes data before it is indexed into the cluster.
Pro Tips
- Role Separation:
- Avoid assigning all roles (
master,data,ingest) to the same node in production. It’s better to have dedicated nodes for each role for scalability and fault tolerance.
2. Backup Management:
- Ensure sufficient space in the
path.repodirectory. Schedule periodic snapshots to prevent data loss.
3. Cluster Health:
- Use the following command to monitor the cluster:
curl -X GET "http://192.168.11.1:9200/_cluster/health?pretty"4. ElasticSearch Version:
- Keep all nodes on the same Elasticsearch version to avoid compatibility issues.
How to Configure Multi-Node Elasticsearch Cluster for Production:
Hope you understood the basic concepts of elasticsearch configuration and its functions, Let’s configure the real-world servers.
keep your eye wide open, let’s build 🤠
Common for all ES Nodes: [step1 to step 3]
Execute the below steps for all the 3 Elasticsearch nodes.
Login to any one of Elasticsearch nodes and follow the below steps.
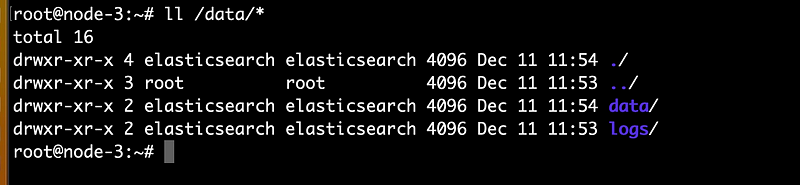
Step 1: Create a folder for Elasticsearch
Create a separate folder for Elasticsearch applications and logs. and provide the necessary permissions.
# Create folder
mkdir -p /data/Elasticsearch/data
mkdir -p /data/Elasticsearch/logs
mkdir -p /mnt/backup_storage
# Permissions
chown -R elasticsearch: /data/Elasticsearch/*
chown -R elasticsearch: /mnt/backup_storage
Step 1.2: Check Permissions
Step 2: Install Elasticsearch
To begin, let’s get Elasticsearch running. This is where your logs will be stored, indexed, and searched.
Using Repo: (ubuntu)
wget -qO - https://artifacts.elastic.co/GPG-KEY-elasticsearch | sudo gpg --dearmor -o /usr/share/keyrings/elasticsearch-keyring.gpg
sudo apt-get install apt-transport-https
echo "deb [signed-by=/usr/share/keyrings/elasticsearch-keyring.gpg] https://artifacts.elastic.co/packages/8.x/apt stable main" | sudo tee /etc/apt/sources.list.d/elastic-8.x.list
sudo apt-get update && sudo apt-get install elasticsearch
Download and install the Debian package manually [optional]
sudo apt update -y
sudo apt install -y openjdk-11-jre-headless  # Elasticsearch requires Java, so let's install that first
wget https://artifacts.elastic.co/downloads/elasticsearch/elasticsearch-7.10.0-amd64.deb
sudo dpkg -i elasticsearch-7.10.0-amd64.deb
sudo systemctl enable elasticsearch --now
How to download a specific version of Elasticsearch: (Optional)
Here is a past release: download 7–16–3
wget https://artifacts.elastic.co/downloads/elasticsearch/elasticsearch-7.16.3-amd64.debStep 3: Test Elasticsearch
Once installed, check if Elasticsearch is running by visiting http://localhost:9200 or IP-address:9200 from a web browser or curl:
curl -X GET "localhost:9200/"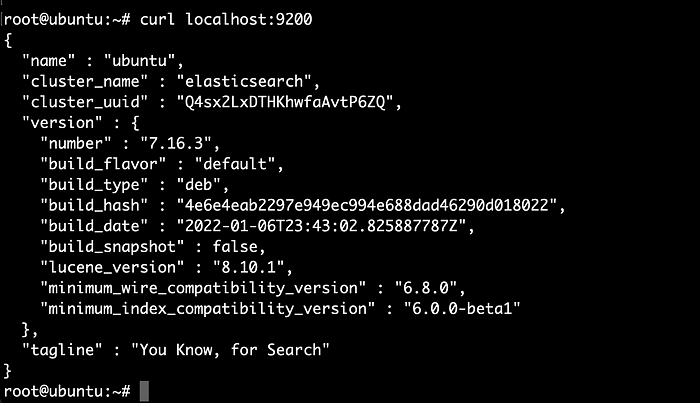
You should see JSON output with Elasticsearch details. If you see something like You Know, For Search, then it's working! 🎉
Execute the above steps from 1 to 3 for all the 3 Elasticsearch nodes.
Note: check out for more Elasticsearch
Step 4: Set Up Elasticsearch Server-1:
Before proceeding next steps, note down your Elasticsearch IP address and ports, Elasticsearch data location. Then change the config accordingly.
Edit cat /etc/elasticsearch/elasticsearch.yml
cluster.name: my-cluster
node.name: node-1
network.host: 192.168.11.1
http.port: 9200
discovery.seed_hosts: ["192.168.11.1","192.168.11.2","192.168.11.3"]
cluster.initial_master_nodes: ["192.168.11.1","192.168.11.2","192.168.11.3"]
node.roles: ["master","data","ingest"]
path.data: /data/Elasticsearch/data
path.logs: /data/Elasticsearch/logs
path.repo: /mnt/backup_storage
xpack.ml.enabled: false
Step 6: Set Up Elasticsearch Server-2:
Edit cat /etc/elasticsearch/elasticsearch.yml
cluster.name: my-cluster
node.name: node-2
network.host: 192.168.11.2
http.port: 9200
discovery.seed_hosts: ["192.168.11.1","192.168.11.2","192.168.11.3"]
cluster.initial_master_nodes: ["192.168.11.1","192.168.11.2","192.168.11.3"]
node.roles: ["master","data","ingest"]
path.data: /data/Elasticsearch/data
path.logs: /data/Elasticsearch/logs
path.repo: /mnt/backup_storage
xpack.ml.enabled: false
Sep 7: Set-Up Elasticsearch Server-3:
Edit cat /etc/elasticsearch/elasticsearch.yml
cluster.name: my-cluster
node.name: node-3
network.host: 192.168.11.3
http.port: 9200
discovery.seed_hosts: ["192.168.11.1","192.168.11.2","192.168.11.3"]
cluster.initial_master_nodes: ["192.168.11.1","192.168.11.2","192.168.11.3"]
node.roles: ["master","data","ingest"]
path.data: /data/Elasticsearch/data
path.logs: /data/Elasticsearch/logs
path.repo: /mnt/backup_storage
xpack.ml.enabled: false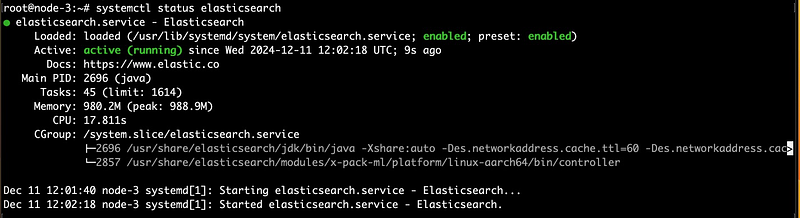
Step 8: Restart Elasticsearch in all nodes:
systemctl enable elasticsearch --now
systemctl restart elasticsearch
Step 9.1: Install and Configure Logstash Agent:
Install Logstash for any other machines or any of one ES nodes,
Configure logstash wherever you require to pull the logs to ES and config accordingly.
Logstash is the tool that pulls in logs from various sources and sends them to Elasticsearch.
sudo apt update
sudo apt install logstash
Specific Version: (Optional)
wget https://artifacts.elastic.co/downloads/logstash/logstash-7.16.3-amd64.debdpkg -i logstash-7.16.3-amd64.deb9.2: Configure Logstash Pipeline to send logs to Elasticseach
Now, let’s create a simple pipeline to collect logs.
Here’s a basic configuration:
sudo nano /etc/logstash/conf.d/sample.conf
input {
  file {
    path => "/var/log/*.log"
    start_position => "beginning"
  }
}
# filter {
#  grok {
#        Your log filter options here
#  }
# }
output {
  elasticsearch {
    hosts => ["http://192.168.11.1:9200","http://192.168.11.2:9200","http://192.168.11.3:9200"]
    index => "ubuntu_logs"
  }
}
This configuration does the following:
- It reads all logs in
/var/log/*.log.
Note: Make sure logstash has access to read /var/log/*.log
chmod 755 /var/log/*.log
- It uses
grokto parse log entries.(Optional) - It sends the logs to Elasticsearch in an index called ubuntu
_logs.
Restart logstash
sudo systemctl enable logstash --now
sudo systemctl restart logstash
Step 10.1 — Setting Up Kibana: Visualizing Logs with Style
Note: Here I am running Kibana in one of our ES nodes.
Kibana is where the magic happens — turning raw logs into neat graphs and dashboards.

10.2: Install Kibana
sudo apt update -y
sudo apt install kibana
Specific version:(optional)
wget https://artifacts.elastic.co/downloads/kibana/kibana-7.16.3-arm64.deb
dpkg -i kibana-7.16.3-arm64.deb
10.3: Configure Kibana to Connect to Elasticsearch
Edit the Kibana configuration file (/etc/kibana/kibana.yml) to point to your Elasticsearch instance:
sudo nano /etc/kibana/kibana.yml
Change the following line:
server.host: "192.168.11.2"                    # <-- server IP here
elasticsearch.hosts:
  - "http://192.168.11.1:9200"
  - "http://192.168.11.2:9200"
  - "http://192.168.11.3:9200"
10.4: Start Kibana
Now, start Kibana:
sudo systemctl enable kibana --now
sudo systemctl restart kibana
Visit http://localhost:5601 or http://IP-address:5601 in your browser to access Kibana.
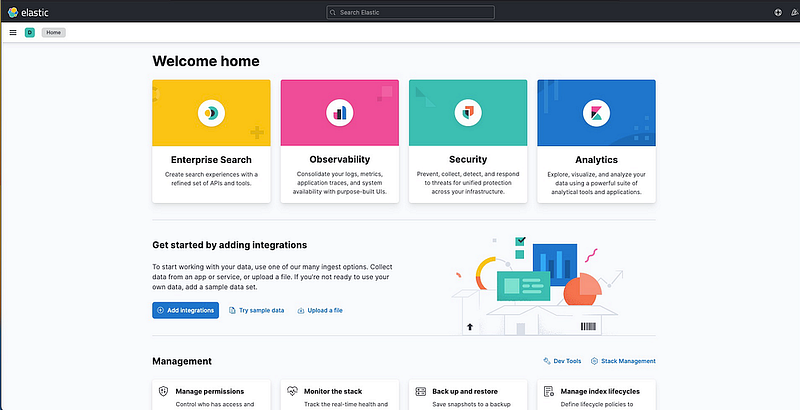
Configure Kibana Dashboard :
Index:
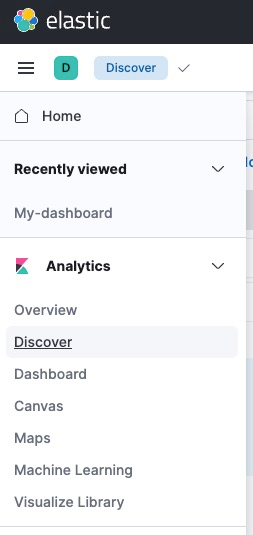
- Click Discover and create an index pattern
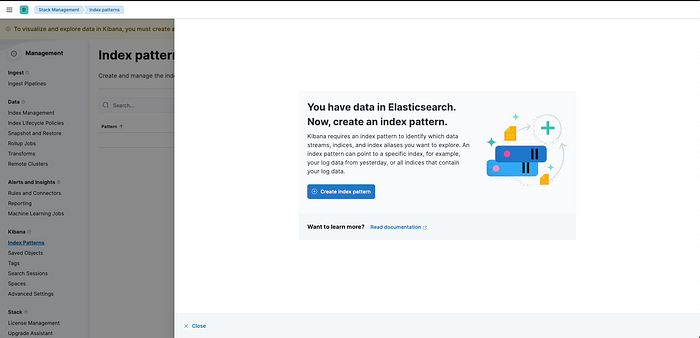
Name: ubuntu_logs , Timestamp field choose timestamp
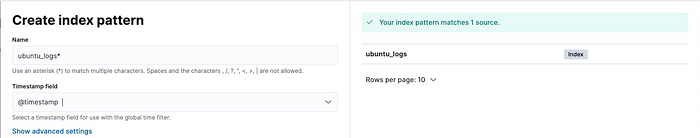
Note: index name same as elasticsearch index name.
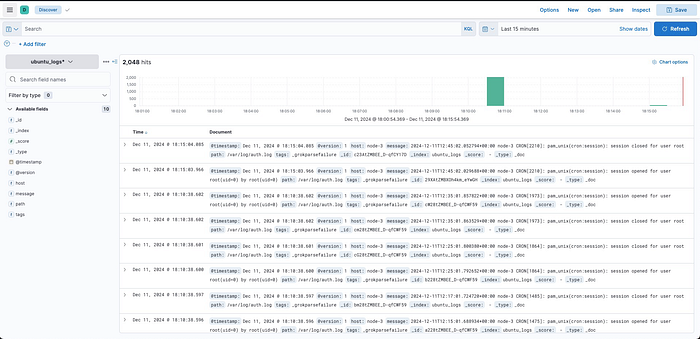
Once you add an Index on Kibana, you can view your index in the Discover field.
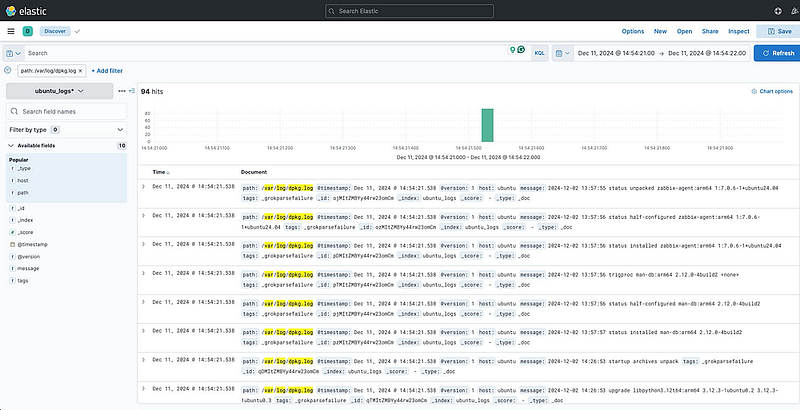
Filter Type: path click + symbol
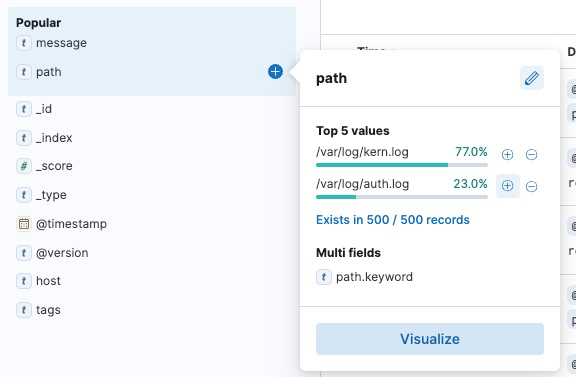
Then output same as below:
Dashboard:
- Now create a new Dashboard → Create Visualization
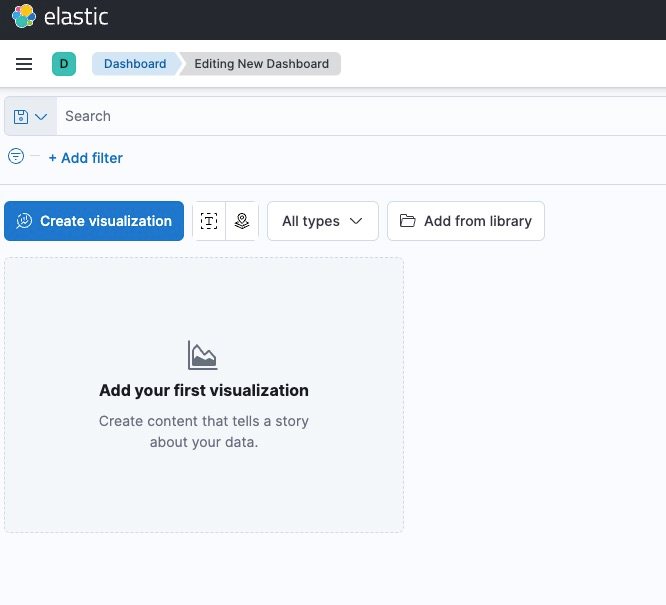
- Select the available fields, drag and drop to the right side.
- Here I choose Records
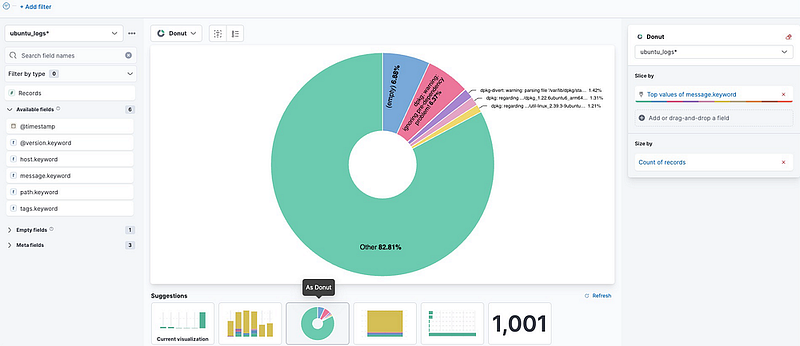
Kibana- create graph-1
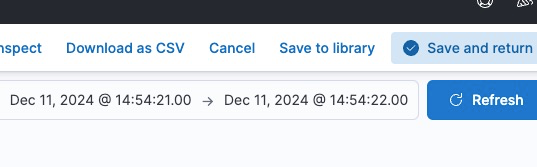
- Now choose the convenient the visualization on bottom tab, and Click Save and Return.
2. Add one more for timestamp fields
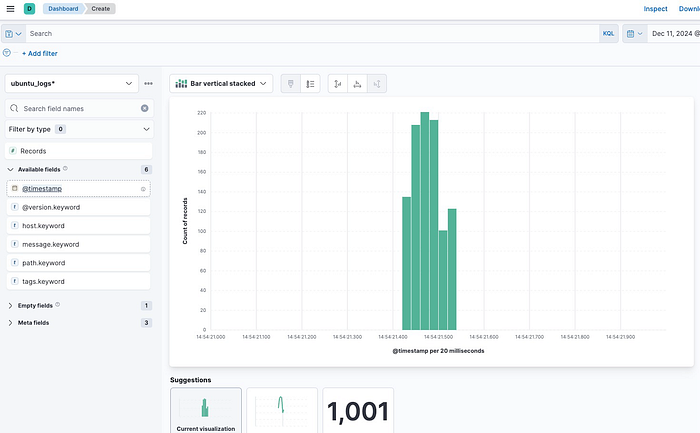
Kibana-create-graph-2
- Then Save the Dashboard with my-dashboard. And Go to the Dashboard Tab.
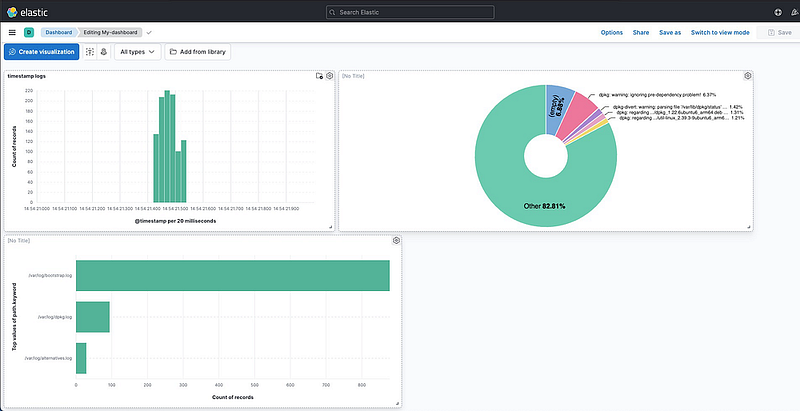
Same like above you can create multiple dashboards as per your wish.
Once all dashboards are set up. You should see a beautiful dashboard waiting for your logs!
Happy logging! 🖥️📊
Do you have more tips to add or horror stories to share? Drop them in the comments!
DevSecOps — Community 🚀
Thank you for being a part of the DevSecOps — Community community! Before you go:
- Be sure to clap and follow ️ Karthick Dkk ️️
- Follow: | LinkedIn | Newsletter | LinkedIn Groups | GitHub
- More content at DevSecOps — Community


